
Abstract
Background:
Early identification of Alzheimer’s disease (AD) may be extremely beneficial for delaying disease progression. Subjective cognitive decline (SCD) may be an early indicator of AD pathology. Not all individuals with SCD will eventually develop AD, making it critical to identify biomarkers during the SCD stage which indicate likely clinical progression.
Objective:
The present review aims to summarize available data on structural MRI and cerebrospinal fluid (CSF) biomarkers and their association with clinical progression to mild cognitive impairment (MCI) or AD in people with SCD.
Methods:
Database searches were conducted using Embase and PubMed until June 2020. Longitudinal studies assessing biomarkers in individuals with SCD and assessing clinical progression to MCI/AD were included. Two assessors performed data extraction and assessed the risk of bias in the included studies. Data were synthesized narratively.
Results:
An initial search identified 1,065 papers; after screening and review 14 studies were included. Sample size of the included studies ranged from 28–674, mean age was 60.0–68.6 years, and 10.2%–52%of participants converted to MCI/AD. Lower levels of CSF Aβ42 were consistently associated with clinical progression. Combination measures identifying an AD-like profile of Aβ42 and tau levels were strongly associated with clinical progression. Biomarkers identified with structural MRI were less conclusive, as some studies found significant associations while others did not.
Conclusion:
Biomarkers may be able to predict clinical progression in those with cognitive complaints. Aβ42, or combinations of Aβ42 and tau may be useful biomarkers in identifying individuals with SCD who will progress to MCI/AD.
Keywords
INTRODUCTION
Alzheimer’s disease (AD) is a highly prevalent neurodegenerative disease, affecting nearly 44 million people globally [1]. AD pathology progresses over time leading to a decline in cognitive functioning [2], which is thought to be a result of neuronal death and brain atrophy, in addition to the accumulation of amyloid-β (Aβ42) plaques and tau tangles in the brain [3]. Early identification of patients who may progress to AD has important implications for early interventions to prevent objective cognitive decline, and previous research suggests that AD can be identified prior to the presentation of clinical symptoms [4]. Early intervention can potentially slow the progression of decline, prolonging cognitive and functional abilities [2].
It has been suggested that subjective cognitive decline (SCD) may be an early indicator of AD [5]. SCD refers to an individual’s perception that their memory or other cognitive abilities are worse than they used to be, without demonstrating any objective neuropsychological deficits [6]. SCD may become present years prior to progression to mild cognitive impairment (MCI), the clinical stage preceding AD, or AD [6]. However, it is important to note that not all individuals with SCD will eventually develop AD. The concept of SCD as a preclinical stage of AD is quite heterogenous, and recent attempts have been made to standardize the assessment of SCD. The Subjective Cognitive Decline Initiative (SCD-I) working group aimed to address this deficiency by creating criteria for pre-MCI SCD [6]. These criteria include features which increase the likelihood of preclinical AD, such as biomarker evidence for AD, or apolipoprotein E (APOE) genotype.
Several biomarkers of AD have been identified, including both neuroimaging markers [7] and cerebrospinal fluid (CSF)-based biomarkers [8]. Lower than normal CSF Aβ42 and elevated total tau (tTau) have been associated with the development of AD pathology [9]. Combinations of these two proteins may be better predictors of clinical progression than a single biomarker [10]. Furthermore, the 2011 National Institute on Aging-Alzheimer’s Association (NIA-AA) criteria includes hippocampal atrophy and rate of brain atrophy as neuroimaging markers of AD [11, 12]. In addition, previous studies have associated structural MRI findings of small vessel disease, i.e., white matter hyperintensities (WMH), lacunes, and microbleeds, with AD and CSF markers typical of AD pathology [13, 14]. However, it is not clear whether these markers precede or follow AD pathology, indicating the importance of longitudinal studies [13, 15].
Previous research has identified associations between AD biomarkers and pre-clinical AD stages. However, the majority of these studies have assessed the association between these biomarkers and severity of AD progression in patients with objective memory complaints [16, 17]. Also, a large portion of studies have been cross-sectional, comparing cognitively normal adults to those along the AD spectrum; because there are many variables that may contribute to SCD, longitudinal studies that follow the clinical progression of the same individuals over time can better distinguish biomarkers during the SCD stage which may predict clinical progression.
The aim of this study was to review the current research investigating the association of biomarkers with conversion to MCI or AD dementia over time in individuals with cognitive complaints, but no objective memory or cognitive problems at baseline, in order to identify possible biomarkers of decline that may appear before any clinical deficits can be observed. This review will give particular attention to well-known markers of AD including structural MRI biomarkers including cortical atrophy, hippocampal atrophy, WMH, microbleeds, and lacunes, and CSF biomarkers including levels of Aβ, tTau, and phosphorylated tau (pTau).
METHODS
This systematic review followed the PRISMA (Preferred Reporting Items for Systematic reviews and Meta-analysis) guidelines [18].
Search strategy and selection criteria
An electronic search was performed through PubMed and EMBASE. Studies published until June 2020 were included. This search utilized the PICOS approach (Table 1). Search terms included a number of terms for SCD including “memory complaints” OR “subjective memory complaints” OR “subjective memory decline” OR “subjective memory impairment” OR “cognitive complaints”, terms for biomarkers including “neuroimaging” OR “brain imaging” OR “MRI” OR “biomarker*” OR “cerebrospinal fluid” OR “CSF” OR “tau” OR “amyloid” OR “brain volume”, and terms for AD, including “dementia” OR “Alzheimer” OR “AD” OR “MCI” OR “Mild cognitive impairment”. The full search strategy can be found in the Supplementary Material.
Systematic search strategy (PICOS strategy)
Two assessors (M.S. and I.R.) performed the data extraction. The results of the search were reviewed in order to identify individuals who had subjective memory complaints and no objective memory problems, who were assessed for one of the biomarkers of interest, and were assessed at least one follow-up point for conversion to MCI/AD. Inclusion criteria were: 1) longitudinal, observational studies; 2) measured structural MRI, positron emission tomography (PET), or CSF biomarkers, including Aβ42, total tau, phosphorylated tau; 3) participants or an informant had reported cognitive complaints; 4) participants had a clinical assessment for MCI/AD at follow-up.
Articles were excluded if they fit at least one of the following criteria: 1) cross-sectional studies; 2) participants categorized as SCD but had objective cognitive deficits at baseline; 3) follow-up did not include assessment for conversion to AD/MCI; 4) SCD and MCI were grouped together in the data analysis. No restrictions were set for the study setting or time frame. Studies conducted in both clinical settings and in the community were considered. Only published articles in English were included. Structural MRI in this review includes any static anatomical or cerebrovascular information obtained using magnetic resonance imaging, including T1- and T2-weighted sequences and fluid attenuated inversion recovery (FLAIR).
First the articles from both PubMed and EMBASE were reviewed, and duplicates removed. Then titles and abstracts were reviewed and studies that were irrelevant or did not meet the inclusion criteria were removed. Full texts were then reviewed and those not meeting the criteria were excluded.
Data collection and synthesis
From each article the following information was extracted by M.S. and I.R.: author, publication year, journal title, characteristics of the study population (age, sex, baseline Mini-Mental State Examination (MMSE) score), study setting, sample size, duration of follow-up, method of SCD assessment, criteria for AD-continuum diagnosis, biomarker assessed and how the biomarker was assessed (i.e., continuous, cut-off point, z-scores), and summary of main findings. Results from the included studies were synthesized narratively.
Risk of bias
The quality of the included studies were evaluated using the Quality in Prognostic Studies (QUIPS) tool [19]. QUIPS assesses the risk of bias in the following categories: study participation, study attrition, prognostic factor measurement, outcome measurement, study confounding, and statistical analysis and reporting. Studies are rated as “low”, “moderate”, “high”, or “unclear” risk of bias for each category.
RESULTS
Study selection
In the initial search, 822 records were identified through PubMed, and 841 records were identified through Embase, for a total of 1,663 records. After removing 598 duplicates, the title and abstract of 1,065 records were screened, and 71 were eligible for further consideration. After reviewing the full text of these articles, 14 studies met all of the inclusion criteria. A summary of the selection process can be found in Fig. 1.
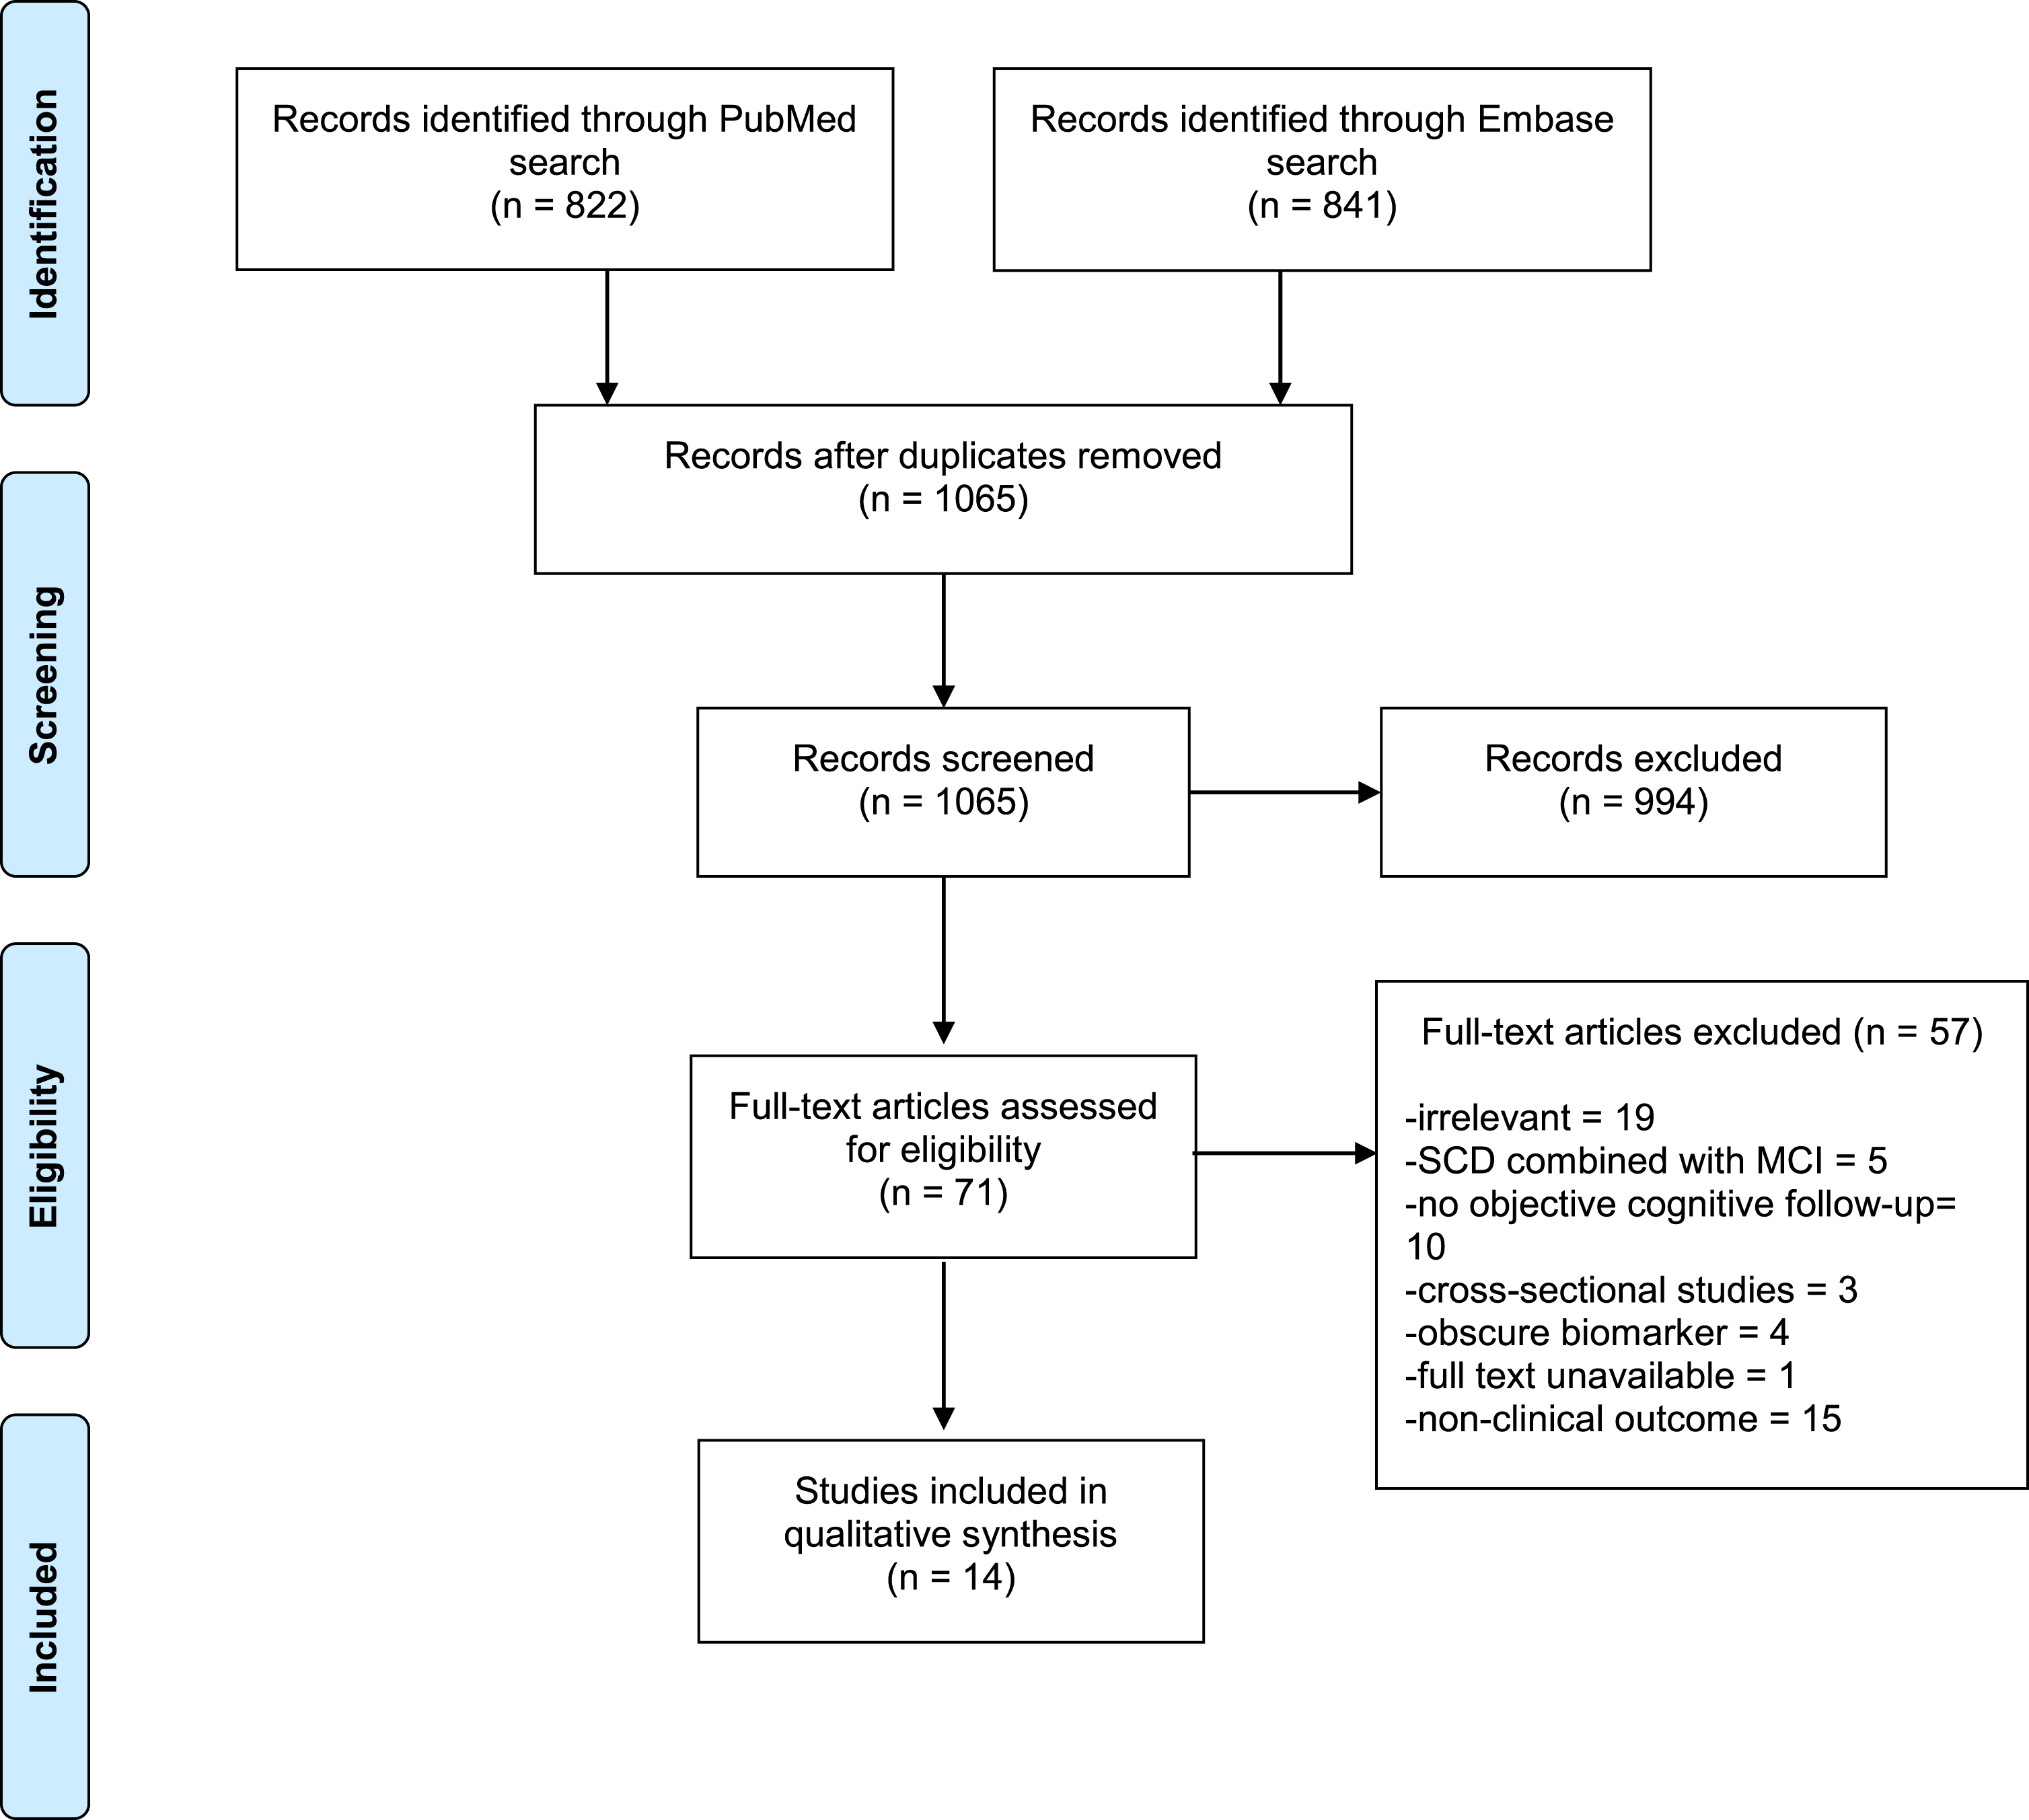
PRISMA flow diagram summarizing literature selection process.
Description and quality of studies
Of the 14 selected studies, participants from 13 were referred to a memory clinic based on self or informant-reported cognitive complaints [20 –32]; the recruitment setting of participants in the remaining included study was unclear [33]. All studies were cohort studies, eight of which utilized the same cohort, the Amsterdam Dementia cohort. SCD participants from the included studies were mostly older adults, with mean ages ranging from 60.0 to 68.6 years old. All studies consisted of both male and female participants (29%–73%female). All studies excluded participants with known neurologic or psychiatric conditions and included a baseline MMSE measurement.
The included studies investigated the relationship between clinical progression to MCI or AD and either CSF (Aβ42, tau), PET, or structural MRI biomarkers (cortical thickness, hippocampal atrophy, WMH, lacunes, microbleeds). Studies that measured biomarkers using PET were evaluated for inclusion; however, these studies did not include clinical assessment at follow-up and were subsequently excluded. The sample size of SCD participants ranged from 28–481, with a mean follow up time ranging from two to four years. The percentage of participants progressing to MCI/AD ranged from 10.2%–52.0%. For further study characteristics see Table 2.
Description of included studies
NINCDS-ADRA, the National Institute of Neurological and Communicative Disorders and Stroke and the Alzheimer’s Disease and Related Disorders Association; SCD, subjective cognitive decline; MCI, mild cognitive impairment; NIA-AA, National Institute on Aging –Alzheimer’s Association; AD, Alzheimer’s disease; GDS, Global Deterioration Scale; CERAD, Consortium to Establish a Registry for Alzheimer’s Disease.
The selected studies were assessed for risk of bias using QUIPS. The results of this assessment can be found in the Supplementary Material. The included studies were deemed to have low or moderate risk of bias on each of the six domains included in the QUIPS assessment.
SCD evaluation
The most commonly used criteria for SCD evaluation was the SCD-I framework [6], since this was utilized in studies based on the Amsterdam Dementia cohort [21 , 32]. Other studies included participants that were referred by a clinician based on self or informant-reported cognitive complaints and did not meet criteria for MCI or AD [28, 33]. The remaining studies utilized global deterioration scale scoring to identify SCD participants [22], or other criteria specified by the researchers [20 , 30]. For further details of SCD evaluation, see Table 2.
Outcome measurement
Of the included studies, nine (including eight Amsterdam Dementia cohort publications) [20 , 32] utilized the MCI criteria of Petersen et al. [34]. After 2012, the Amsterdam dementia cohort utilized the NIA-AA criteria for MCI [11]. The remaining studies used the global deterioration scale, or criteria derived from multiple evaluation tools [22, 35]; details can be found in Table 2. Progression to AD was assessed using the NINCDS-ADRA [36] criteria in eleven studies [20 , 31–33], including studies from the Amsterdam Dementia
cohort prior to 2012. NIA-AA [12, 37] diagnostic criteria for AD was used in eight studies [21 , 32], including those from the Amsterdam Dementia cohort after 2012, and global deterioration scale score was used in two studies [22, 30].
Findings
Seven studies investigated the association of volume or atrophy of cortical brain regions, and clinical progression, and nine studies investigated the association of CSF biomarkers Aβ42 and/or tau and clinical progression, with two studies evaluating both structural MRI and CSF markers. A full summary of findings can be found in Table 3.
Results of included studies
SCD, subjective cognitive decline; MCI, mild cognitive impairment; AD, Alzheimer’s disease; WMH, white matter hyperintensity; EC, entorhinal cortex; tTau, total tau; pTau, phosphorylated tau; CSF, cerebrospinal fluid.
Structural MRI biomarkers
Details regarding the MRI acquisition and post-processing of the included studies can be found in Table 4.
Details from included studies on MRI acquisition and post-processing
GRASS, gradient recalled echo acquisition at steady state; WMH, white matter hyperintensity; FLAIR, Fluid-attenuated inversion recovery; SIENAX, Structural Image Evaluation using Normalization of Atrophy Cross-sectional); tTau, total tau; pTau, phosphorylated tau; CSF, cerebrospinal fluid; ELISA, enzyme-linked immunosorbent assay.
Whole brain volume
Two of the included studies assessed the relationship between whole brain volume and clinical progression [20, 26]. When assessing atrophy, the mean difference in rate of change per year between SCD patients did not vary greatly from controls (rate of change (%/year), mean difference: 0.29, 95%CI: –0.65 –0.07) [20]. Similarly, the second study assessed normalized whole brain volume (cm3) and found that this measurement did not add prognostic value to a model including baseline MMSE and CSF biomarkers, and thus was not retained in the final model [26]. Taken together, it is likely that whole brain volume or atrophy is not a good indicator of clinical progression in SCD patients.
Cortical volume/thickness
Six of the included studies assessed the association of cortical thickness or volume with subsequent progression to MCI/AD [20 , 31–33]. One study found that thinner frontal, occipital, and temporal cortices were all significantly associated with conversion [27]. However, in a stratified analysis, thinner AD-signature cortex was predictive of clinical progression to dementia, but not progression to MCI, indicating that those with thinner cortical regions may be at risk for a worse course of cognitive decline. In the same study, temporal medial lobe volume was significantly associated with progression to MCI/AD (HR = 5.0, 95%CI: 2.0–11.0). Conversely, another study assessed global cortical atrophy and medial temporal lobe atrophy (cm3) and found that these measurements did not add prognostic value to a model including baseline MMSE and CSF biomarkers, and was not retained in the final model [26]. This suggests that CSF biomarkers may explain some of the variability in cortical volume and clinical progression, or that baseline volume may be a better predictor than atrophy. Furthermore, in a study assessing a disease state index (DSI) as a predictor of disease progression, a combination of diagnostic tests including both CSF and MRI variables (including hippocampal volume) was a better predictor than either measure alone, however, as a single variable CSF measures provided better balanced accuracy than MRI markers [32].
Studies assessing the relationship between clinical progression and hippocampal volume/thickness at baseline had mixed results. When comparing hippocampal atrophy in SCD subjects and controls, the mean difference in rate of change per year between SCD patients did not differ significantly from controls (rate of change (%/year), mean difference: –0.04, 95%CI: –0.62–0.55) [20]. Studies assessing baseline volume rather than change over time found mixed results. Using normalized volumes, one study found no significant association between hippocampal volume and clinical progression [33]. Similarly, another study assessing hippocampal volume as a continuous measurement (cm3), found that hippocampal volume did not add prognostic value to a model including baseline MMSE and CSF biomarkers, and was not retained in the final model [26]. However, another study assessed hippocampal volume and found that a smaller volume was significantly associated with conversion (HR = 2.0, 95%CI:1.0–2.0) [27]. The disparity among these studies may be related to differences in measurement or analysis.
One of the included studies assessed the relationship between entorhinal cortex volume and conversion to MCI/AD, and found a significant association between baseline normalized entorhinal cortex volume and subsequent clinical progression (OR = 0.993 per normalized unit volume, 95%CI: 0.99–1.00) [33]. These results were not changed when adjusting for age or follow-up interval.
When assessing the relationship between cortical thickness and progression in specific cognitive domains, a steeper decline in memory was associated with a thinner temporal cortex in patients who progressed compared to those who remained stable [31]. In addition, thinner frontal parietal and temporal thickness was related to language decline only in patients who progressed to MCI/AD, suggesting that thinner cortical regions are likely related to specific symptoms of cognitive decline.
Cerebrovascular measures
One of the included studies assessed the relationship between cerebrovascular lesions and clinical progression [21]. Both mild and severe WMH were strongly associated with subsequent MCI or AD (HR mild = 2.4, 95%CI: 1.1–5.5, severe: 3.8, 1.1–12.8), but moderate WMH were not predictive of progression. Additionally, microbleeds and lacunes were not significantly associated with clinical progression (HR≥5 microbleeds: 1.7, 95%CI: 0.5–5.9,≥3 lacunes: 2.0, 0.5–8.4).
Cerebrospinal fluid biomarkers
Details regarding the CSF acquisition and measurements of the included studies can be found in Table 4. It is important to note that of the nine studies which measure CSF markers, five come from the Amsterdam Dementia cohort.
Amyloid
CSF Aβ42 was measured as an independent predictor of clinical progression in six of the included studies [22 , 28–30], largely indicating strong associations between lower levels of Aβ42 and subsequent AD/MCI. Studies that dichotomized Aβ42 levels found significant associations, OR = 16.0 (95%CI: 3.8–66.4) [25], HR = 22.56 (95%CI: 1.69–298.29) [22], OR = 5.60 (1.20–25.6) [30], indicating that Aβ42 levels below 550 ng/L, 500 ng/L, or 482 ng/L, respectively, indicate an increased odds of conversion to MCI or AD. However, in a study that increased the cut-off to Aβ42 < 600 ng/L, there was a significant association between Aβ42 and clinical progression in a model adjusted for sex, age, and MMSE score, but this effect was diminished after accounting for APOE ɛ4 status [28]. The studies using a 550 ng/L [25], and 482 ng/L [30] cut-offs also adjusted for APOE ɛ4 and maintained significant associations between Aβ42 levels and cognitive decline, indicating that the higher cut-off level of 600 ng/L may not be sensitive enough to find an association with clinical progression. Two studies used z-scores to examine the association between Aβ42 and progression to MCI/AD, both finding a strong relationship between lower Aβ42 levels and increased risk of conversion [24, 29]. In studies using a continuous measure of Aβ42, lower levels were also associated with conversion to MCI/AD [26]. Additionally, another study found that lower plasma Aβ42/Aβ40 ratio was associated with an increased risk of clinical progression to MCI or dementia (HR = 1.67, 95%CI = 1.15–2.44) [29].
Tau
Of seven studies that assessed total tau as an independent predictor [22 , 28–30], six found no significant relationship between total tau and clinical progression. Total tau was dichotomized in four of the included studies, though all studies used different cut-off points [22 , 30]. Studies that used z-scores to assess this relationship also found no significant association between total tau and conversion [24, 29]. In addition, when total tau was assessed as a raw measure, there was a relationship between elevated levels of tau, and clinical progression (coefficient = 1.38, 95%CI: 0.60–2.16) [26].
Similar results were found when assessing phosphorylated tau. In four studies using different cut-off points, no significant associations were found between pTau and clinical progression [22 , 30]. Studies utilizing z-scores to assess this relationship also found no significant association between pTau and subsequent MCI/AD [24, 29]. However, another study found an association between elevated levels of pTau and MCI/AD (coefficient = 1.23, 95%CI: 0.29–2.17) [26]. Findings suggest that tau is a less sensitive biomarker for progression than Aβ42; however, tau as a continuous measurement may still provide some prognostic value.
Combined amyloid/tau biomarkers
Several studies assessed the predictive value of ratios or formulas utilizing two or more CSF biomarkers. The ratio of tTau/Aβ42 was not found to predict conversion to MCI/AD after six years [22]. One study found no significant association between clinical progression and Aβ42/tau, but found that combined amyloid + tau abnormality (Aβ42 < 600 pg/ml, CSF Tau > 300 pg/ml) was a stronger predictor of clinical progression than Aβ42 or tau alone [28]. This association was maintained after adjustment for age, gender, baseline MMSE score, and APOE ɛ4. Another study dichotomized participants based as normal (Aβ42/pTau > 6.43) or abnormal (Aβ42/pTau < 6.43), finding that all SCD participants that converted to AD had an abnormal ratio. Out of 55 participants with SCD at baseline, three progressed to AD, all with an abnormal ratio at baseline, and 11 converted to MCI, three had an abnormal ratio, three had pathological Aβ42 values, and five had a normal Aβ42/pTau ratio [23], indicating that an abnormal ratio may predict clinical progression. However, in the regression analysis participants with baseline SCD and MCI were combined, so this association was not tested statistically. In a study developing prognostic models based on abnormal/normal ratios (Aβ42 = 10th/90th percentile, tau = 90th/10th percentile), normal CSF biomarkers strongly decreased progression probabilities (Harrell’s C = 0.82), while abnormal CSF markedly increased risk of conversion over five years (%progression, 95%CI: 96%, 56–100), and three years (89%, 44–99) [26]. Taken together, these findings suggest that a combination of abnormal Aβ42 and tau is a strong predictor of clinical progression.
Finally, when combining several measures to predict of disease progression, a combination of diagnostic tests including both CSF (Aβ42, pTau, and tTau) and MRI variables was a better predictor than either measure alone, however as a single variable CSF measures provided better balanced accuracy than MRI markers or demographics [32].
DISCUSSION
We identified fourteen studies assessing the predictive value of CSF and structural MRI biomarkers for progression to MCI/AD in adults presenting with SCD in memory clinics. Collectively, lower levels of CSF Aβ42 and combination measures identifying an AD-like profile of Aβ42 and tau levels were strongly associated with conversion to MCI/AD. Tau is a less sensitive biomarker for progression than Aβ42. Biomarkers identified with structural MRI were less conclusive. Whole brain atrophy does not appear to be related to clinical progression to MCI/AD. However, findings from structural MRI of cortical regions and WMH may be predictive of conversion.
Lower levels of CSF Aβ42 were consistently associated with subsequent conversion, regardless of dichotomous, continuous, or normalized measurement of Aβ. The accumulation of Aβ42 peptides in the brain have long been credited with the progression of AD [38]. Decreased levels of CSF Aβ42 indicate abnormal accumulation in the brain [39], contributing to the formation of neuritic plaques, and subsequent neurodegeneration and cognitive impairments [40]. However, differences in findings based on different cut-off points may have implications for pathological levels of Aβ42 and/or tau; using a lower cut-off for CSF Aβ42 appears to correspond with a stronger association. Our findings indicate that tau is less predictive of clinical progression to MCI/AD. Only one of the included studies found a significant association between baseline tTau or pTau levels and development of MCI/AD [26].
Combined measures of Aβ42 and tau were shown to be predictive of conversion, most strongly when both Aβ42 and tau were identified as abnormal. Several studies have indicated that an AD-like CSF profile is more common in individuals with SCD than individuals without complaints [2]. Previous reviews assessing Aβ42 and tau levels found little evidence in cross-sectional studies that AD-related CSF biomarkers could differentiate individuals with SCD from healthy controls, but that in longitudinal studies, low levels of CSF Aβ42 or combined low Aβ42/high tau levels were strong predictors of objective cognitive decline [41, 42]. In addition, current models for progressive AD stages also suggest that individuals with low CSF Aβ42 may be in preclinical or asymptomatic stages [40, 43].
Findings from structural MRI studies were somewhat inconclusive, though this may be due to smaller sample sizes or inconsistencies among scanner types or systems. It is important to note that the differences in segmentation strategies pose a challenge to pooling these results, as the variability in measurement may explain a significant portion of the differences in observed effects [44]. Based on the two studies included in this review, whole brain atrophy does not appear to be related to clinical progression to MCI/AD. Previous studies have demonstrated that whole brain atrophy is a marker of AD progression [45], suggesting that the participants included in these studies may not have reached a disease stage where this association can be seen. However, findings from structural MRI of cortical regions may be predictive of conversion. Six studies measured thickness, volume, or atrophy in these regions and two found significant associations between entorhinal cortex volume or hippocampal volume and clinical progression to MCI/AD.
The studies included in this review were mixed but suggest that EC and hippocampal volume may be predictive of clinical progression. However, the study included in this review that found no association between hippocampal atrophy and clinical progression had a very small number of clinical conversions (n = 4, 12.5%) over two years, which may mean there was not enough power or a long enough follow-up period to find such an association [20]. Additionally, differences in findings may be related to methodologies used, as studies included this review with divergent findings regarding the predictive value of hippocampal atrophy used differing segmentation methods; one used automated segmentation based on shape models and voxel intensities to obtain hippocampal volumes [27], while the other manually outlined the hippocampus [20].
Hippocampal atrophy has been associated with progression from MCI to AD [46], indicating that these changes take place later in disease progression and hippocampal atrophy as a biomarker may be more predictive further along the AD continuum. The hippocampus plays an important role in memory, and pathological alterations in this region likely contribute to subsequent memory impairments many years prior to clinical diagnosis [4, 47]. A decline in cortical thickness [48, 49] and atrophy of the medial temporal lobe, including the hippocampus and entorhinal cortex [50 –52] are known to be associated with AD. As the disease progresses, neuronal degeneration can be seen in the thinning of the left anterior cingulate, and medial temporal, parietal, and occipital lobes [53, 54]. Cortical thinning is also related to symptom severity along the progression to AD [54], so as neuronal loss increases, cognitive impairments become worse. Consequently, the 2011 National Institute on Aging-Alzheimer’s Association (NIA-AA) criteria includes hippocampal atrophy and rate of brain atrophy as biomarkers of both MCI and AD [11, 12]. While changes in volume take many years to build up, and thus may not be the most sensitive marker for pre-clinical stages, a number of studies have found alterations in AD signature regions in both clinical and community based SCD samples [55, 56]. Consequently, this review aimed to explore the sensitivity of these markers as predictors of clinical progression from SCD, finding that these markers may be best utilized in more advanced techniques including multimodal imaging and machine learning.
Evidence based on cerebrovascular lesions was only available from one study, which suggested WMH are associated with clinical progression to MCI/AD; however, this area is relatively understudied, and additional research into cerebrovascular markers of SCD is necessary to determine their prognostic value of conversion to MCI/AD. Cerebrovascular disease frequently co-occurs with AD [57], and thus structural MRI can be used to measure cerebrovascular lesions that may be associated with progression to MCI/AD. WMH, lacunes, and microbleeds are often results of small vessel disease, a significant cause of cognitive decline [58]. However, it is not clear whether these markers precede or follow AD pathology, indicating the importance of longitudinal studies [13, 15]. Interestingly, WMH and microbleeds have also been associated with increased CSF markers of AD pathology [13, 14]. In addition, segmentation methods may have an influence on the predictive ability of WMH, lacunes, and infarcts. Few studies have assessed the risk of progression from SCD based on these markers. However, cross-sectional studies have found greater WMH volumes in participants with SCD compared to healthy controls [59], which is in line with the findings presented in this review. Cerebrovascular changes have also been associated with amyloidosis, with both contributing to cognitive decline [60, 61]. While this could be explained by common risk factors such as smoking, or other mechanisms that accelerate Aβ42 deposits due to cerebrovascular changes, it is also possible that combining amyloid and cerebrovascular measures may be a strong predictor of clinical progression.
The search conducted for this review included PET markers; however, we did not identify any studies which utilized this technique in an SCD population and included a clinical follow-up. There is a significant need for such studies, as PET markers have superior accuracy in identifying AD [62], and are better predictors of progression from MCI to AD [63], compared to other imaging modalities. Studies assessing the sensitivity of these markers to predict clinical progression from SCD would be largely beneficial to the field.
Limitations
There are some limitations to the present review. We were able to include fourteen studies in this review based on the inclusion and exclusion criteria. Eight of the included studies came from the Amsterdam Dementia cohort, and there is likely quite a bit of overlap in participants, and a high degree of homogeneity within the cohort, limiting the generalizability of our findings. Furthermore, it is important to note the risk of publication bias, as negative findings are less likely to be published, which may lead to the included markers appearing to be better predictors of clinical progression than they are. In addition, only one study measuring cerebrovascular predictors met our criteria. Nine of the included studies assessed CSF-based biomarkers, though the method of measurement varied between studies; four used cut-off points, two used z-scores, one used raw scores (and subsequently, dichotomous normal/abnormal), one used a continuous measure in a disease state index, and one used cut-offs of Aβ42/tau ratio, making it difficult to quantitatively compare or pool results between studies, making a meta-analysis of these results infeasible. Furthermore, most of the studies had a relatively short follow-up time of two to three years. It is very likely that this is not enough time for clinical progression to occur, as SCD and AD-like biomarkers can both appear up to 10 years prior to AD-dementia [64]. As a result, some of the included studies had small numbers of participants converting to MCI/AD and may have lacked power to find significant associations or resulted in chance findings. There were also some differences in the measurement of both SCD and clinical outcome, though all included studies excluded participants for neuropsychiatric conditions and did not categorize participants with any objective deficits as SCD. It is possible that individuals presenting to a memory clinic but who do not qualify for MCI diagnosis have more severe memory problems than an individual with memory complaints who does not seek assistance.
It is important to note that this review included only classical markers, though recent studies have indicated that tau fragments and other early biomarkers, including glial fibrillary acidic protein, which may be sensitive to cognitive decline [65], and N-224 tau fragment, which has been found to be elevated in AD patients, and distinguish between AD and other dementias [66]. Additionally, there are a number of blood biomarkers such as plasma p-tau231, which detects pre-amyloid AD [67], and t-tau, glial fibrillary acidic protein, neurofilament light protein, and N-terminal fragment of tau, which have been associated with cognitive decline and development of clinical AD in longitudinal studies [68 –70], though the relationship across the clinical spectrum may not be linear [71]. Tau contributes to neurofibrillary tangles, leading to cognitive impairments [40]. As a result, elevated total tau has been associated with clinical progression in cognitively normal subjects [9]. However, reduced levels of CSF Aβ42 have commonly been found to be indicative of objective cognitive decline, whereas changes in levels of tTau and pTau seem to occur closer to diagnosis of dementia [72], which may explain the findings in this review.
Strengths of the present review include that two people performed the data extraction with similar results, data collection, and synthesis. The overall quality of the included studies was relatively high, based on the QUIPS risk of bias assessment tool. In addition, all studies had both male and female participants, within a valid age range, and all studies excluded participants with known neurologic or psychiatric conditions. Criteria used in the included studies for MCI and AD were largely standardized, and all studies used widely accepted methods of diagnosis.
CONCLUSION
CSF Aβ42, combinations of amyloid and tau, or combinations of amyloid and cerebrovascular lesions may be the best indicators of future clinical progression to MCI/AD in individuals presenting with subjective cognitive complaints. However, additional longitudinal studies in more diverse populations with longer follow-up times are needed to confirm these findings. In addition, diversity of study settings may yield different results, as those reporting to a memory clinic likely have different neurocognitive or psychological profiles than the general population. Furthermore, the current study focuses on markers that are known to be affected in AD. Given the disease time course, it is certainly possible that more sensitive markers including serum tau fragments and neurofilament light proteins, may be better candidates for early signs of AD than structural changes, which may take many years to present. Consequently, additional research is needed to investigate the potential of vascular markers, and vascular markers in combination with Aβ42, in addition to PET, early CSF, and blood biomarkers. However, the potential of pre-AD biomarkers in individuals with SCD has many important implications for research and clinical practice. Specific biomarker profiles may be able to discriminate between individuals with cognitive complaints that will progress to AD or other forms of dementia, and those who will not develop clinical cognitive deficits. A specific biomarker profile, potentially using a combination of CSF and neuroimaging biomarkers, may identify participants for future clinical trials aimed at early interventions.