
Abstract
Background:
Longitudinal, but not cross-sectional, cognitive testing is one option proposed to define transitional cognitive decline for individuals on the Alzheimer’s disease continuum.
Objective:
Compare diagnostic accuracy of cross-sectional subtle objective cognitive impairment (sOBJ) and longitudinal objective decline (ΔOBJ) over 30 months for identifying 1) cognitively unimpaired participants with preclinical Alzheimer’s disease defined by elevated brain amyloid and tau (A+T+) and 2) incident mild cognitive impairment (MCI) based on Cogstate One Card Learning (OCL) accuracy performance.
Methods:
Mayo Clinic Study of Aging cognitively unimpaired participants aged 50 + with amyloid and tau PET scans (n = 311) comprised the biomarker-defined sample. A case-control sample of participants aged 65 + remaining cognitively unimpaired for at least 30 months included 64 who subsequently developed MCI (incident MCI cases) and 184 controls, risk-set matched by age, sex, education, and visit number. sOBJ was assessed by OCL z-scores. ΔOBJ was assessed using within subjects’ standard deviation and annualized change from linear regression or linear mixed effects (LME) models. Concordance measures Area Under the ROC Curve (AUC) or C-statistic and odds ratios (OR) from conditional logistic regression models were derived. sOBJ and ΔOBJ were modeled jointly to compare methods.
Results:
sOBJ and ΔOBJ-LME methods differentiated A+T+ from A-T- (AUC = 0.64, 0.69) and controls from incident MCI (C-statistic = 0.59, 0.69) better than chance; other ΔOBJ methods did not. ΔOBJ-LME improved prediction of future MCI over baseline sOBJ (p = 0.003) but not over 30-month sOBJ (p = 0.09).
Conclusion:
Longitudinal decline did not offer substantial benefit over cross-sectional assessment in detecting preclinical Alzheimer’s disease or incident MCI.
Keywords
INTRODUCTION
Research criteria proposed by the National Institute on Aging and Alzheimer’s Association (NIA-AA) workgroup biologically defines Alzheimer’s disease as the presence of amyloidosis and atypical tau deposition [1]. Both amyloid and tau have been found to impact cognitive performance, particularly memory [2–5]. Although PiB-PET and tau-PET methods detect in vivo amyloid and tau deposition and inform risk of future cognitive decline [6–8], these methods are expensive, precluding widespread use. Similarly, person-administered neuropsychological measures are sensitive to change up to 20 years prior to a diagnosis of mild cognitive impairment (MCI) [9] but are time intensive and not suited for population-wide cognitive screening. Consequently, computerized cognitive assessment, capable of broader dissemination, shows promise for early detection of cognitive decline [10].
The Cogstate Brief Battery (CBB) [11, 12] is a brief computerized cognitive assessment that can be administered in clinic settings or remotely. The One Card Learning (OCL) subtest from the CBB has previously shown some promise for identifying individuals with amyloidosis. Performance on the OCL subtest of the CBB using a≤5th or≤10th percentile sample-specific slope was used to identify memory decliners in a community dwelling sample [13, 14]. A higher proportion of those meeting the definition of memory decline had amyloidosis relative to non-decliners [13]. Participant registries following a large cohort of volunteers may be able to use computerized cognitive measures to identify and selectively recruit individuals who are more likely to have amyloidosis to enrich clinical trials, and several participant registries use the CBB [15–17]. Given that the success of enrichment strategies may depend, in part, on the ability of the CBB to accurately identify individuals with amyloidosis, additional validation of the ability of the CBB to differentiate individuals with and without AD imaging biomarkers is needed. Further, although intra-individual decline on longitudinal cognitive testing is one of several ways to meet criteria for “transitional cognitive decline” based on the numeric clinical staging scheme for individuals on the Alzheimer’s continuum (e.g., with amyloidosis) per the NIA-AA workgroup [1], subtle cognitive decline as determined from a single assessment is omitted from consideration.
This study compares different approaches to assessing objective subtle cognitive decline in cognitively unimpaired individuals based on OCL accuracy performance (Fig. 1). We define subtle objective cognitive impairment (sOBJ) as performance on cognitive measures below normative expectations on a single assessment (cross-sectional) [18]. We define subtle objective longitudinal cognitive decline (ΔOBJ) as a change over time using two or more assessments. Although these specific sOBJ and ΔOBJ terms are recently proposed by our group in an effort to differentiate objective subtle cognitive decline from the widely used subjective cognitive decline terminology [18, 19], these concepts and the importance of differentiating impairment from decline are not new. For example, Baker and colleagues [20] previously provided support for the presence of both cognitive impairment and cognitive decline in preclinical AD in their meta-analysis. We recently demonstrated that sOBJ defined as performance ≤–1 standard deviation (SD) below age-specific Cogstate norms on the CBB Learning/Working Memory Composite did not differentiate individuals with elevated brain amyloid (A+) either alone or in combination with elevated tau (T+) better than chance [18]. It did predict incident MCI better than chance with an AUC value of 0.70 [18]. However, longitudinal performance was not considered in that study.

Study definitions: Methods of defining subtle cognitive decline.
The primary aim of this study was to compare the diagnostic accuracy of cross-sectional (sOBJ) and longitudinal (ΔOBJ) performance on Cogstate OCL accuracy for identifying 1) cognitively unimpaired individuals with preclinical AD determined by amyloid and tau PET, and 2) cognitively unimpaired individuals who later developed incident MCI. We predicted that ΔOBJ methods (serial assessment) would have greater diagnostic and prognostic accuracy than sOBJ methods (single assessment). We also compared several methods of defining ΔOBJ.
METHODS
Participants were from the Mayo Clinic Study of Aging (MCSA), a prospective population-based study that uses age and sex-stratified random sampling methods and is conducted among residents of Olmsted County, MN [21]. MCSA participants are invited to undergo imaging studies, including PiB-PET (since 2008) and tau-PET (since 2016). MCSA study visits occurred approximately every 15 months. Briefly, clinic visits included an interview and completion of the Clinical Dementia Rating® scale [22] by a study coordinator, neurological evaluation and administration of the Short Test of Mental Status [23] by a physician, and neuropsychological testing [21]. Consensus diagnoses of cognitively unimpaired, MCI, or dementia were made blind to CBB performance, biomarker status, and prior clinical information including past performance on neuropsychological testing and prior diagnoses [21, 24]. Administration of the CBB began in 2012 for individuals 50–69 years old and in 2013 for individuals 70 + . CBB was completed in clinic during MCSA study visits and at a midpoint between full study visits. Between clinic visits, home administration of the CBB was offered to all participants at 4-month intervals beginning in 2015, following initial piloting. Some participants chose to come to the clinic at the midpoint between MCSA study visits to complete Cogstate instead of completing it at home. See Table 1 for the approximate timing of CBB sessions across individuals selecting the 1) in-clinic only or 2) in-clinic and at home tracks.
Target Cogstate Brief Battery (CBB) session schedule depicted by in clinic and clinic/home tracks
All participants completed the CBB during full MCSA clinic visits that are scheduled every 15 months. Participants chose whether to complete intervening CBB sessions in the clinic (less frequent) or at home (more frequent). CBB, Cogstate Brief Battery; MCSA, Mayo Clinic Study of Aging.
The study protocols were approved by the Mayo Clinic and Olmsted Medical Center Institutional Review Boards. All participants provided written informed consent.
Inclusion criteria
Participants may have been enrolled in the MCSA prior to initiation of CBB testing and so baseline CBB is not always the first MCSA study visit. For the purposes of this manuscript, baseline will represent the participants’ visit that included the initial CBB session.
Participants with biomarker data
Cognitively unimpaired individuals aged 50 years or older at the time of their baseline CBB were eligible. Participants were required to have two MCSA follow-up visits to be used for computations of change in CBB measures as described in Study Definitions. All participants had 30 months of follow-up CBB data on average so in remaining sections, the CBB sessions occurring from the MCSA visit where the CBB was first administered to approximately the second MCSA follow-up visit after that initial CBB session will be referred to as the 30-month follow-up period. Individuals were also required to have amyloid and tau PET scans within +/–3 years of their baseline; the most recent imaging was used if repeat imaging was available. Amyloid and tau positivity was determined using Pittsburgh Compound B PET (PiB-PET) and tau PET (AV1451) [25–27]. Cutoffs to determine amyloid and tau positivity were SUVR≥1.48 (centiloid 22) [28] and≥1.25 [26] respectively. Participants, all cognitively unimpaired, were grouped based on amyloid and tau status to include those meeting criteria for biological AD [1] (A+T+ n = 32), Alzheimer’s pathologic change (A+T- n = 68), and those with normal AD biomarkers (A-T- n = 211).
Participants for incident MCI analyses
Cognitively unimpaired individuals aged 65 years or older at the time of their baseline CBB were eligible. In order to compute a rate of change in OCL accuracy scores that could fairly be compared against a single CBB session, participants were required to remain cognitively unimpaired through a run-in period of 2 follow-up visits (approximately 30-months from baseline to 2nd follow-up) and have usable accuracy data at baseline and 2nd follow-up (i.e., no missing data or data failing completion criteria; see Fig. 2a). Incident MCI cases were participants receiving a diagnosis of MCI after the run-in period. 184 stable controls were 3:1 matched to 64 incident MCI cases on age, sex, education, and year of initial CBB to account for potential temporal effects. To ensure equitable opportunity for development of MCI, cases were also risk-set matched to controls having at least as much time in the study subsequent to the run-in period (see Fig. 2b); a match was valid if that length of time for a control was greater than or equal to the case. Incident MCI cases without at least one control participant match identified (n = 3) were excluded. There were five cases for whom three matches were not identified within our broader sample; 1 or 2 matches were used for those cases.
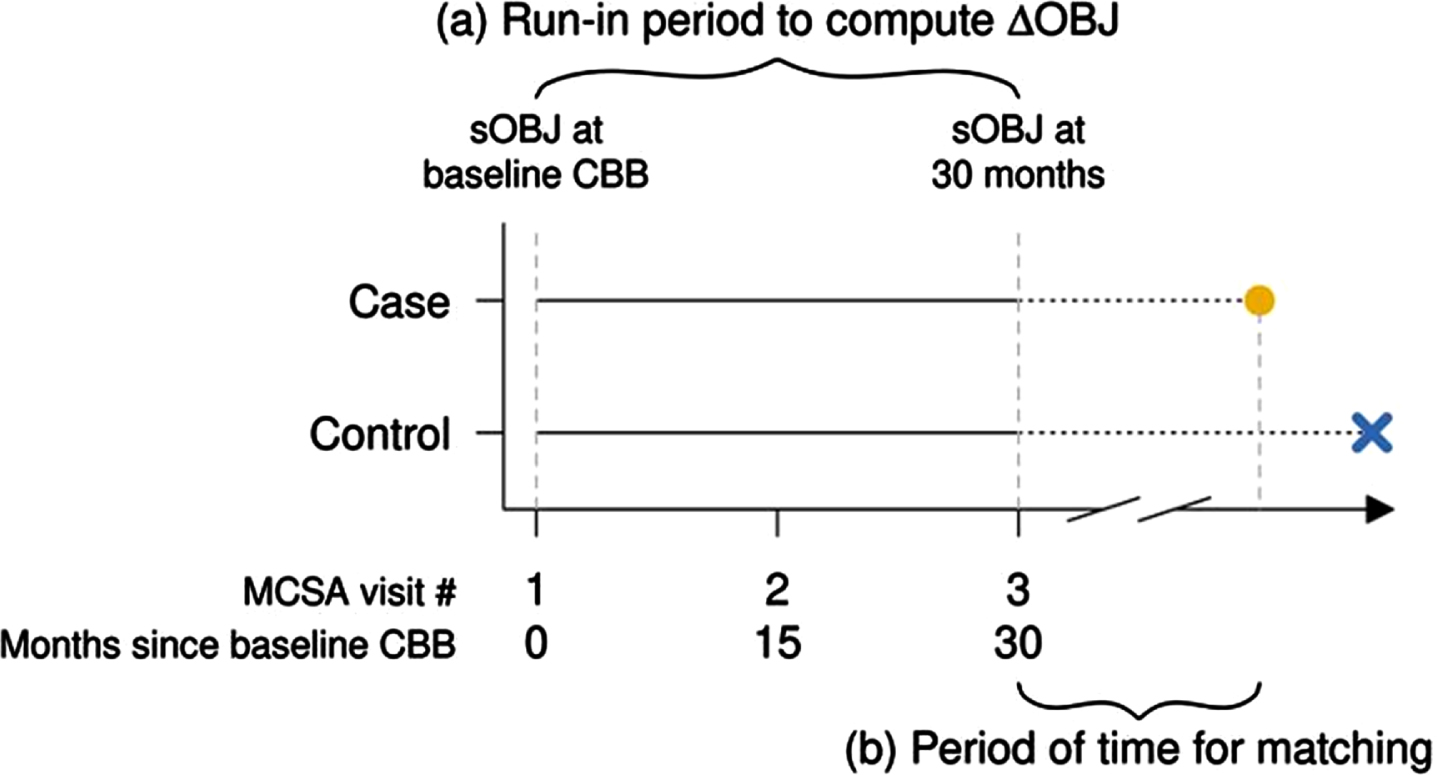
Sample timeline and matching for cognitively unimpaired, incident MCI cases and stable controls. Visualize the timing of events in a risk-set matched design with a run-in period. Eligible subjects had a run-in period of 30 months of CBB assessments (a) which was used to derive the metrics of interest sOBJ and ΔOBJ. Incident MCI cases were those who went on to receive a diagnosis of MCI (yellow dot) after the run in period and were matched to controls (blue X) by age, sex, education, and year of initial CBB to account for potential temporal effects. To ensure equitable opportunity for development of MCI, cases were also matched to controls having at least as much time in study subsequent to the run-in period, i.e., risk-set matching (b). We used a 3-to-1 control-to-case matching ratio. To compare the relationship between each metric of interest and incidence of MCI while accounting for a matched-design, conditional logistic regression (CLR) models were fit and stratified by matched-sets.
Cogstate brief battery and one card learning accuracy
The CBB includes four tasks. To maintain parsimony, OCL was the focus of this manuscript. OCL is a continuous visual recognition memory task that was the focus of prior studies using the CBB to identify individuals with memory decline [13, 14]. OCL requires the examinee to recognize whether a playing card has been presented earlier in the subtest by providing a yes/no response. Both correct recognition and rejection are considered for accuracy [12]. OCL accuracy (arcsine transformed) was the primary outcome variable. Sessions with failed completion flags were excluded; see our prior work for additional details about CBB administration in the MCSA [29, 30]. Additional analyses were also completed for the remaining CBB subtests and composite scores; those results are available in Supplementary Material. Most participants (99%) completed their baseline CBB assessment during a clinic visit on a PC or iPad. Across all CBB sessions, 21%were completed at home.
Study definitions (see Fig. 1)
Subtle objective cognitive impairment (sOBJ)
Normative data in the form of means and SDs by age groups were provided by Cogstate and used to derive age-corrected z-scores [31]. sOBJ at baseline was based on the z-score at the CBB initial session. Since cases were required to remain cognitively unimpaired throughout the 30-month run-in period for the incident MCI analyses, sOBJ at 30 months represents the z-score at the CBB session associated with the 2nd MCSA follow-up visit (approximately 30-months after baseline CBB session) for the case-control cohort.
Subtle objective cognitive decline (ΔOBJ)
ΔOBJ was defined using an intra-individual, longitudinal approach across baseline and follow-up assessments with three different methods, as described below. Data from the baseline CBB through two follow-up MCSA study visits were included in the window used to examine change in OCL accuracy performance (approximately 30 months).
Within-subjects standard deviation (ΔOBJ-WSD): WSD is the method recommended by Cogstate to determine intra-individual change from baseline to a follow-up session, defined in this study as the last CBB session in the 30-month period. A conventional cut-off of z≤–1 is recommended to identify individuals with a decline in test performance. WSD values obtained from Cogstate normative data were derived across an approximately 1-month interval for ages 18–99 [31]. This process is analogous to a reliable change index and can be used to provide a z-score for change in scores across time [32, 33]. Some have criticized this method of calculating reliable change [34, 35], thus we used two additional methods to obtain change in accuracy per year (annualized change) using all available Cogstate session data over the 30-months’ timespan. Models were fit on OCL accuracy with years since baseline.
ΔOBJ-LR method: Using a 2-stage approach, first separate linear regression (LR) models were fit for each participant. Next, the per-person slopes were extracted from each model. With a single predictor variable of time in years, the slope is equivalent to the change in accuracy given 1 unit of time. More explicitly, if yi is predicted OCL accuracy and xi is time in years then slope = (y2 –y1)/(x2 –x1) where x2 –x1 is 1 year. This allows us to interpret the slope as annualized change in OCL accuracy.
ΔOBJ-LME method: Linear mixed effects (LME) models were fit between accuracy and time since baseline including subject-specific intercepts and slopes. This approach considers data from both the group and the individual. Group data is used to stabilize those with fewer observations allowing for individual slopes to align with the overall group slope more closely. This allows for the estimation of subject specific slopes that have been shrunk toward the group slope, reducing noise. Subject-specific slopes were extracted from the model and, like above, can be interpreted as measures of annualized change in the response.
Reference group: A reference group was required to identify annualized change cut points to be applied to our groups of interest. This reference group comprised 732 cognitively unimpaired individuals aged 50–65 at baseline CBB with at least two follow-up visits, who remained cognitively unimpaired over this period (mean age = 59; mean education = 15 years; 50%male). We used a younger cohort since the prevalence of biomarker positivity increases greatly with age [7], and because defining this reference group by biomarker status alone would result in circularity for primary analyses. Change in test performance was computed as described above for ΔOBJ-LR and ΔOBJ-LME methods. The annualized change equivalent to the slope at the 10th percentile within this reference group was used as the a priori conventional cut-off for ΔOBJ-LR and ΔOBJ-LME (e.g., change < 10th%ile), similar to methods previously reported [13, 14].
Statistical methods
We compared OCL performance and demographic characteristics between 1) biomarker positive and negative groups and 2) stable controls and incident MCI cases using linear model ANOVA tests of mean differences and chi-squared tests for frequency differences. An alpha level of 0.05 was used to discern statistical significance for all analyses. We report effect size using Hedge’s g which expresses the difference of group means scaled by the pooled standard deviation.
We conducted Area Under the Receiver Operating Curve (AUROC) analyses on each measure of interest to provide an aggregate measure of performance across all possible classification thresholds for differentiating between biomarker groups. We then compared the AUC values obtained from each method (sOBJ, WSD, LR, LME) [36]. Examining results based on conventional cut-off values of ≤–1 z (sOBJ and ΔOBJ-WSD) and the 10th %ile slope (ΔOBJ-LR and ΔOBJ-LME) was our primary focus, as this allows for generalizability of study findings and facilitates clinical translation of results. In exploratory analyses, we also used the Youden index method to identify study specific “optimal” cut-points [37]. This selected cut-off is the value that maximized the Youden function, i.e., maximized the difference between the true positive and false positive rate out of all possible cut-off values.
As part of the incident MCI analyses, we examined concordance statistics (c-statistic) from conditional logistic regression (CLR) models to predict individuals who developed MCI with stratification by matched-sets. Due to the binary outcome (incident MCI or stable control) the c-statistic can be interpreted in the same way as the area under the Receiver Operating Characteristic curve. To test for differences in c-statistics between methods, jack-knife variance estimates of group differences were computed. Odds ratios (OR) from each CLR model were assessed to compare the magnitude of increasing odds of future MCI per unit of cognition decrement. ANOVA F-statistics were computed to test whether joint CLR models including both sOBJ and ΔOBJ measures provided a better fit to the data over a univariate CLR model with sOBJ, allowing us to assess if one method was better than the other. To facilitate comparison of ORs for the various measures of interest, we needed to have equitable scaling. Division by sample standard deviation was used to rescale the LR and LME annualized change estimation methods making a 1-unit decline equivalent to a 1 SD decrement which is comparable to a 1z decrement.
AUROC methods do not account for the matching in a case-control framework. However, use of consistent methods with previously published manuscripts facilitates comparisons of results. Thus, AUROC analyses for discriminating cases and controls were included in our supplemental materials, despite this being a lower-powered analysis as compared to c-statistics from CLR models.
RESULTS
Cognitively unimpaired participants with biomarker data
Group mean comparisons
See Table 2 for participant demographics. Compared to the A-T- group, the A+T+ group showed significantly lower mean OCL accuracy performance at baseline (sOBJ absolute mean difference = 0.324 z, p = 0.026) and less benefit from practice over time based on ΔOBJ-LME (absolute mean difference of annualized change 0.002; p < 0.001), with medium effect sizes (see Table 2 and Fig. 3). A-T- and A+T+ groups did not differ statistically on OCL accuracy performance when ΔOBJ-WSD and ΔOBJ-LR methods were employed, and resultant effect sizes were small. While a similar pattern of results was observed across A+T- and A-T- comparisons, the magnitude of group differences was smaller. In addition, only ΔOBJ-LME was significantly different between groups, with benefit from practice over time in A+T- individuals compared to A-T- individuals characterized by a small effect size.
Demographic characteristics and performance on One Card Learning accuracy by biomarker group. All participants are cognitively unimpaired. Statistics reported are of the form mean (standard deviation, SD) unless otherwise specified
p-values represent linear model ANOVAs for mean comparisons or Pearson’s Chi-squared test for frequency comparisons. A, amyloid; T, tau; OCL, One Card Learning; sOBJ, subtle objective cognitive impairment (cross-sectional); ΔOBJ, subtle objective cognitive decline (longitudinal); WSD, within subjects standard deviation, positive value indicates higher score across repeated assessments (e.g., benefit from practice); LR, Linear regression model; LME, linear mixed effects model.

Boxplots of One Card Learning accuracy performance across methods of defining subtle cognitive decline and biomarker groups. Box plots representing performances on OCL accuracy separately by biomarker defined groups show the interquartile range (box), median (horizontal solid line within each box) and the extent of outlier performances (vertical lines extending above and below each box) in each of the sOBJ and ΔOBJ methods. Dashed line () denotes the conventional cut-off used (≤–1 z score for sOBJ and ΔOBJ-WSD; < 10th percentile slope for ΔOBJ-LR and ΔOBJ-LME methods). Individuals in all biomarker based groups with performances below this line are identified as decliners based on these cut-offs. A, amyloid; T, tau; sOBJ, subtle objective cognitive impairment at baseline based on OCL accuracy age-corrected z-score derived from Cogstate norms; ΔOBJ, subtle objective cognitive decline since baseline assessment; WSD, within subjects standard deviation z-score based on Cogstate norms; LR, Linear regression model; < 10%ile slope is equivalent to a < –0.0199 annualized change on OCL accuracy raw score (arcsine transformed); LME, linear mixed effects model; < 10%ile slope is equivalent to a < 0.0162 annualized change on OCL accuracy raw score (arcsine transformed). < 10%ile slope cutoffs were derived from the cognitively unimpaired reference sample.
Overall diagnostic accuracy
Differentiating A-T- and A + T+groups
Overall diagnostic accuracy for differentiating between the A-T- and A+T+ groups was better than chance for the single baseline sOBJ and ΔOBJ-LME methods, but not for the ΔOBJ-WSD and ΔOBJ-LR methods (Table 3). When comparing total AUC across methods, sOBJ performed comparably to all three longitudinal methods (ps > 0.05). The total AUC value was marginally higher for the ΔOBJ-LME method (AUC = 0.69) relative to the sOBJ method (AUC = 0.64), but this did not represent a statistically significant difference.
Comparison of total area under the curve (AUC) with 95%confidence intervals (CI) from ROC analyses to distinguish between cognitively unimpaired biomarker groups based on subtle objective cognitive impairment (sOBJ) at baseline and longitudinal decline (ΔOBJ) defined using three different methods
AUC confidence intervals (CI) excluding 0.50 indicated differentiation of biomarker groups better than chance. Total AUC values were compared across methods [36]. sOBJ, subtle objective cognitive impairment (cross-sectional); ΔOBJ, subtle objective cognitive decline (longitudinal); WSD, within subjects’ standard deviation; LR, annualized change from linear regression model; LME, annualized change from linear mixed effects model.
Differentiating A-T- and A+T- groups
Overall diagnostic accuracy for differentiating between the A-T- and A+T- groups was not better than chance (95%CIs of total AUC values contained 0.5) for baseline or longitudinal change methods. All methods had comparable AUC values (ps > 0.05; see Table 3).
Examining performance of differing cut-offs
Differentiating A-T- and A + T+groups
Using conventional cut-offs of z≤–1 based on Cogstate norms (sOBJ and ΔOBJ-WSD) and slope < 10th %ile of the reference group (ΔOBJ-LR and ΔOBJ-LME), sensitivity values for identifying A+T+ individuals were low for all methods (9–38%; see Table 4 and Fig. 3). ΔOBJ-LME showed the highest sensitivity relative to other methods. Specificity values were high across methods when using conventional cut-offs (85–98%). When exploring optimal, derived cutoffs, sensitivity values showed improvement, increasing to 62%sensitivity for ΔOBJ-LME, although this leads to a decrease in specificity (75%).
Sensitivity and specificity for One Card Learning accuracy performance based on derived, optimal cut-offs and conventional cut-offs for subtle objective cognitive impairment (sOBJ) at baseline and longitudinal decline (ΔOBJ) defined using three different methods
Conventional cut-offs for sOBJ and ΔOBJ-WSD are≤–1 SD, which corresponds to≤–1 z using age-corrected Cogstate norms and norms for change respectively. Annualized change percentiles used in ΔOBJ-LR and ΔOBJ-LME correspond to our cognitively unimpaired reference group (n = 732 aged 50–65 at baseline); the corresponding cut-off for annualized change for OCL accuracy raw score (arcsine transformed) is provided in parentheses. Optimal cutoffs were derived using the Youden index [37], which maximizes the difference between the true positive and false positive rate across all possible cut-point values. A, amyloid; T, tau; OCL, One Card Learning; sOBJ, subtle objective cognitive impairment at baseline; ΔOBJ, objective longitudinal cognitive decline; WSD, within subjects standard deviation; LR, linear regression model; LME, linear mixed effects model; A-T- group N = 211; A+T+ group N = 32; A+T- group N = 68.
Differentiating A-T- and A + T–groups
Using conventional cut-offs of z ≤–1 and annualized change < 10th %ile of the reference group, sensitivity values for identifying A+T- individuals were low for all methods (6–31%; Table 4), with high specificity. Optimal cut-offs are not discussed given that AUC values suggested OCL accuracy performance was unable to differentiate A-T- and A+T- groups better than chance.
Additional supplemental results
Supplemental analyses for other available CBB subtests and composite scores from the CBB confirm that the OCL accuracy subtest best differentiated A+T+ and A+T- from A-T- groups relative to other available CBB measures, including composite scores (see Supplementary Table 1). Of note, ONB accuracy and the Learning/Working Memory Composite results showed greater improvement over time in both biomarker positive groups (A+T+ and A+T-) relative to the A-T- group for the ΔOBJ-LME method, which was unexpected.
A frequency cross-tabulation (2×2 Table) of OCL accuracy results by sOBJ and ΔOBJ methods is provided to allow future derivation of additional estimates of test accuracy, as recommended by the reporting standards for studies of diagnostic test accuracy in dementia [38] (see Supplementary Tables 2 and 3).
Cognitively unimpaired participants who progressed to MCI (incident MCI cases) and matched controls
Group mean comparisons
See Table 5 for participant demographics. Group differences were statistically significant for sOBJ at baseline, sOBJ at 30 months, and ΔOBJ-LME methods (ps < 0.05). The incident MCI group showed significantly lower OCL accuracy performance at baseline and 30-month follow-up, as well as less benefit from practice over time based on annualized change (LME method), compared to the stable group. Differences were characterized by medium effect sizes for sOBJ, sOBJ 30-month, and ΔOBJ-LME methods, and minimal effect sizes for ΔOBJ-WSD and ΔOBJ-LR methods.
Demographic characteristics and performance on One Card Learning accuracy by those who progressed to MCI after the 30-month run-in period (incident MCI) and those who remained cognitively unimpaired (stable controls). Statistics reported are of the form mean (standard deviation, SD) unless otherwise specified
p-values represent linear model ANOVAs for mean comparisons or Pearson’s Chi-squared test for frequency comparisons. OCL, One Card Learning; sOBJ, subtle objective cognitive impairment (cross-sectional); ΔOBJ, subtle objective cognitive decline (longitudinal); WSD, within subjects standard deviation, positive value indicates higher score across repeated assessments (e.g., benefit from practice); LR, annualized change from linear regression model; LME, annualized change from linear mixed effects model. 1Follow-up time starts just after the run-in period until MCI diagnosis (cases) or last visit (controls). 2Time to conversion represents time from Cogstate baseline to MCI diagnosis.
Overall diagnostic accuracy
Overall diagnostic accuracy for differentiating between the incident MCI and stable groups was better than chance for the sOBJ at baseline, sOBJ at 30 months and ΔOBJ-LME methods, but not for ΔOBJ-WSD and ΔOBJ-LR methods (Table 6). Although no change methods were significantly better than sOBJ at baseline at differentiating groups (ps > 0.05), sOBJ at 30 months and ΔOBJ-LME methods had the highest concordance values (both 0.69). sOBJ at 30 months and ΔOBJ-LME better differentiated between groups as compared to ΔOBJ-WSD and ΔOBJ-LR methods (ps < 0.05). AUROC values showed the same pattern of results (see Supplementary Table 4).
Concordance statistic (C-statistic) from conditional logistic regression models and comparison of predictive accuracy between cases and controls by method of defining subtle cognitive decline. p-values computed using jack-knifed variance estimates
sOBJ, subtle objective cognitive impairment (cross-sectional); ΔOBJ, subtle objective cognitive decline (longitudinal); WSD, within subjects’ standard deviation; LR, annualized change from linear regression model; LME, annualized change from linear mixed effects model.
Conditional logistic regression models
There was a similar pattern of findings when examining odds ratios from independent conditional logistic regression models (see Table 7): sOBJ at 30 months had the largest effect; for every decrement in performance equivalent to 1 z score, the odds of progression to MCI was 2.09 times higher (p < 0.001). Odds ratios were also statistically significant for sOBJ at baseline and ΔOBJ-LME (OR of 1.70 and 2.02 respectively), but not ΔOBJ-WSD and ΔOBJ-LR. We performed joint conditional logistic regression models for select comparisons (see Table 8). Results show there is significant improvement to the model over sOBJ at baseline when either sOBJ at 30 months or ΔOBJ-LME is added to the model. ΔOBJ-LME and sOBJ at 30 months were highly correlated (r = 0.82), yielding concerns that multicollinearity may confound joint conditional logistic regression models. We thus performed ANOVAs for these analyses. A model with both sOBJ at 30 months and ΔOBJ-LME did not provide a significantly better fit to the data as compared to sOBJ at 30 months alone (p = 0.09), nor ΔOBJ-LME alone (p = 0.25).
Odds ratio with 95%confidence intervals (CI) from conditional logistic regression models for specified unit of decrement in cross-sectional or longitudinal One Card Learning performance with corresponding increases in likelihood of progression to MCI
Odds ratios represent the likelihood of progressing from cognitively unimpaired to MCI given a 1 SD lower performance for each individual method. sOBJ, subtle objective cognitive impairment at a single assessment; ΔOBJ, subtle objective cognitive decline (longitudinal); WSD, within subjects’ standard deviation; LR, annualized change from linear regression model; LME, annualized change from linear mixed effects model. 1Reverse scaling applied so that the odds ratios are greater than one. 2ΔOBJ-LR and ΔOBJ-LME were scaled by dividing by their standard deviations.
Joint conditional logistic regression models with odds ratios for planned model comparisons
Odds ratios represent the likelihood of progressing from cognitively unimpaired to MCI given a 1 SD lower performance for each individual method. sOBJ, subtle objective cognitive impairment (cross-sectional); ΔOBJ, subtle objective cognitive decline (longitudinal); WSD, within subjects’ standard deviation; LR, annualized change from linear regression model; LME, annualized change from linear mixed effects model. 1Reverse scaling applied so that the odds ratios are greater than one. 2ΔOBJ-LME was scaled by dividing by its standard deviation.
Comparing performance of different cut-offs
Using conventional cut-offs of z≤–1 based on Cogstate norms (sOBJ at baseline, sOBJ at 30 months, and ΔOBJ-WSD) and annualized change < 10th %ile of the reference group (ΔOBJ-LR and ΔOBJ-LME), sensitivity values were low across methods (11–23%; Table 9) with the exception of the ΔOBJ-LME method (77%sensitivity). However, specificity for the ΔOBJ-LME method was poor (46%) suggesting that the 10th %ile cut-off for ΔOBJ-LME slope was overly liberal. Optimal derived cutoffs tended to provide a better balance of sensitivity and specificity, although specificity remained poor for several methods.
Comparison of diagnostic accuracy of Cogstate One Card Learning accuracy (arcsine transformed) to differentiate stable controls from incident MCI individuals for different subtle objective cognitive impairment (sOBJ) and longitudinal decline (ΔOBJ) methods
Optimal cutoffs were derived using the Youden index [37], which maximizes the difference between the true positive and false positive rate across all possible cut-point values. sOBJ, subtle objective cognitive impairment (cross-sectional); ΔOBJ, subtle objective cognitive decline (longitudinal); WSD, within subjects standard deviation z-score based on Cogstate norms; LR, linear regression model; < 10%ile slope is equivalent to a < –0.0199 annual change on OCL accuracy raw score (arcsine transformed); LME, linear mixed effects model; < 10%ile slope is equivalent to a < 0.0162 annual change on OCL accuracy raw score (arcsine transformed). < 10%ile slope cutoffs were derived from the cognitively unimpaired reference sample (N = 732). Controls, cognitively unimpaired and stable (N = 184). Cases, incident MCI (N = 64).
DISCUSSION
This study compared different approaches to detecting subtle cognitive decline based on Cogstate OCL performance. We compared diagnostic accuracy of cross-sectional (sOBJ) and longitudinal (ΔOBJ) performance on OCL accuracy for 1) differentiating cognitively unimpaired biomarker negative individuals from cognitively unimpaired individuals with preclinical Alzheimer’s disease (A+T+) and Alzheimer’s pathologic change (A+T-) and 2) differentiating incident MCI cases from matched stable controls. Inconsistent with our study hypothesis, longitudinal cognitive decline over 30 months based on OCL accuracy was not substantially better at detecting transitional cognitive decline relative to a single cross-sectional assessment, with results varying significantly across different ΔOBJ methods.
Biomarker positive, cognitively unimpaired groups had lower baseline OCL accuracy performance (sOBJ) and less improvement over time relative to the biomarker negative group. sOBJ and ΔOBJ-LME differentiated between A-T- and A+T+ (but not A+T-) individuals better than chance. ΔOBJ-LME offered a non-significant incremental benefit over sOBJ for differentiating A-T- and A+T+ groups, increasing the AUC values from 0.64 to 0.69. Even with this slight increase, the maximum AUC value seen with the ΔOBJ-LME method was just below what is typically considered acceptable (AUC≥0.70) [39, 40]. ΔOBJ-LME offered better sensitivity relative to sOBJ, particularly when using optimal cutoffs. However, the marginal benefits offered by ΔOBJ-LME required data over the course of 30 months, which must be weighed against the practicality and brevity of a single assessment.
There was a similar pattern of findings when differentiating between incident MCI cases and stable cognitively unimpaired controls. Notably, inclusion of an additional cross-sectional (sOBJ) comparison at the 30-month follow-up suggests that intra-individual change per se is not the most important aspect of the added benefit of repeated assessment for OCL accuracy. sOBJ at baseline, sOBJ at 30 months, and ΔOBJ-LME all differentiated groups better than chance, with comparable concordance values. Adding either sOBJ at 30 months or ΔOBJ-LME to a model with sOBJ at baseline resulted in significant improvement to the model. However, ΔOBJ-LME did not lead to a significant model improvement over sOBJ at 30 months. This suggests that a single assessment proximal to the incidence of MCI was an equally effective predictor as intraindividual change.
The slight advantage in sensitivity with the ΔOBJ-LME method in the biomarker defined groups was again seen to some degree when we applied the same < 10th%ile conventional cut-off to incident MCI and stable cognitively unimpaired groups. However, specificity was poor, with 54%of those who remained cognitively unimpaired after the run-in period also showing a decline in OCL. This raises concerns about the suitability of this cut-off for broad application.
ΔOBJ-WSD and ΔOBJ-LR did not differentiate between biomarker groups or case-control groups better than chance. More importantly, the WSD method, the only method currently provided by Cogstate to assess longitudinal change over time using the CBB, was outperformed by single assessment results achieved with sOBJ at 30 months when distinguishing incident MCI from stable cognitively unimpaired participants. Further, sensitivity values of ΔOBJ-WSD and ΔOBJ-LR methods were very low when using conventional cut-offs (6–23%). Use of ΔOBJ-WSD and ΔOBJ-LR methods for detection of preclinical AD and incident MCI with OCL accuracy is not recommended in circumstances where high sensitivity to preclinical cognitive change is needed.
Practice effects
Consideration of practice effects is necessary when comparing the utility of baseline and longitudinal assessments on OCL accuracy. Mean annualized change on OCL accuracy in each biomarker group was positive, suggesting improvement on successive sessions consistent with our prior results demonstrating that the OCL subtest is prone to practice effects [30, 41]. In addition, diminished practice effects are associated with cognitive decline in the context of incident MCI/dementia [42–45]. We expected that the ΔOBJ-LME model would best capture these potentially variable effects given its utility in accounting for fixed and random effects. However, as noted above, ΔOBJ-LME provided relatively modest benefit in overall diagnostic accuracy. ΔOBJ-WSD only considers the baseline and terminal assessments without including intervening sessions and is based on typical change from baseline to a single follow-up session, so may not fully account for practice effects across numerous sessions. This may contribute to the poor performance of the ΔOBJ-WSD method, and others have also advised against using this method to determine a reliable change due to methodological weaknesses associated with this approach [34, 35]. We focused primarily on ΔOBJ methods provided for use by Cogstate (ΔOBJ-WSD) and those previously shown to have potential utility for detecting amyloidosis (ΔOBJ-LME) [13, 14]. However, these models alone do not directly account for practice effects. Instead, practice effects were accounted for in this manuscript through the study design that prioritized a similar amount of follow-up time (30 months) and sessions across primary groups of interest. Regression-based norms for determining cognitive decline provide a method of modeling practice effects more directly and often perform better than simpler methods of determining reliable change [45, 46]. Regression-based norms for change represent an important future direction.
Reliability
Variations in reliability are of particular relevance to longitudinal studies seeking to detect cognitive decline. Similar to current results, Ivnik et al. [47] compared diagnostic accuracy across four methods of interpreting neuropsychological test data and found that longitudinal data interpretation did not offer significant benefit in predicting cognitive decline. Increased test-retest variability among older cognitively unimpaired individuals limited the utility of longitudinal data interpretation. Low reliability may similarly be driving our findings, as ΔOBJ methods did not substantially outperform the single assessment sOBJ method in differentiating groups of interest. ΔOBJ-LME uses advanced statistical methods to account for intra-individual variability, thus diminishing the effect of low reliability, and yet was not substantially better than sOBJ at baseline and sOBJ at 30 months when predicting incident MCI. Reliability estimates of CBB subtests have varied across different cohorts and statistical methods [34, 48]. Lim and colleagues (2013) reported an average intraclass correlation coefficient of 0.87 across 4 CBB sessions when collapsing across 3 clinical groups, with slightly lower ICC values within subgroups (0.77 in healthy adults, 0.82 for those with amnestic MCI, 0.68 for those AD dementia). We previously reported that reliability coefficients for several CBB tests fall below levels required for clinical decision making, and this was particularly relevant for OCL accuracy, with reliability coefficients ranging from 0.26–0.59 across two successive sessions [29]. Our prior work demonstrated that platform of administration may add an additional confound to reliability across serial assessments [29], and reporting average reliability values across several sessions may yield different reliability coefficients than when reported session by session.
Implications and application of these findings
The numeric clinical staging scheme described by the National Institute on Aging-Alzheimer’s Association (NIA-AA) Working Group proposed evidence of subtle decline on longitudinal cognitive testing as one option to define transitional cognitive decline for individuals on the Alzheimer’s disease continuum [1]. This definition does not include potential use of sOBJ, i.e., a single cross-sectional assessment. However, in the present study, the CBB which is marketed for both single and serial assessments, did not offer substantially better diagnostic accuracy when using longitudinal data over 30 months. Although these results are confined to the CBB and may be related to test-specific factors described above, this study highlights the importance of directly comparing cross-sectional and longitudinal approaches to objectively defining subtle cognitive decline. Considering only longitudinal definitions of decline may compound test-retest reliability problems and may miss an important subset of individuals at risk for future cognitive decline. These results support the FDA guidance on early AD trials that includes defining Stage 2 with a single time point measure of cognition (U.S. Department of Health and Human Services, 2018). Future studies should investigate whether this same pattern of results is observed when using traditional neuropsychological measures.
Cognitive decline preceding clinical diagnosis of dementia by several years is well established, particularly with an accelerated rate of decline in later years [49–51]. Caselli et al. [9] showed that there is a discernible inflection point after which those who develop MCI decline at a more rapid rate than those who remain cognitively unimpaired. This inflection point precedes MCI diagnoses by up to 20 years. It is possible that our 30-month window was too short to fully capture transitional cognitive decline. However, this window is representative of many research and clinical contexts. Further, it is possible that the relative proximity of the sOBJ at 30 months assessment to the subsequent progression to MCI contributes to its stronger performance compared to sOBJ at baseline. However, this does not explain the advantage of sOBJ at 30 months over some ΔOBJ methods since all longitudinal methods included information from the 30-month session.
Sensitivity was low across most methods in the biomarker defined and incident MCI groups. Application of conventional cut-offs using Cogstate norms for a single cross-sectional assessment or their recommended method of determining change over time (ΔOBJ-WSD) identified only 6–12%of cognitively unimpaired A+ individuals and 11–16%of incident MCI individuals. Given high specificity, any individuals identified as decliners based on these cut-offs have a high probability for biomarker positivity or future cognitive decline. However, these sensitivity values may be too low for optimal use in registry models, as only a small proportion of potentially eligible at-risk participants are identified. Although use of optimal cut-offs improved sensitivity, they were associated with 1) a notable decrement in specificity and 2) thresholds well within what is usually considered an unimpaired range. Conventional cut-offs are based on normative data that do not account for underlying neuropathology that has been shown to affect the detection of cognitive decline in older adults [52] which may explain the improved sensitivity when using optimal cut-offs relying on a much smaller change in performance. We previously reported lower than expected sensitivity of the CBB to prevalent MCI [53], suggesting that improvements in the CBB normative data may be needed to enhance its clinical utility. Ideally, higher sensitivity could be achieved while maintaining specificity through use of more sensitive cognitive measures. Recent results by Lim and colleagues demonstrate that with a sensitive measure of learning, differential practice effects across cognitively unimpaired amyloid positive and negative individuals can be elicited over a week with repeated daily assessments [54]. More work towards developing novel, sensitive, and efficient cognitive measures optimized for remote assessment is needed and represents an important future direction.
Limitations
This study has several limitations. We focused on OCL accuracy to maintain parsimony in this manuscript. Importantly, our definitions of sOBJ and ΔOBJ as used in this study were therefore limited to a single measure to maintain focus on our primary aim of comparing cross-sectional and longitudinal approaches and are not intended to represent proposed optimal methods of defining subtle cognitive decline. This is an important limitation, as single test approaches are less stable and robust than multi-test definitions of cognitive decline [55]. Prior work has highlighted the importance and utility of defining objective subtle cognitive decline cross-sectionally using a battery of neuropsychological tests [56–58]. Our group recently demonstrated that a measure of ΔOBJ based on composite z-scores of in-person neuropsychological measures of either memory or attention/executive domains captured more individuals meeting NIA-AA Stage 2 criteria than subjective cognitive decline or neurobehavioral change [19]. In that study, Petersen and colleagues applied cutoff points of ≤–0.1 z units/year and ≤–0.2 z units/year on these memory and attention/executive composites derived from linear regression models over 30 months. We want to emphasize that the definitions of ΔOBJ used in the current manuscript differ from that approach in the cut-offs applied and were optimized based on prior Cogstate manuscripts and our goal of directly comparing cross-sectional and longitudinal approaches. This brings up the question of whether use of composite scores may provide an alternative to the single test approach used in this study [59, 60]. However, our supplemental analyses show that the OCL accuracy subtest best differentiated A+T+ and A+T- from A-T- groups relative to CBB composite scores (see Supplementary Material). This suggests that use of available CBB composite scores would be unlikely to alter the primary findings of this study. In addition, the Learning/Working Memory Composite showed unexpectedly greater improvement for A+T+ and A+T- groups compared to the biomarker negative group over 30-months when using the ΔOBJ-LME method. This pattern was driven by One Back accuracy. For OCL accuracy, there was a correlation of –0.80 between the subject-specific slope and subject-specific intercept (i.e., baseline performance) terms with limited variability of individual trajectories over the course of several sessions. This implies that an individual’s performance at baseline significantly impacted subsequent slope-based interpretation in ΔOBJ-LME analyses.
Approximately 21%of all CBB sessions were completed at home. While there is some support for equivalent CBB performance across supervised and unsupervised settings [61], we previously showed subtly lower performances on OCL accuracy performance at home relative to in clinic, equivalent to approximately 5%of the raw accuracy value (out of 100%) [30]. It is possible that environmental distractions may impact performance during unsupervised sessions, reducing reliability and validity [62]. Finally, we did not consider neurodegeneration within our biomarker-defined samples because it is a relatively non-specific biomarker. However, it is possible that individuals in the reference and control groups have neurodegeneration that was unaccounted for [1].
CONCLUSIONS
In conclusion, our study addresses the critical and challenging need to directly compare cross-sectional and longitudinal methods for defining subtle cognitive decline. When investigating this question using the Cogstate OCL accuracy measure, none of the longitudinal ΔOBJ methods were substantially better than single cross-sectional assessment (sOBJ) methods at identifying cognitively unimpaired individuals at high risk of showing cognitive decline over time (biomarker positive or incident MCI). Our data suggest that the visual memory demands of OCL, tested with a yes/no recognition paradigm, do not provide the level of sensitivity needed for detecting subtle cognitive decline in preclinical AD. Results have important implications for patient registries using the CBB to help identify risk of AD biomarker positivity. OCL sensitivity based on conventional cut-offs is too low to be useful for this purpose. Either alternative, more lenient cut-offs or updated normative data are recommended. Future studies are needed to determine whether alternative measures with higher reliability and increased sensitivity to early memory changes associated with preclinical AD may show the expected benefits of longitudinal assessment.
Footnotes
ACKNOWLEDGMENTS
The authors wish to thank the participants and staff at the Mayo Clinic Study of Aging, and Erin Twohy, M.S., who contributed to statistical analyses related to but not included in this manuscript. This work was supported by the Rochester Epidemiology Project (R01 AG034676), the National Institutes of Health (grant numbers P50 AG016574, P30 AG062677, U01 AG006786, R37 AG011378, R01 AG041851, RF1 AG55151), a grant from the Alzheimer’s Association (AARG-17-531322), Zenith Award from the Alzheimer’s Association, the Robert Wood Johnson Foundation, The Elsie and Marvin Dekelboum Family Foundation, Alexander Family Alzheimer’s Disease Research Professorship of the Mayo Clinic, Liston Award, Schuler Foundation, GHR Foundation, AVID Radiopharmaceuticals, and the Mayo Foundation for Education and Research. We would like to greatly thank AVID Radiopharmaceuticals, Inc., for their support in supplying AV-1451 precursor, chemistry production advice and oversight, and FDA regulatory cross-filing permission and documentation needed for this work.
Portions of this manuscript were presented as a poster at the 2020 virtual Alzheimer’s Association International Conference. Portions of this manuscript were presented as a poster at the 2020 Virtual Summit of the Brain Tech Project.