
Abstract
Background:
Several studies showed that life course adiposity was associated with Alzheimer’s disease (AD). However, the underlying causality remains unclear.
Objective:
We aimed to examine the causal relationship between life course adiposity and AD using Mendelian randomization (MR) analysis.
Methods:
Instrumental variants were obtained from large genome-wide association studies (GWAS) for life course adiposity, including birth weight (BW), childhood body mass index (BMI), adult BMI, waist circumference (WC), waist-to-hip ratio (WHR), and body fat percentage (BFP). A meta-analysis of GWAS for AD including 71,880 cases and 383,378 controls was used in this study. MR analyses were performed using inverse variance weighted (IVW), weighted median, and MR-Egger regression methods. We calculated odds ratios (ORs) per genetically predicted standard deviation (1-SD) unit increase in each trait for AD.
Results:
Genetically predicted 1-SD increase in adult BMI was significantly associated with higher risk of AD (IVW: OR = 1.03, 95% confidence interval [CI] = 1.01–1.05, p = 2.7×10⁻³) after Bonferroni correction. The weighted median method indicated a significant association between BW and AD (OR = 0.94, 95% CI = 0.90–0.98, p = 1.8×10⁻³). We also found suggestive associations of AD with WC (IVW: OR = 1.03, 95% CI = 1.00–1.07, p = 0.048) and WHR (weighted median: OR = 1.04, 95% CI = 1.00–1.07, p = 0.029). No association was detected of AD with childhood BMI and BFP.
Conclusion:
Our study demonstrated that lower BW and higher adult BMI had causal effects on increased AD risk.
INTRODUCTION
Alzheimer’s disease (AD) is the most common type of dementia and one of the greatest healthcare challenges in the 21st century [1]. The presence of extracellular plaques of insoluble amyloid-β peptide and neurofibrillary tangles of P-tau in neuronal cytoplasm is the hallmark of AD [2]. Although studies have suggested that about 70% of the risk of developing AD can be attributed to genetics, a number of other risk factors such as cerebrovascular diseases, diabetes, hypertension, obesity, and dyslipidemia also increase AD risk [3].
Adiposity has emerged as a global health problem [4]. Levels of total adiposity measured as body mass index (BMI) and central adiposity measured as waist circumference (WC) or waist-to-hip ratio (WHR) have been associated with late-onset AD [5–7]. However, many previous studies which explored the association between BMI and AD produced heterogeneous results. Some longitudinal cohort studies suggested higher late-life BMI was associated with a lower risk of AD [8, 9]. Some studies suggested that higher adiposity at midlife was associated with a higher risk of dementia or AD [7, 10]. Furthermore, some studies suggested that individuals with early abnormal weight, such as lower birth weight (BW) and higher childhood BMI, had a higher risk of age-related cognitive dysfunction [11, 12]. In addition, lean body mass loss was suggested to be associated with the development of AD [13].
Although many observational studies found the association between adiposity and AD, these findings might be influenced by uncontrollable factors such as the study population, sample size, data source (usually self-report), and covariates adjusted in the statistical models, etc. [5–9, 11–13]. In addition, there are other pathways (such as diabetes or chronic inflammation [14]) and reverse causation (AD may affect eating behavior or induce metabolic changes [15]) which can influence the findings of observational studies. No randomized controlled trials have been previously performed mainly due to ethical issues. Therefore, it is unclear whether life course adiposity has a causal effect on the risk of AD.
Mendelian randomization (MR) is an analytical method that uses exposure-related genetic variants as instrumental variables (IVs) to assess the causal relationship between exposure and outcome [16]. Because genetic variants are randomly assorted at conception and not affected by disease, MR is less likely to be affected by confounding factors or reverse causation than conventional observational studies. And according to this, differences in the outcome between those who carry the variants and those who do not can be attributed to the differences in exposure [16, 17]. Therefore, in this study, we investigated the potential causal relationship between life course adiposity and AD using a 2-sample MR approach (Fig. 1).
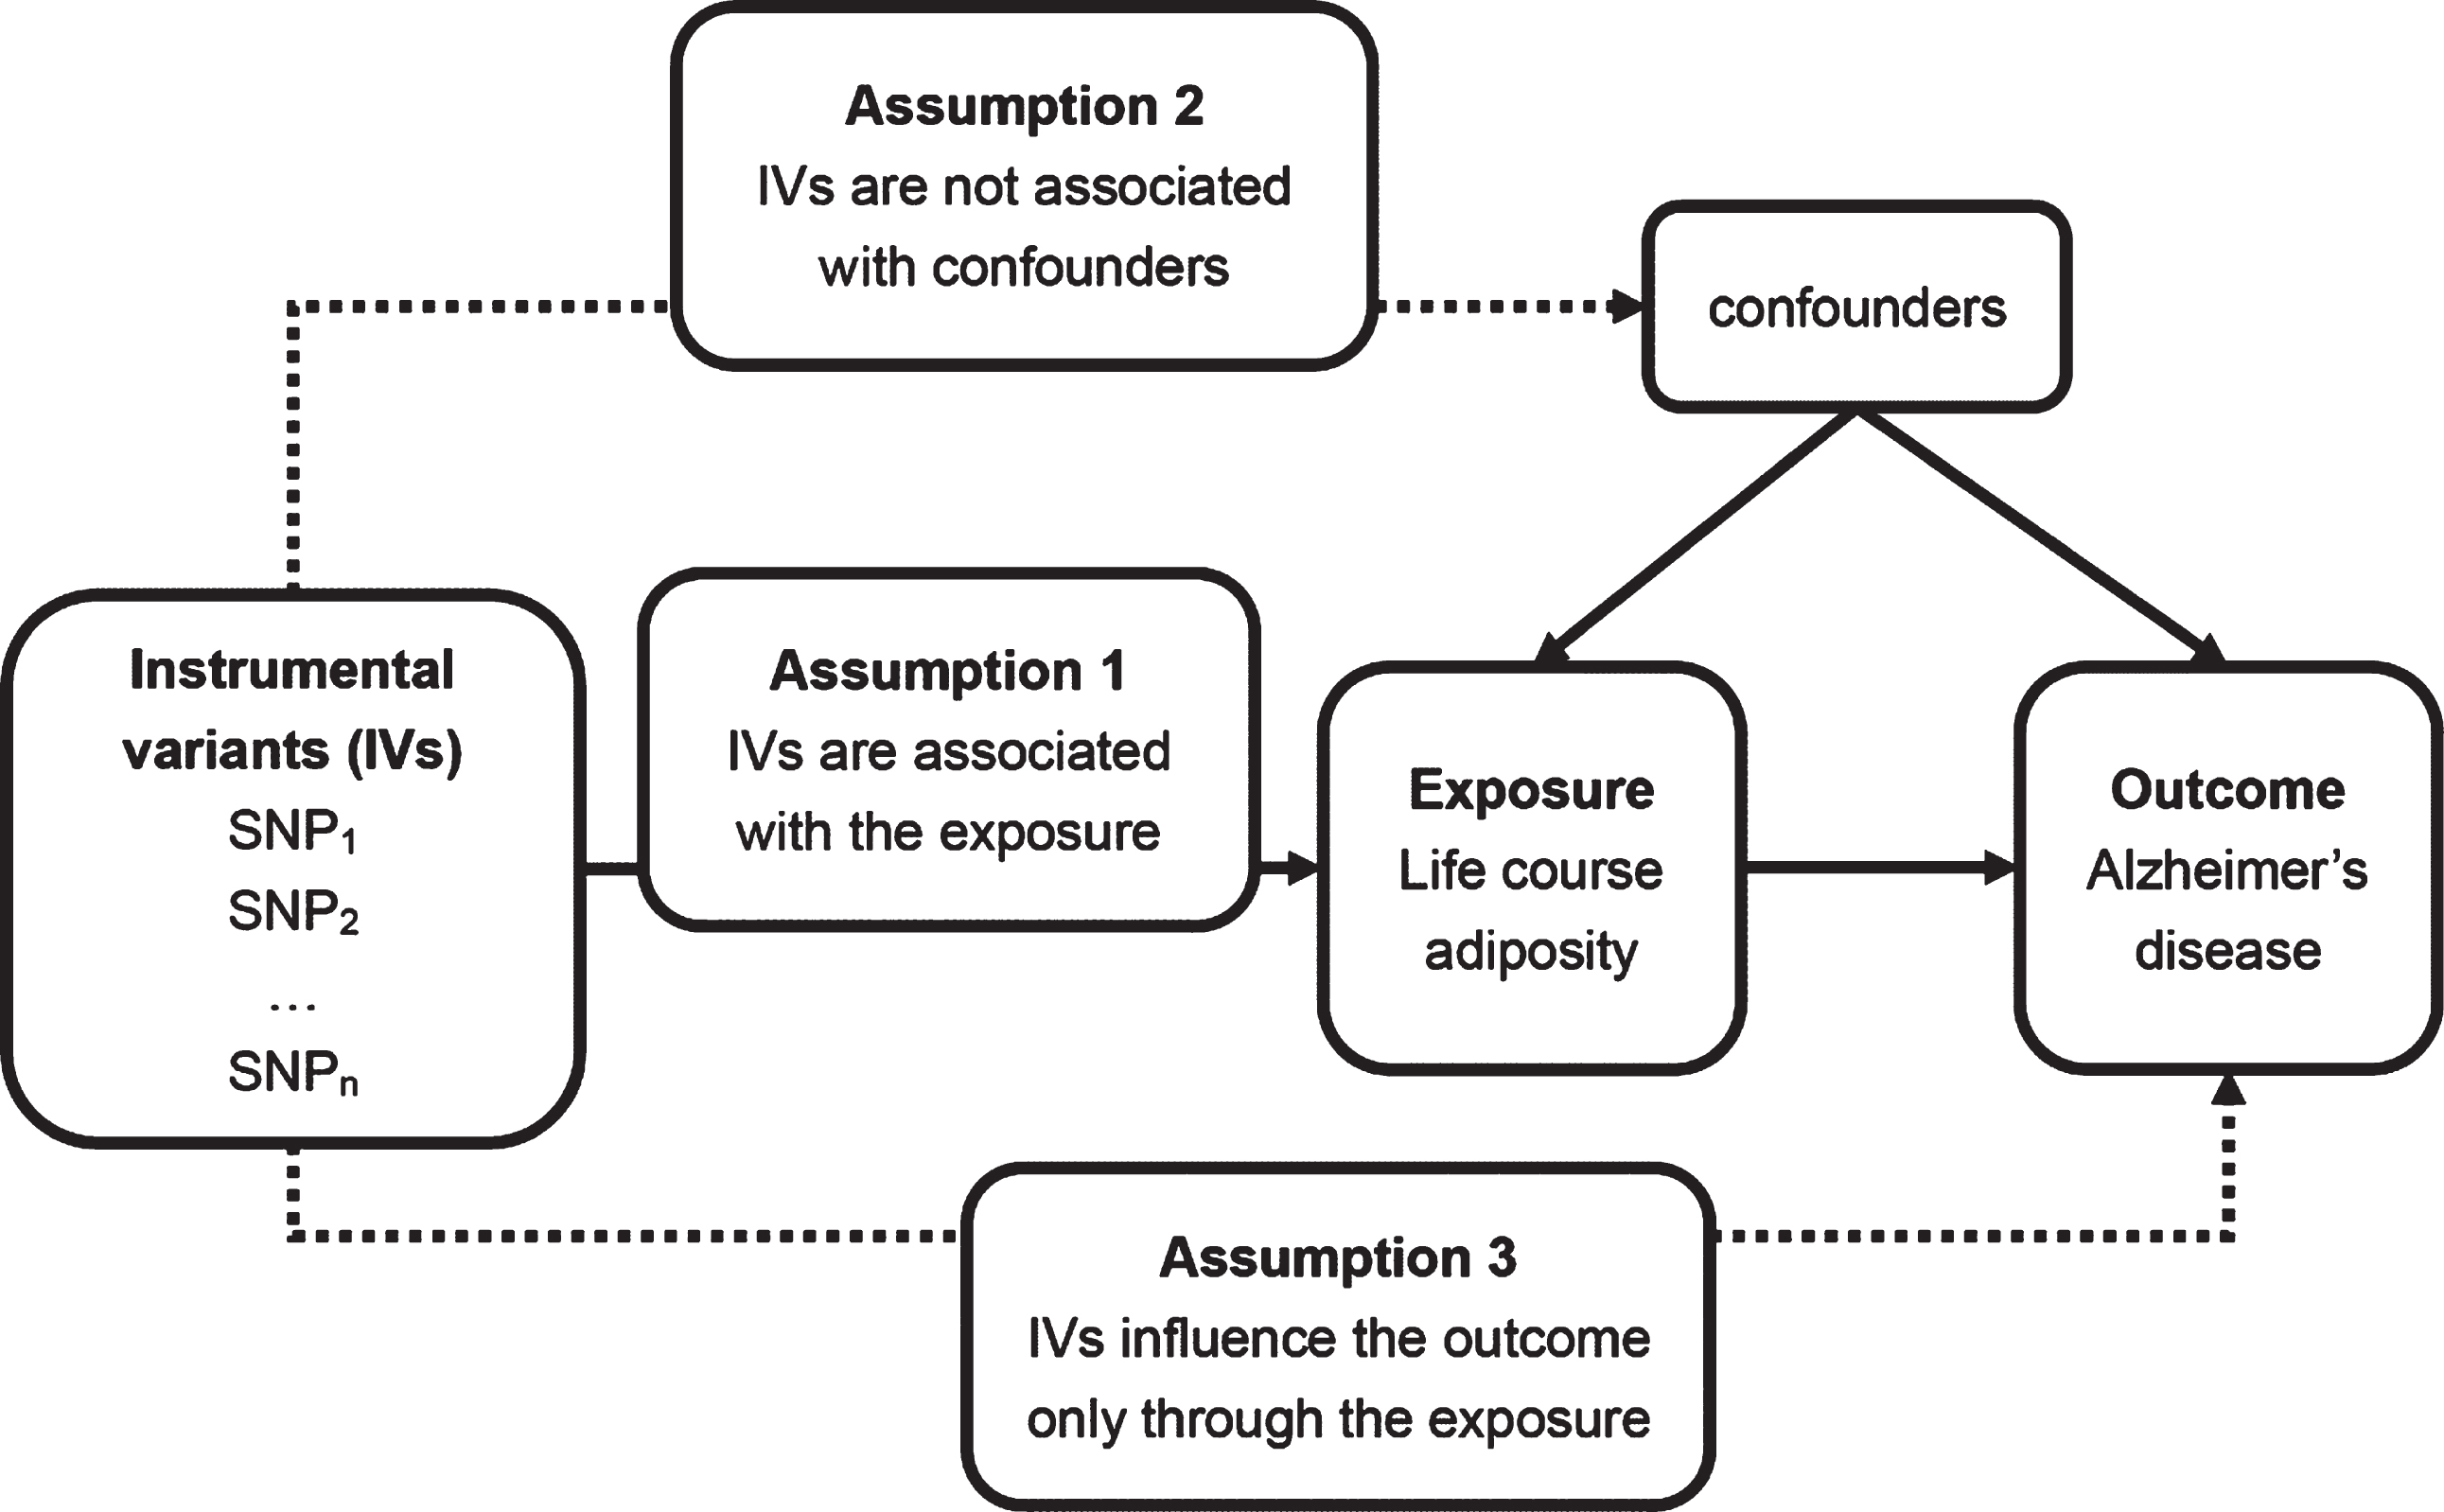
Principles of Mendelian randomization analysis and assumptions that need to be met to obtain unbiased estimates of causal effects. Dashed lines represent direct causal and potential pleiotropic effects that could violate Mendelian randomization assumptions. SNP, single nucleotide polymorphism.
MATERIALS AND METHODS
Genome-wide association studies for life course adiposity
We performed a 2-sample MR study using available summary results obtained from genome-wide association studies (GWASs). We searched PubMed to identify the traits of life course adiposity which were associated with AD. Six traits of life course adiposity were confirmed, i.e., BW, childhood BMI, BMI (refers to the adult BMI as following), WHR, WC, and body fat percentage (BFP). We searched the GWASs of these traits and identified five recently published GWASs with large sample sizes and complete information of genetic variants. The characteristics of the five GWASs are described here as well as in Supplementary Table 1.
Genetic variants for BW were drawn from a multi-ancestry GWAS meta-analysis with 153,781 individuals (143,677 people of European ancestry and 10,104 people of non-European ancestry) [18]. We only used its European ancestry meta-analysis, including 75,891 individuals from 30 GWASs and 67,786 individuals from UK Biobank. BW is the weight of a baby at birth and its unit is gram. In this GWAS, BW was collected from measurements at birth by medical practitioners, obstetric records, medical registers, interviews with the mother and adult self-report. A total of 77 single nucleotide polymorphisms (SNPs) which were significantly associated with BW (p < 5×10⁻⁸) were identified in this study.
Genetic variants for childhood BMI were extracted from a GWAS meta-analysis with 47,541 European children aged between 2 and 10 years [19]. BMI is defined as body mass divided by the square of body height and its unit is kilogram per square meter (kg/m2). We identified 15 SNPs which had significant associations with childhood BMI (p < 5×10⁻⁸).
Genetic variants for BMI and WHR were extracted from a GWAS meta-analysis of results from UK Biobank and the Genetic Investigation of ANthropometric Traits (GIANT) with approximately 700,000 individuals of European ancestry [20]. WHR is calculated by dividing waist circumference by hip circumference and its unit is null. Totally, 670 SNPs for BMI and 316 SNPs for WHR reached a significant level of association (p < 5×10⁻⁹) in this study.
Genetic variants for WC were drawn from a multi-ancestry GWAS meta-analysis with up to 224,459 individuals (93.6% of European ancestry) [21]. The unit of WC is centimeter (cm). And 46 SNPs for WC reached a significant level of association (p < 5×10⁻⁸) in this study.
Genetic variants for BFP were drawn from a multi-ancestry GWAS meta-analysis with up to 100,716 individuals (88.7% of European ancestry) from 56 studies [22]. BFP is the total fat mass divided by the total body mass, multiplied by 100. And its unit is null. BFP was measured either with bioimpedance analysis (BIA) or dual energy X-ray absorptiometry (DEXA). We identified 10 SNPs significantly associated with BFP (p < 5×10⁻⁸).
GWAS of AD
The recently published large GWAS of clinically diagnosed AD and AD-by-proxy included 71,880 cases and 383,378 controls of European ancestry [23]. The 71,880 cases consisted of 24,087 clinically diagnosed late-onset AD cases and 47,793 AD-by-proxy cases. The high heritability of AD implies that case status for offspring can be partially inferred from parental case status and that offspring of AD parents are likely to have a higher genetic AD risk load. Thus, the proxy cases were defined individuals with one or two parents with AD. The value of by-proxy phenotypes for GWAS was recently demonstrated by Liu et al. for 12 common diseases, including substantial gains in statistical power for AD [24]. In this study, data were obtained from multiple sources, including raw data from case-control samples collected by the Psychiatric Genomics Consortium (PGC-ALZ) and the Alzheimer’s Disease Sequencing Project (ADSP), summary data from the case-control samples in the International Genomics of Alzheimer’s Project (IGAP), and raw data from the population-based UK Biobank sample which was used to create a weighted AD-proxy phenotype. The characteristics of this GWAS are summarized in Supplementary Table 1.
Selection of IVs
Only genetic variants significantly associated with each trait of life course adiposity (p < 5×10⁻⁸) in a GWAS were considered as IVs. To assure the independence of SNPs, we excluded correlated SNPs at a threshold of linkage disequilibrium (LD) r2 > 0.001. We also excluded SNPs which had a probable role in the pathogenesis of AD using PhenoScanner GWAS database (http://www.phenoscanner.medschl.cam.ac.uk/) [25, 26]. Furthermore, if a SNP was not available for AD, we could find the proxy SNP (r2 > 0.9) using the online website SNiPA (http://snipa.helmholtzmuenchen.de/snipa3/), and if we could not find the proxy SNP, the missing SNP would be excluded. The strength of the SNPs was judged by F statistics [27]. A rule of thumb is that the F statistic should be greater than 10 and it indicates that a result based on a valid instrumental variable ought not to suffer substantially from weak instrument bias [16]. We excluded the SNPs whose F statistics were less than 10. The procedure of selection of IVs which were included in the analysis is shown in Fig. 2.

A flow diagram of selection of GWASs of life course adiposity and the number of SNPs used as instrumental variants in this Mendelian randomization analysis. GWAS, genome-wide association study; BW, birth weight; BMI, body mass index; WHR, waist-to-hip ratio; WC, waist circumference; BFP, body fat percentage; SNP, single nucleotide polymorphism; N, sample size of populations; LD, linkage disequilibrium; AD, Alzheimer’s disease.
Statistical analysis
Our MR analysis was based on three assumptions: (1) IVs are associated with life course adiposity; 2) IVs are not associated with confounders; 3) IVs influence AD only through life course adiposity (Fig. 1) [17]. For the first assumption, we selected the large GWAS and all SNPs were significantly associated with adiposity (p < 5×10⁻⁸). Various sensitivity analyses were conducted to prove the second and third assumptions, collectively known as independence from pleiotropy [17].
All statistical analyses were performed using the TwoSampleMR packages (version 0.5.2) in R software (version 3.6.3) [28]. We chose the inverse variance weighted (IVW) method as the main analysis method to estimate the causal effects of the traits of life course adiposity on AD. In the meanwhile, we performed other MR analysis methods as sensitivity analyses, including weighted median, MR-Egger, simple mode-based, and weighted mode-based methods. We conducted Cochran’s Q test to assess the heterogeneity of the causal estimates [29]. The intercept obtained from the MR-Egger regression was used to assess directional pleiotropy which could affect causal estimates [30]. Finally, we performed a leave-one-out analysis to investigate the influence of outlying and pleiotropic genetic variants.
Results are described as odd ratios (ORs) and 95% confidence intervals (CIs) per genetically predicted standard deviation (1-SD) unit increase in each trait. We applied a Bonferroni-corrected significance threshold computed as 8.33×10⁻³ (i.e., 0.05/6) to address the issue of multiple testing. p values between 8.33×10⁻³ and 0.05 were considered as suggestive evidence for a potential association. As the current study was based on published studies and public databases, no additional ethics approval or consent to participate was required.
RESULTS
We included six traits of life course adiposity in our MR analysis. After quality control, the numbers of IVs of each trait (BW, childhood BMI, BMI, WHR, WC, and BFP) for our MR analyses were 45, 14, 305, 201, 38, and 9, respectively (Fig. 2). F statistics were greater than 10 for all included SNPs which were used as IVs (Supplementary Table 2). All IVs with their beta effects and standard errors (SE) associated with life course adiposity and AD were listed in Supplementary Table 2. In addition, SNP effect sizes on each trait versus the effect sizes on AD are plotted in Fig. 4, and the estimated results per method are shown in each line.
We found that a genetically predicted 1-SD increase in BMI was significantly associated with a higher risk of AD (IVW: OR = 1.03, 95% CI = 1.01–1.05, p = 2.7×10⁻³; Fig. 3 and Supplementary Table 3). This association also reached suggestive threshold using the weighted median method (OR = 1.04, 95% CI = 1.00–1.07, p = 0.024; Supplementary Table 3). However, the Cochran’s Q test indicated substantial heterogeneity across instrumental SNP effects (Q = 406.08, p < 0.05, Supplementary Table 4). The intercept from the MR-Egger regression analysis suggested no apparent evidence of directional pleiotropy (p for intercept > 0.05; Supplementary Table 5). The leave-one-out analysis suggested that no SNP had an influence on the association (Supplementary Table 6).

Odds ratios (ORs) for associations between genetically predicted life course adiposity and Alzheimer’s disease. Estimates are per approximately 1 standard deviation increase in body weight (BW; g), childhood body mass index (BMI; kg/m2), BMI (kg/m2), waist-to-hip ratio (WHR; null), waist circumference (WC; cm), body fat percentage (BFP; null), respectively, using inverse variance weighted method. N of SNPs, number of single nucleotide polymorphisms; CI, confidence interval.
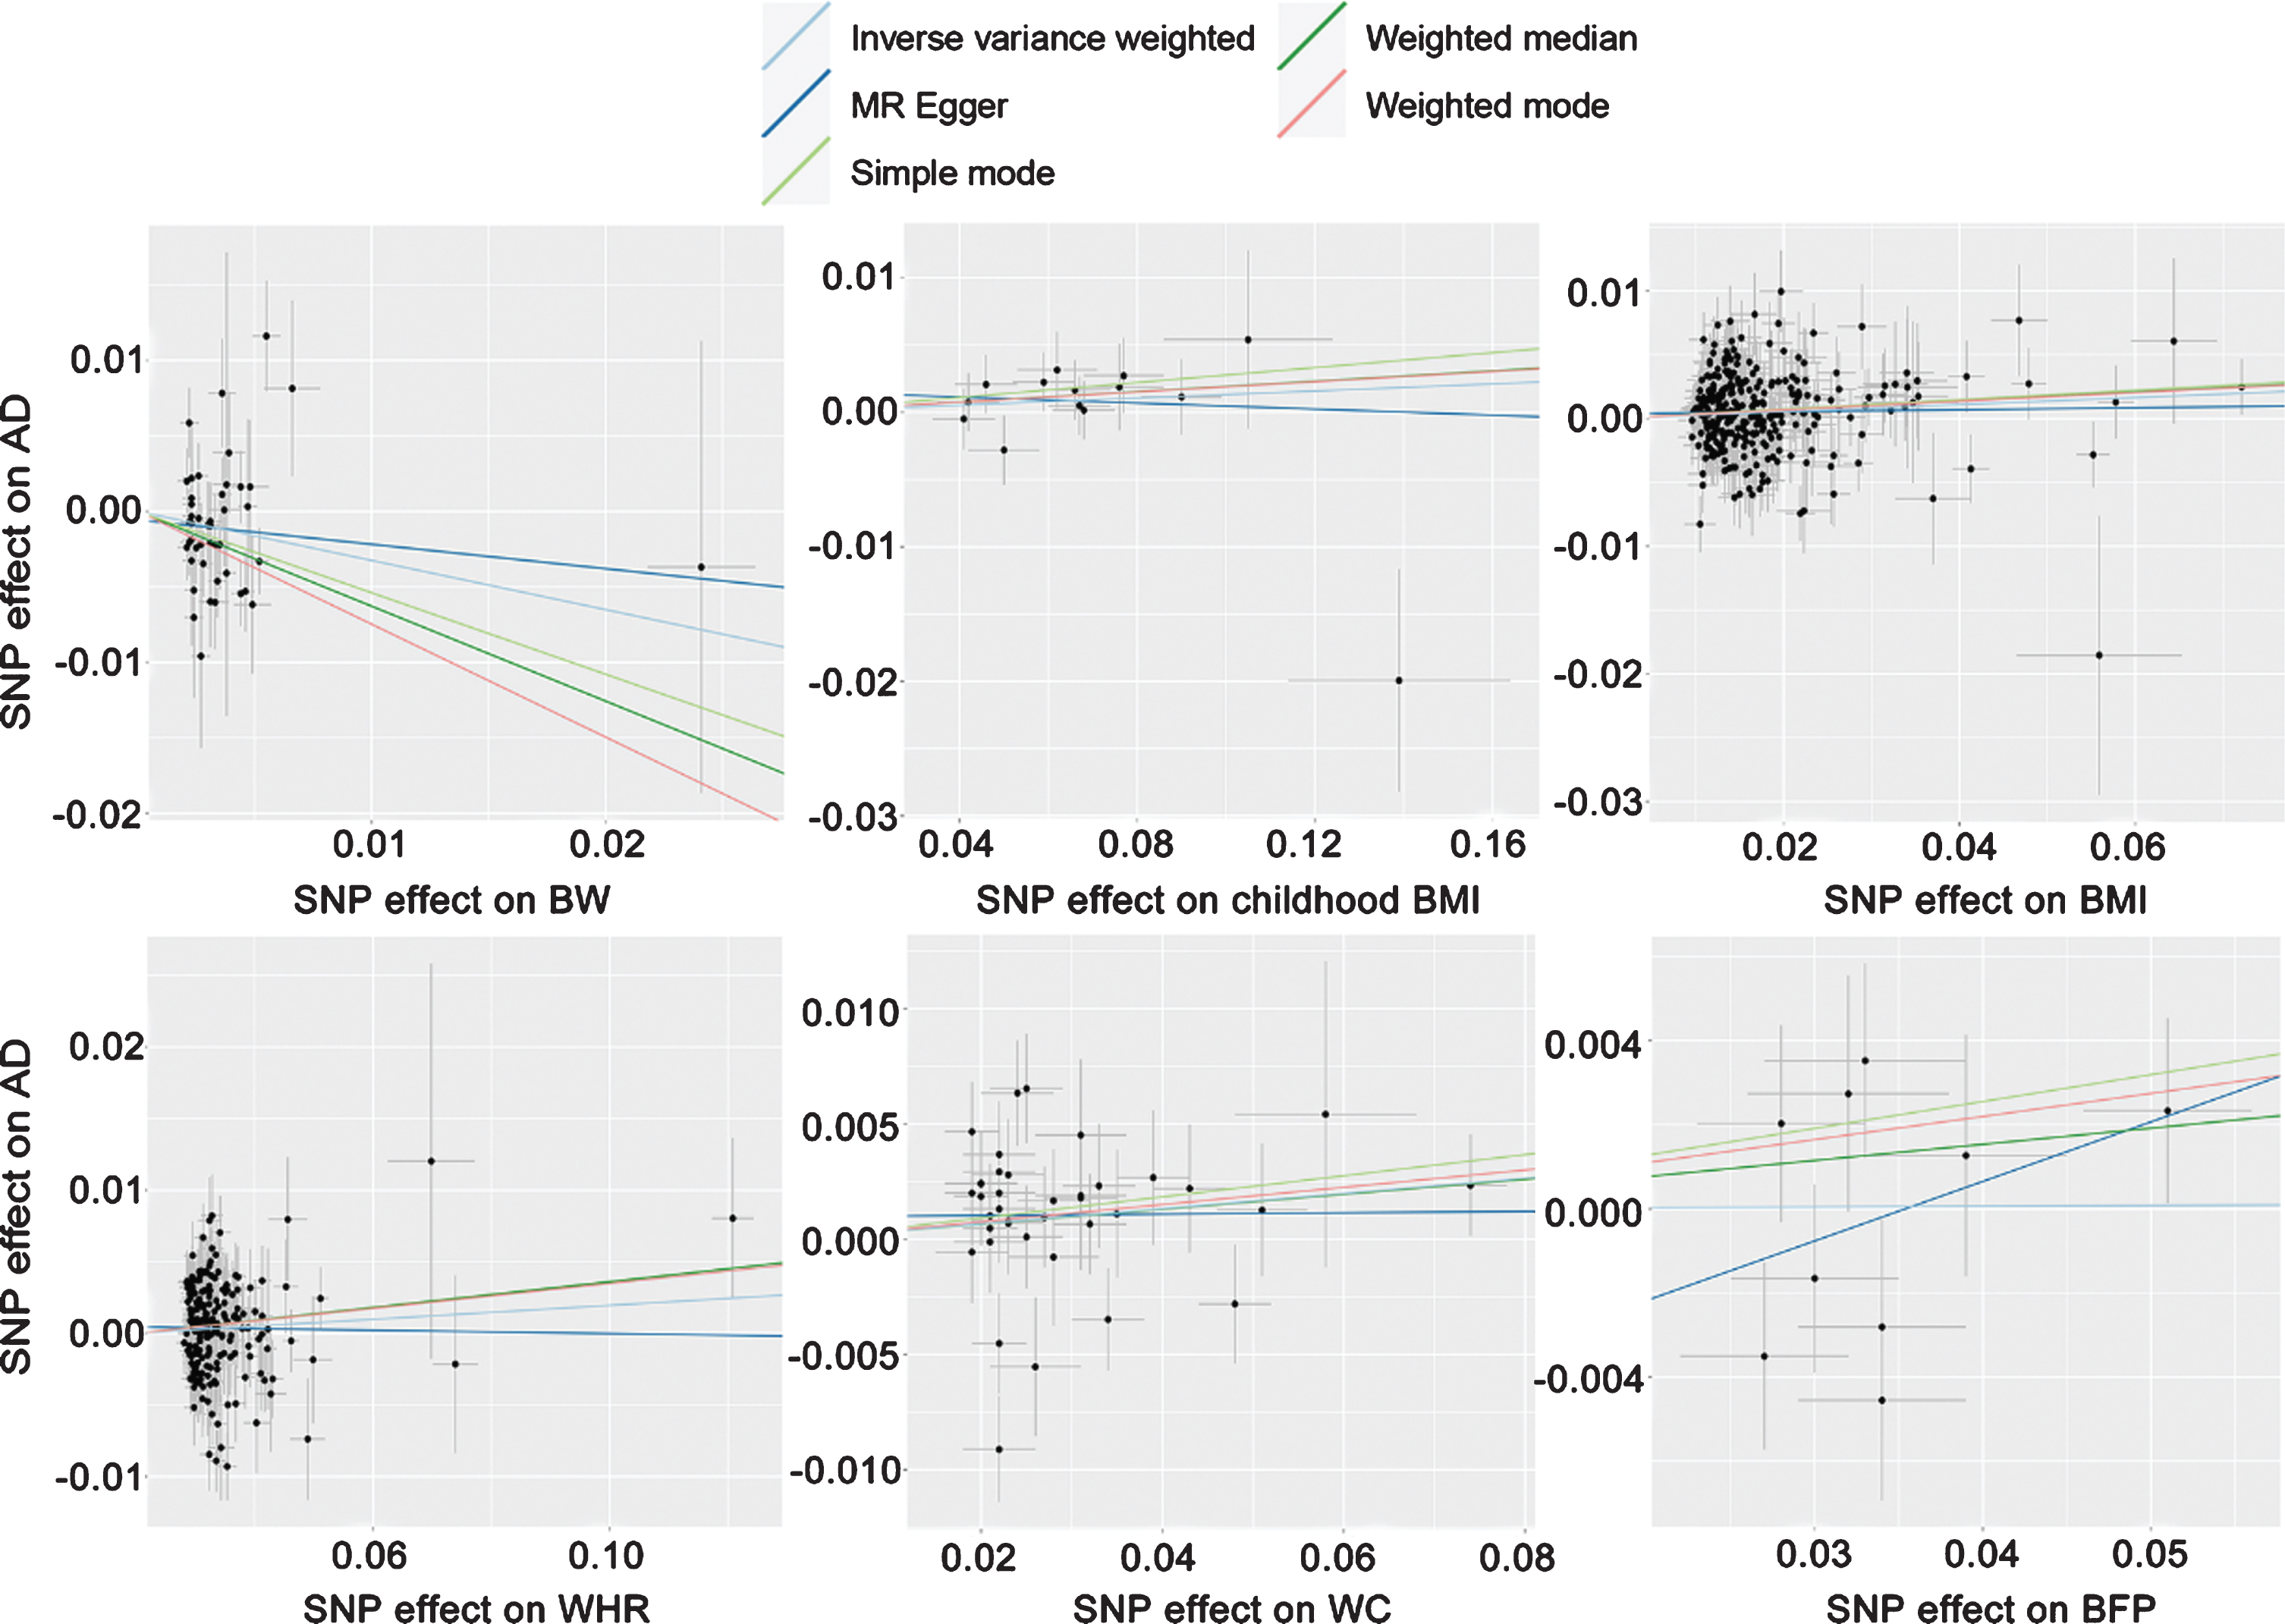
Scatterplot of SNP potential effects on life course adiposity versus AD, with the slope of each line corresponding to the estimated Mendelian randomization effect per method. BW, birth weight; BMI, body mass index; WHR, waist-to-hip ratio; WC, waist circumference; BFP, body fat percentage; SNP, single nucleotide polymorphism; AD, Alzheimer’s disease.
As for BW, the weighted median method suggested a significant association between BW and AD (OR = 0.94, 95% CI = 0.90–0.98, p = 1.8×10⁻³; Supplementary Table 3). Furthermore, a suggestive association between BW and AD was detected using IVW method (OR = 0.97, 95% CI = 0.94–1.00, p = 0.038; Fig. 3 and Supplementary Table 3) and weighted mode-based method (OR = 0.93, 95% CI = 0.87–0.99, p = 0.021; Supplementary Table 3). The Cochran’s Q test suggested some heterogeneity among SNPs for this association (Q = 68.11, p < 0.05; Supplementary Table 4). MR-Egger regression analysis suggested no evidence of pleiotropy (p > 0.05; Supplementary Table 5). The leave-one-out analysis found that two SNPs (rs1351394 and rs3780573) had a strong influence on the association (Supplementary Table 6).
In addition, we also detected a suggestive association between central adiposity (i.e., WHR and WC) and AD. Genetically predicted 1-SD higher WC and WHR increased the risk of AD to 1.03 (IVW: 95% = 1.00–1.07, p = 0.048; Fig. 3 and Supplementary Table 3) and 1.04 (weighted median: 95% CI = 1.00–1.07, p = 0.029; Supplementary Table 3), respectively. Heterogeneity was detected among SNPs for WC (Q = 59.73, p < 0.05) and WHR (Q = 300.19, p < 0.05) (Supplementary Table 4). The MR-Egger analysis showed no evidence of pleiotropy (p > 0.05; Supplementary Table 5). No SNP was found to affect the association in the leave-one-out analysis (Supplementary Table 6).
Neither genetically predicted 1-SD increase in childhood BMI (IVW: OR = 1.01, 95% CI = 0.99–1.04, p = 0.226) nor that in BFP (IVW: OR = 1.00, 95% CI = 0.95–1.06, p = 0.960) were found to have causal effects on the risk of AD (Fig. 3 and Supplementary Table 3).
DISCUSSION
In this study, we investigated the causal effect of life course adiposity (including BW, childhood BMI, BMI, WHR, WC, and BFP) with the risk of AD, using the MR analysis with genetic variants of life course adiposity as instrumental variants. Our study found that higher BMI and lower BW were significantly associated with an increased risk of AD. We also found suggestive evidence for associations of genetically predicted central adiposity (i.e., WHR and WC) with a higher risk of AD. However, there was no evidence to support the associations of AD with childhood BMI or BFP.
Strengths and limitations of study
One strength of this study is that we used the data from large GWASs of life course adiposity in relation to AD using MR analysis which can effectively reduce the interference of confounding factors and reverse causality. In addition, we comprehensively assessed the causal effects of adiposity from birth to adulthood on the risk of AD. BW which was significantly associated with AD have not previously been assessed with MR frameworks. Even for traits included in previous analyses [31–33], the larger number of cases and controls in our analysis affords us greater power to detect causal associations with AD and allows us to more accurately estimate effect magnitudes.
According to the three assumptions in MR design that the genetic variants used as IVs are strongly associated with exposure and no pleiotropic or direct causal pathway can explain the association (Fig. 1), there are several limitations in our study. First, although we chose SNPs as IVs which were significantly associated with traits and F statistics did not suggest weak instruments, our findings might have been affected by weak instrument bias [34]. Second, it was a challenge for all MR studies to completely exclude pleiotropy or an alternative direct causal pathway as the basis of the association, particularly for our traits determined by multiple genetic variants. The Cochran’s Q test suggested that potential pleiotropy was present in our analysis. However, the interpret from MR-Egger method suggested no pleiotropy. To address this issue, we applied sensitivity analyses with weighted median, simple mode-based and weighted mode-based estimate methods. The weighted median approaches give more weight to more precise instrumental variables and the estimate is consistent even when up to 50% of the information comes from invalid or weak instruments [35]. For BW and BMI, the estimated effects were similar in our sensitivity analyses, supporting their causal relationships with AD. Third, population stratification is another potential source of bias in MR analyses. We reduced this bias through using a dataset for life course adiposity and AD which only included individuals of European ancestry. However, the available datasets for WC and BFP are comprised of individuals of various ancestries that may produce bias. Finally, the GWAS for AD included AD-by-proxy phenotype which we couldn’t cut out, and it is not a pure measure of an individual’s AD status and may include individuals that never develop AD, so the genetic effect sizes will be somewhat underestimated [23].
Interpretation of findings
It is important to explore the potential biological mechanism that could decipher the causal relationship between higher adiposity (BMI, WHR, and WC) and increased risk of AD. First, one of the most important links between adiposity and AD is neuroinflammation. Adiposity is considered as chronic low-grade systemic inflammation, and adiposity-induced inflammation can lead to brain damage [36]. Second, adiposity may deteriorate cognitive function through induction of endothelial dysfunction and disruption of the blood-brain barrier [37]. Third, changes in adipose tissue physiology and levels of systemic hormones have both direct and indirect effects on the molecular processes of AD, leading to a higher risk of AD [38].
In addition, according to previous studies, there are several plausible pathways underlying the association between higher BW and a lower risk of AD. First, extremely low BW was a risk factor of neurodevelopment [39]. Second, higher BW was associated with better cognitive function and higher intellectual performance early in life [40, 41] which was known to be protective against cognitive dysfunction late in life and frequently referred to as cognitive reserve [42]. Third, an animal model study found that low BW rats paradoxically developed adult obesity with glucose intolerance and hypertension that were potential risk factors for the development of AD [43].
CONCLUSIONS AND FUTURE RESEARCH
In conclusion, our MR analysis showed strong evidence that higher BMI and lower BW were associated with an increased risk of AD. We also presented suggestive evidence that higher WC and higher WHR were potential risk factors for AD. Further studies are required to explore the biological pathways underpinning the associations.
Footnotes
ACKNOWLEDGMENTS
This work was made possible by the generous sharing of GWAS summary statistics. We thank PGC for providing summary results data for these analyses. The investigators within PGC contributed to the design and implementation of PGC and/or provided data but did not participate in the analysis or writing of this report. PGC was made possible by the generous participation of the control subjects, the patients, and their families. We also thank the participants, researchers, and staff associated with the many other studies from which we used data for this report. We thank the International Genomics of Alzheimer’s Project (IGAP) for providing summary results data for these analyses. The investigators within IGAP contributed to the design and implementation of IGAP and/or provided data but did not participate in analysis or writing of this report. IGAP was made possible by the generous participation of the control subjects, the patients, and their families. The i–Select chips were funded by the French National Foundation on Alzheimer’s disease and related disorders. EADI was supported by the LABEX (laboratory of excellence program investment for the future) DISTALZ grant, Inserm, Institut Pasteur de Lille, Université de Lille 2, and the Lille University Hospital. GERAD was supported by the Medical Research Council (Grant n° 503480), Alzheimer’s Research UK (Grant n° 503176), the Wellcome Trust (Grant n° 082604/2/07/Z) and German Federal Ministry of Education and Research (BMBF): Competence Network Dementia (CND) grant n° 01GI0102, 01GI0711, 01GI0420. CHARGE was partly supported by the NIH/NIA grant R01 AG033193 and the NIA AG081220 and AGES contract N01–AG–12100, the NHLBI grant R01 HL105756, the Icelandic Heart Association, and the Erasmus Medical Center and Erasmus University. ADGC was supported by the NIH/NIA grants: U01 AG032984, U24 AG021886, U01 AG016976, and the Alzheimer’s Association grant ADGC–10–196728. We would also like to thank Dr. Kevin Kuo for English language editing.
This study was supported by grants from the National Natural Science Foundation of China (91849126), the National Key R&D Program of China (2018YFC1314702), Shanghai Municipal Science and Technology Major Project (No.2018SHZDZX01) and ZJLab, Tianqiao and Chrissy Chen Institute, and the State Key Laboratory of Neurobiology and Frontiers Center for Brain Science of Ministry of Education, Fudan University.