
Abstract
Background:
Most common progressive brain diseases in the elderly are Alzheimer’s disease (AD) and vascular dementia (VaD). They present with relatively similar clinical symptoms of cognitive decline, but the underlying pathophysiological mechanisms are different.
Objective:
The aim is to explore the brain connectivity differences between AD and VaD patients compared to mild cognitive impairment (MCI) and normal elderly (Nold) subjects applying graph theory, in particular the Small World (SW) analysis.
Methods:
274 resting state EEGs were analyzed in 100 AD, 80 MCI, 40 VaD, and 54 Nold subjects. Graph theory analyses were applied to undirected and weighted networks obtained by lagged linear coherence evaluated by eLORETA tool.
Results:
VaD and AD patients presented more ordered low frequency structure (lower value of SW) than Nold and MCI subjects, and more random organization (higher value of SW) in low and high frequency alpha rhythms. Differences between patients have been found in high frequency alpha rhythms in VaD (higher value of SW) with respect to AD, and in theta band with a trend which is more similar to MCI and Nold than to AD. MCI subjects presented a network organization which is intermediate, in low frequency bands, between Nold and patients.
Conclusion:
Graph theory applied to EEG data has proved very useful in identifying differences in brain network patterns in subjects with dementia, proving to be a valid tool for differential diagnosis. Future studies will aim to validate this method to diagnose especially in the early stages of the disease and at single subject level.
INTRODUCTION
Dementia is any decline in memory or other cognitive skills that is severe enough to interfere with a person’s independent daily functioning [1]. Either primary neurological, neuropsychiatric, and medical conditions could cause dementia, which is thus best characterized as a syndrome rather than as one particular disease. The major risk factors for developing dementia are advancing age, genetic profile, and systemic vascular disease [2].
Given the absence of a disease-modifying treatment or cure, reducing the risk of developing dementia becomes even more important by early pharmacological and non-pharmacological interventions on modifiable risk factors, that is the reason why the early diagnosis of dementia has become an important goal of the modern patient work-up (the Interceptor Project [3]).
The two most common types of dementias in the elderly are Alzheimer’s disease (AD) and vascular dementia (VaD); both represent a leading public-health problem given the rising life expectation of the population. AD and VaD present relatively similar clinical symptoms of cognitive decline, but the underlying pathophysiological mechanisms are different [4].
Even if from a neuropsychological point of view the two forms of dementia, evaluated using a screening tests as the Mini-Mental State Examination (MMSE), produce similar results [5, 6], and despite the similarities between symptoms, they present underlying pathophysiological mechanisms differences, therefore a differential diagnosis is even more important. Neuropsychological disorders in VaD patients reflect the neural substrates affected by the vascular pathology that characterizes this diagnosis [7]. Although an highly variable cognitive impairment profile has been described in VaD [8–11], several studies that examined profiles of cognitive deficits associated with VaD and AD suggest that individuals with VaD show more impairment than those with AD on cognitive test examining executive functions, whereas patients with AD are more impaired than those with VaD on episodic memory measures [12–17].
AD is manifested by a progressive deterioration of cognitive functions and characteristic appearance of deposits of amyloid-β, extracellular senile plaques, and intracellular neurofibrillary tangles in the cortex and subcortical gray matter [18, 19]. The initial stages of the disease are characterized by deficits in the ability to encode and store new memories, followed later by subsequent progressive changes in behavior and cognition [20].
VaD occurs when cerebrovascular diseases of differing etiologies lead to a loss of autonomy in person’s daily functioning [1]. Etiologies are many-fold and include: clinically evident stroke or multiple strokes, small-vessel ischemic disease, hereditary diseases like cerebral autosomal dominant arteriopathy with subcortical infarcts, and cerebral amyloid angiopathy [21]. Other risk factors for vascular cognitive impairment are hypertension, diabetes [22, 23], smoking [24], hypercholesterolemia [21], coronary artery disease, atrial fibrillation, and myocardial infarction [25].
Nowadays, the most common imaging technique applied to the differentiation of the two dementia types is magnetic resonance imaging (MRI). It allows the assessment of the presence of structural key elements such as medial temporal lobe atrophy, white matter lesions, gliotic lesions due to previous ischemic asymptomatic infarcts, and microbleeds [26], and it is able to reveal the reduction of the hippocampal volume in AD respect to VaD patients [27–29].
A potentially useful diagnostic tool for differential diagnosis is the electroencephalography (EEG) which compared to routine structural brain imaging such as MRI, has a comparable diagnosis accuracy but with significantly lower costs [3, 4]. In fact, dementia has been demonstrated to be a brain disconnection pathology [30], thus an approach based on EEG brain connectivity architecture analysis could turn out to be very helpful in distinguishing the two forms of dementia. Previous studies have shown how it would be possible to apply graph theory, a mathematical representation of the real brain architecture, to AD diagnosis [31]. In particular, the Small World (SW) index, a parameter explaining the balance between brain networks local specialization and global integration [31, 32], has been found to represent the functional counterpart of the hippocampal progressive loss of volume and related-network disconnection typical of dementia [33]. Furthermore, SW analyses has been carried out to distinguish between AD versus mild cognitive impairment (MCI), and AD versus healthy subjects respectively. The SW has been found as significantly increased in the theta band in MCI with respect to AD [34]. Moreover, MCI subjects have been revealed to present, while resting with eyes closed, a SW which is higher compared with AD in the delta, theta and beta 1 EEG frequency bands, and which is closer to the SW of healthy subjects [35]. Moreover, a study of correlation between the SW index in resting-state and the memory performance in AD, MCI, and normal elderly (Nold) subjects has shown higher values in delta, theta, and beta bands in Nold and MCI compared to AD, while lower values in the MCI respect to Nold in the same frequency bands except for the alpha band, where Nold had lower SW values compared to MCI and AD [31]).
This bulk of previous findings support the hypothesis of an intermediate status of MCI between physiological brain aging condition and overt dementia [36].
Keeping in mind the above evidence, the aim of the present study is to investigate the brain connectivity differences between AD, MCI, and Nold, [31] adding the VaD group, through the EEG and SW data analyses.
METHODS
Participants
A dataset of 274 subjects was analyzed. The patients group included 100 mild AD (60%female, age 72.00±1.56 standard error, education 8.17±1.60, MMSE 21.3±1.02), MCI group included 80 subjects (55%female, age 70.77±1.26, education 8.03±0.86, MMSE 26.8±0.30), VaD group included 40 subjects (70%female, age 73.17±0.94, education 7.38±0.64, MMSE 20.8±0.77), and EEG control group of 54 normal elderly subjects (50%female, age 69.40±1.75, education 9.54±0.70, MMSE 28.9±0.17).
All the experiments were undertaken with the informed and signed consent of each participant, according to Code of Ethics of the World Medical Association (1997) and the experimental procedures were conforming to the Declaration of Helsinki. The EEG protocol was performed in accordance with safety guidelines procedures.
AD was diagnosed according to the National Institute on Aging-Alzheimer’s Association workgroups [37] and DSM IV TR criteria. MCI was diagnosed according to guidelines and clinical standards [38–41]. The exclusion criteria for AD included: 1) frontotemporal dementia, diagnosed according to criteria of Lund and Manchester Groups (1994), 2) vascular dementia, diagnosed according to NINDS-AIREN criteria [7, 42–44], 3) extra-pyramidal syndromes, 4) reversible dementias (including pseudodementia of depression); and 5) Lewy body dementia, according to the criteria by [45]. The exclusion criteria for MCI were the same as those established for the AD but provided in addition mild AD.
VaD was diagnosed according to NINDS-AIREN criteria [42]. VaD patients had Hachinski Ischemic scores≥4 [46]. Exclusion criteria included an history of neurological or psychiatric disorder, current treatment with vasoactive or psychotropic medication. All subjects were right-handed at Handedness Questionnaire [47].
Data recordings and preprocessing
EEG clinical recordings were measured at rest, without any task to perform, in at least 6 min of eyes-closed condition. During the recording, subjects were seated in a comfortable armchair. EEG signals were measured from 19 electrodes positioned according to the International 10–20 system.
Two separate channels, vertical and horizontal EOGs, were used to monitor eyes blinking. Impedance was kept below 5 KΩ and the sampling rate frequency was set up at 256 Hz.
The data were processed in Matlab (MathWorks, Natick, MA) using scripts based on EEGLAB toolbox (Swartz Center for Computational Neurosciences, La Jolla, CA) [32, 49].
The EEG recordings were band-pass filtered from 0.2 to 47 Hz using a finite impulse response (FIR) filter. Imported data were divided in 2 s duration epochs and principal artifacts in the EEG recordings (i.e., eye movements, scalp muscle contraction and cardiac activity) were removed first by an EEG expert visual inspection, and later with Infomax ICA algorithm [50, 51], that enables the separation of statistically independent sources from multichannel EEG recordings [52–56] as implemented in the EEGLAB. At the end of the artifact removal procedure at least 5 min remained for subjects.
Functional connectivity of cortical sources analysis
Brain connectivity was computed using exact low resolution electromagnetic tomography (eLORETA) [57] software on regions of interest (ROIs) defined according to the Brodmann areas (Bas): 42 ROIs (BAs: 1, 2, 3, 4, 5, 6, 7, 8, 9, 10, 11, 13, 17, 18, 19, 20, 21, 22, 23, 24, 25, 27, 28, 29, 30, 31, 32, 33, 34, 35, 36, 37, 38, 39, 40, 41, 42, 43, 44, 45, 46, 47), for the left and for the right hemisphere.
ROIs are needed for the estimation of electric neuronal activity that is used to analyze brain functional connectivity.
Among the eLORETA current density time series of the ROIs, intracortical Lagged Linear Coherence, extracted by “all nearest voxels” for the 84 ROIs and centered on each BA of interest by a sphere of 19 mm for the resting sub-networks, was computed [58, 59] between all possible pairs of the ROIs for each of the seven independent EEG frequency bands [60] of delta (2–4 Hz), theta (4–8 Hz), alpha 1 (8–10.5 Hz), alpha 2 (10.5–13 Hz), beta 1 (13–20 Hz), and beta 2 (20–30 Hz) for each subject.
Moving from the definition for the complex valued coherence [61, 62] between time series x and y in the frequency band ω, which is based on the cross-spectrum given by the covariance and variances of the signals, the lagged linear coherence in the frequency band ω is reported on the following equation [57, 58]:
where Var and Cov are variances and covariance of the signals and ImCov and ReCov denotes the imaginary and real part of covariance respectively.
This equation was developed to provide a measure of true physiological connectivity not affected by volume conduction and with low spatial resolution. The values of connectivity computing between all pairs of ROIs for each frequency band and for each subject, were used as measure of weight of the graph in the follow graph analyses.
Graph analysis
A network is a mathematical representation of a real-world complex system and is defined by a collection of nodes and links between pairs of nodes. Nodes in large-scale brain networks represent brain regions, while links represent anatomical, functional, or effective connections, depending on the dataset. The nature of nodes and links in individual brain networks is determined by combinations of brain mapping methods, anatomical parcellation schemes, and measures of connectivity. Many combinations occur in various experimental settings [62]. Nodes should ideally represent brain regions with coherent patterns of extrinsic anatomical or functional connections [63]. In the present study, undirected and weighted networks based on the connectivity between different ROIs were built. The nodes of the network were defined as the ROIs and the edges of the network were weighted by the lagged linear connectivity values [64]. Two core measures of graph theory were computed: weighted characteristic path length and weighted clustering coefficient, representative of global connectedness and local interconnectedness respectively [65].
The SW index was defined as the ratio of the normalized clustering coefficient Cw and the normalized path length Lw [52, 63], and it was used to describe the balance between the local connectedness and the global integration of a network. The normalization was obtain dividing the values of characteristic path length and of clustering coefficient by the mean values obtained by the average measure of each parameter in all frequency bands.
Statistical evaluation
A statistical ANOVA design was addressed for the SW index between the factors Group (AD, MCI, VaD, Nold) and Band (delta, theta, alpha 1, alpha 2, beta 1, beta 2). The normality of the data was tested using the Kolmogorov–Smirnov test, and the hypothesis of Gaussianity could not be rejected. Greenhouse and Geisser correction were used for the protection against a possible violation of the sphericity assumption in the repeated measure ANOVA. Besides, post-hoc analysis with the Duncan’s test and significance level at 0.05 was performed.
RESULTS
The ANOVA for the evaluation of SW index showed a statistically significant interaction (F (15, 1350) = 8.5266, p < 0.0001) between all factors Group (AD, MCI, VaD, Nold) and Band (delta, theta, alpha 1, alpha 2, beta 1, beta 2) as reported in Fig. 1. The Duncan post-hoc testing showed the following results:
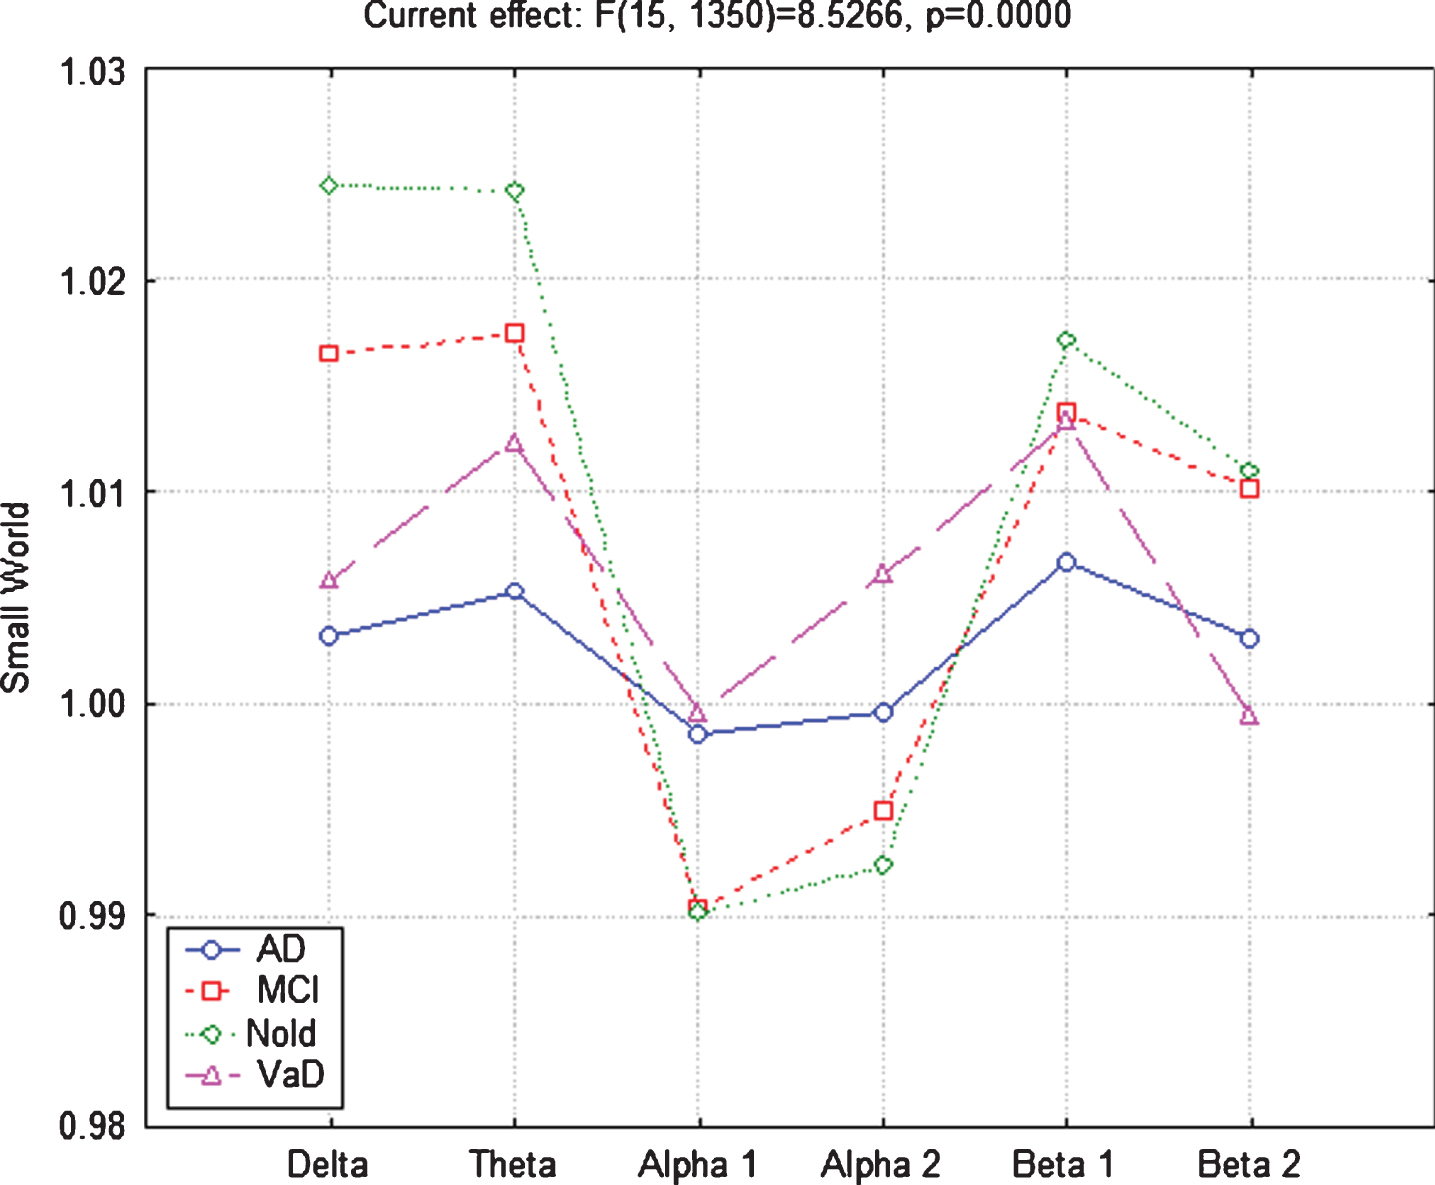
Small World (SW) trends in the four groups of subjects. ANOVA for the evaluation of SW showed a statistically significant interaction (F(15, 1350) = 8.5266, p = 0.0000) between all factors Group (AD, MCI, VaD, Nold) and Band (delta, theta, alpha 1, alpha 2, beta 1, beta 2).
AD and VaD patients versus Nold group
Both AD and VaD patients presented lower SW values in delta (AD p < 0.0001, VaD p < 0. 0001), theta (AD p < 0.0001, VaD p < 0.0006), and beta 2 (AD p < 0.0301, VaD p < 0.0012), and higher values in alpha 1 (AD p < 0.0153, VaD p < 0.0081) and alpha 2 (AD p < 0.0463, VaD p < 0.0000), while only the AD patients presented lower values of SW index in beta 1 (p < 0.0030) respect to Nold subjects.
MCI versus Nold subjects
MCI subjects presented lower values of SW index in delta (p < 0.0251) and theta (p < 0.0354) bands with respect to Nold subjects.
MCI subjects versus AD and VaD Patients
With respect to AD and VaD patients, MCI subjects presented higher SW values in delta (AD p < 0.0001, VaD p < 0.0027), theta (AD p < 0.0006), beta 1 (AD p < 0.0509), and beta 2 (AD p < 0.0537, VaD p < 0.0031) bands, and lower SW values in alpha 1 (AD p < 0.0154, VaD p < 0.0086) and alpha 2 (VaD p < 0.0017) bands.
AD versus VaD patients
AD patients presented lower values of SW index in theta (p < 0.0518), alpha 2 (p < 0.0686), and beta 1 (p < 0.0623) bands with respect to VaD patients.
DISCUSSION
Dementia syndrome has a multitude of causes underlying cognitive impairment; some of them are not due to a neurodegenerative process [66]. VaD is one of the most common causes of dementia second only to AD, affecting the elderly over the age of 65 years. Indeed, VaD dementia onset can be sudden (stroke) or slow (repeated micro-strokes or diffuse atherosclerosis); different from the slowly progressive AD course, VaD is characterized by an unpredictable stepwise worsening [67]. VaD and AD are two forms of dementia that exhibit relatively similar clinical symptoms but conceal different pathophysiological mechanisms; accordingly, it is crucial—especially in the early stages of the pathology—to identify them for address a correct and differential diagnosis.
MRI is a relatively expensive, a little invasive, and often not immediately available as a type of exam for this kind of diagnosis. Moreover, it has been shown that dementias reflect progressive alterations of brain connectivity; therefore a study of connectivity parameters through EEG data (EEG is an economical, noninvasive, and more readily available procedure) is a more suitable approach for investigating these pathological mechanisms and differentiating the different forms at least as a first-level screening test [30].
The present study aimed to investigate the brain connectivity differences between AD and VaD dementia, and between AD and VaD with respect to MCI and Nold subjects, in particular by means of SW network analysis in resting state clinical EEG recordings.
The results showed that VaD and AD patients presented more ordered low frequency structure (lower value of SW) than Nold subjects. We might speculate that the lower SW value in the delta band represents a sort of functional disconnection, while in alpha band the same trend (lower value of SW) could be interpreted as a marker of improved cortical networks functional organization, thus of better performance [34, 48]. Conversely, in the low and high frequency alpha EEG rhythms, VaD and AD patients presented more random organization (higher value of SW) than Nold subjects; therefore the behavior of the patients’ network is less regular in this frequency range and less ready to react from a cognitive point of view, resulting in a reduction of cortical networks performance. These results are in line with a previous study in which the SW pattern, evaluated in AD, MCI, and Nold subjects presented Nold > MCI > AD trend in the low frequencies band and the opposite one in the alpha band [31].
An additional finding of the present study is that the low frequency bands in the MCI subjects presented an intermediate network organization between Nold and demented patients, which is closer to the trend of Nold subjects in the low and high alpha and beta rhythms, confirming the hypothesis that MCI is an intermediate condition along the disease progression often prodromal to dementia. [31, 68].
Furthermore, as a novelty of this study, VaD patients presented more random organization (higher values of SW) in the high alpha rhythms than AD, instead a more ordered structure (thus a lower SW value). VaD patients also showed a different network structure (higher value of SW) in theta band, with a trend which is more similar to MCI and Nold subjects than AD.
The observed SW reduction in the low frequency bands in AD and VaD groups could be interpreted as a loss of efficiency of the network communication flow between distant brain regions. Indeed, while in AD it appears that the main mechanism that produces slow activity is a loss of structural and functional integrity of long corticocortical tracts [69], in vascular lesions a slow synchronization seems to be linked to the interruption of the thalamo-cortical pathways in relation to an extensive damage to the white matter in the hemispheres which causes brain disconnection [70]. This different patho-physiological mechanism could be at the base of the theta bands difference between AD and VaD patients.
In this line, a study on EEG data and single photon emission computed tomography (SPECT) images in a small groups of AD, VaD, and MCI patients, showed that EEG changes in VaD patients were predominantly in the form of theta waves, while SPECT images presented mostly asymmetrical abnormalities as opposed to bilateral hypoperfusion temporoparietal regions of AD group [3, 71].
Another study that used graph theory on EEG data to explore effective connectivity in patients with vascular dementia during a visual oddball task showed how the brain network in VaD was significantly altered towards a more random network. Also, the changes in brain connectivity and brain networks (number of incoming and outgoing connections) of VaD patients were primarily in delta and theta frequency bands as well as in alpha 1 and beta frequency bands [72].
In the current study, the results found in the alpha band rhythms could be discussed considering that, while low-frequency alpha rhythms (about 8–10 Hz) are supposed to reflect the regulation of global cortical arousal [73, 74]. There is in fact a general consensus that high alpha rhythm (10.5–12 Hz) reflects the functional modalities of the thalamo-cortical and cortico-cortical loops which facilitate/inhibit the transmission of impulses and the recovery of the processing of sensorimotor information flow [73–76]. In particular, our results showed that VaD patients had a “worse” condition, namely higher value of SW, in the higher alpha band respect to AD, MCI, and Nold subjects and this could be justified by the fact that this frequency band reflects the regulation of global cortical arousal, which in vascular dementia seems to involve more distant and deep brain areas (cortical and subcortical) compared to AD subjects, as already observed in an interruption of the thalamo-cortical pathways in vascular pathology [70].
CONCLUSION
Alzheimer’s disease and vascular dementia represent a leading public-health problem given the rising age of the population and an early diagnosis of dementia, especially at early stage, has become an important goal of the modern patient work-up.
Graph theory applied to EEG data, a relatively simple and inexpensive diagnostic tool, has proved very useful in identifying differences in brain network behaviors in subjects with dementia and future studies could help in using this method to carry out diagnosis in early stages also at single subject level.