
Abstract
Background:
Alzheimer’s disease (AD) is characterized by a progressive decline in cognitive functioning for which there is a stark lack of effective treatments. Investigating the neurophysiological markers of symptom severity in AD may aid in the identification of alternative treatment targets.
Objective:
In the current study we used a multimodal approach to investigate the association between functional connectivity (specifically between scalp electrodes placed over frontal and parietal regions) and symptom severity in AD, and to explore the relationship between connectivity and cortical excitability.
Methods:
40 people with AD (25 mild severity, 15 moderate severity) underwent neurobiological assessment (resting state electroencephalography (EEG) and prefrontal transcranial magnetic stimulation (TMS) with EEG) and cognitive assessment. Neurobiological outcomes were resting state functional connectivity and TMS-evoked potentials. Cognitive outcomes were scores on the Alzheimer’s Disease Assessment Scale-Cognitive Subscale, Mini-Mental Status Examination, and a measure of episodic verbal learning.
Results:
Greater contralateral functional theta connectivity between frontal scalp electrodes and parietal scalp electrodes was associated with poorer cognitive performance. In addition, significant correlations were seen between the contralateral theta connectivity and the N100 and P60 TMS-evoked potentials measured from electrodes over the left dorsolateral prefrontal cortex.
Conclusion:
Together these findings provide initial support for the use of multimodal neurophysiological approaches to investigate potential therapeutic targets in AD. Suggestions for future research are discussed.
Keywords
INTRODUCTION
Alzheimer’s disease (AD) is the most common type of dementia, accounting for up to 80%of all diagnosed cases. It is characterized by a progressive decline in most areas of cognition [1]. In 2019 it was estimated that there were over 50 million people worldwide living with dementia, in the absence of a significant treatment breakthrough this number is predicted to more than triple by 2050 [2]. Current pharmacological treatments, predominantly targeting the observed reduction in cholinergic activity, show limited effectiveness and commonly lead to side effects which impact tolerability [3]. Of the 413 AD drug trials conducted between 2002 and 2012, the overall failure rate was 99.6%, with the last 10 years seeing repeated failed attempts to develop disease modifying therapies predominantly targeting amyloid-β [1]. While some of these drugs showed reductions in amyloid plaque burden (e.g., aducanumab, gantenerumab), this was not associated with clinical improvement, casting doubt on the validity of solely targeting amyloid [4–6]. In this context, it is imperative that alternative targets are explored, in particular focusing on candidates that are proximate to symptoms [7]. More recent findings regarding the pathophysiology of AD have identified neural connectivity as a potential target, with evidence that the accumulation of disease protein is associated with disrupted connectivity in function-critical neural networks [7, 8].
Successful cognition relies on the structural and functional health of neural networks throughout the brain, with cognitive functions represented by dynamic activity occurring within and between these networks [9]. This dynamic activity relies on interconnected and functionally interdependent networks of synapses [9]. AD has been associated with synaptic dysfunction, impaired neural activity, and neurodegeneration; all of which can damage large-scale, function-critical neural networks [7, 8,10]. Indeed, dysfunctional connectivity, predominantly in the default mode network (DMN), has been consistently reported in AD [11]. More recent studies have further investigated changes in connectivity, including looking at changes over time in AD as a function of illness severity, across multiple networks and in association with cognitive symptoms [11]. In a particularly comprehensive investigation, Contreras et al. [12] found that functional connectivity within the frontoparietal network (FPN), and between the FPN and DMN, was significantly increased in AD resulting in what they described as ‘greater co-classification’ or ‘reduced segregation’ [12]. In the healthy brain, the FPN has been shown to exert control over the DMN, down regulating its activity. This dynamic balancing act among neural networks is thought to be critical for healthy brain function and cognition; having been repeatedly shown to be essential for performing complex cognitive tasks, including attentional control, memory, and executive functioning [13]. In support of this, Contreras et al. also found significant correlations between reduced episodic memory and greater internal coherence (i.e., hyper-connectedness) of the FPN [12]. Disrupted connectivity, including in the FPN, has also been reported using techniques which directly measure brain activity with superior temporal resolution, and hence are better suited to examining brain changes underlying cognitive decline, namely electroencephalography (EEG) and magnetoencephalography (MEG) [14–19]. Studies examining connectivity using EEG and MEG have shown both connectivity increases and decreases in AD compared to healthy controls and/or those with mild cognitive impairment [14–19]. With the direction of connectivity changes reported variously impacted by frequency band, spatiotemporal region, illness severity, and even analysis technique [15, 17–19].
It has been suggested the dysfunctional (i.e., increased or decreased) connectivity seen in AD may be due to impairments in inhibitory interneuron function and resultant excitatory-inhibitory imbalance [8, 20]. Impairments in excitatory-inhibitory balance can potentially be remediated using neuromodulatory techniques including non-invasive brain stimulation [21]. Therefore, comprehensive multimodal investigation of connectivity and cortical excitability is an important step in treatment development. In the current study we sought to explore whether functional connectivity between frontal and parietal scalp electrodes differentiated AD participants based on illness severity and whether connectivity was associated with cortical activity measured at prefrontal electrodes, with a view to examining neurophysiological markers of illness severity as they related to possible mechanisms of neuromodulatory treatments.
We collected cross sectional baseline data from participants with mild to moderate AD at the outset of a clinical trial. The clinical trial data will be reported separately in a stand-alone publication. Here we report outcomes of the baseline comparison between mild and moderate AD participants compared across potential neuropsychological markers of severity. We specifically looked at functional connectivity between scalp electrodes over frontal and parietal regions in light of the close association of these regions with cognitions impacted by AD, such as episodic memory. We also examined cortical excitability in prefrontal electrodes as the prefrontal region has been identified as an area of synaptic dysfunction in AD [22], is a common neuromodulatory target, and a relevant network hub [13]. We utilized resting state EEG (rs-EEG) and transcranial magnetic stimulation with EEG (TMS-EEG) to examine functional connectivity and cortical excitability respectively.
To the best of our knowledge this is the first multimodal investigation in AD to utilize resting state EEG and TMS-EEG, and the largest TMS-EEG investigation in this population to date. Our primary hypothesis was that functional connectivity between frontal and parietal electrodes (as measured using scalp EEG) would differentiate participants with mild and moderate AD. We also conducted exploratory analyses to investigate whether the strength of connectivity would be associated with cognitive performance and reduced cortical excitability.
MATERIALS AND METHODS
Participants
Forty participants with AD underwent neurobiological assessments with rs-EEG and TMS-EEG, as well as cognitive assessment. Inclusion criteria included a diagnosis of dementia of the Alzheimer’s type based on general medical, neurological, and neuropsychological examinations according to the National Institute of Neurological and Communication Disorders–Alzheimer’s Disease and Related Disorders Association (NINCDS–ADRDA) [23] criteria for probable AD and the DSM-IVTR clinical criteria for dementia of the Alzheimer’s type [24]. Diagnosis was provided by the referring clinician. Participants were also required to have a score of at least 10 on the Mini-Mental State Evaluation (MMSE) [25], reflecting mild to moderate severity of illness. Participants were excluded if they had a history of any concomitant major and unstable neurological or serious medical conditions (including psychiatric); metal in the cranium, cochlear implant, medication pump or other electronic device; a DSM-IV history of substance abuse or dependence in the last 6 months; a history of seizures; or were pregnant or breastfeeding. Participants were required to either not be on psychotropic medication or their dose of medication be unchanged for a minimum of 4 weeks prior to entry into the study and throughout their involvement. A total of 23 out of 40 participants were on psychotropic medication. Of the 17 participants on monotherapy 14 were taking cholinesterase inhibitors (11 donepezil, 2 galantamine, 1 rivastigmine) and 3 were on memantine. There were 6 participants on polytherapy (1 donepezil + memantine; 1 rivastigmine +memantine; 1 donepezil + citrelopram; 1 donepezil +clonazepam; 1 donepezil + setraline; 1 memantine + duloxetine). Seventeen participants were not taking any psychotropic medication.
Of the 40 participants, 25 had mild AD (MMSE greater than 20), and 15 had moderate AD (MMSE between 10 and 20). See Table 1 for demographic and clinical characteristics. The variables in Table 1 were statistically compared between the mild and moderate groups using independent t tests and chi-square tests (for dichotomous variables). Ethics approval was granted by Monash University and the Alfred Health ethics committees. Written consent was obtained prior to undertaking any study procedures.
Demographics, clinical characteristics, and resting motor thresholds for AD participants (combined and by illness severity).
ADASCog, Alzheimer’s Disease Assessment Scale –Cognition; MMSE, Mini-Mental State Examination; CogState ISL, CogState International Shopping List; AD-QOL, Alzheimer’s Disease Quality of Life; RMT, Resting Motor Threshold.
Protocol
In a single testing session all participants underwent rs-EEG and TMS-EEG; these assessments are described in detail below. With respect to cognitive assessment, all participants completed the MMSE [25], the Alzheimer’s Disease Assessment Scale –Cognition (ADASCog) [26], and the CogState Alzheimer’s Battery [27]. Participants were assigned to mild or moderate severity groups based on their MMSE scores, and hence were not randomly assigned to groups.
Cognitive assessment
The MMSE is a brief cognitive screen for cognitive decline, covering the areas of orientation, attention, working memory, verbal recall, language, and motor skills [25]. The MMSE is scored from 0–30, with lower scores indicating worse performance. The ADASCog is a commonly used cognitive scale to assess severity of symptoms in AD, consisting of 11 tasks across the cognitive domains most often impacted by AD [26]. It is scored from 0–70, with higher scores indicating poorer cognitive performance. Neurophysiological measures were correlated with both the total MMSE and ADASCog scores.
The CogState Alzheimer’s battery is a sensitive computerized battery which has been designed specifically to assess cognitive domains associated with AD, namely processing speed, attention, verbal episodic memory, visual associative learning, and executive functioning [27]. In order to reduce the number of comparisons in the analysis, neurophysiological measures were correlated with verbal episodic memory scores only, as measured in the CogState by the International Shopping List (ISL) task. Episodic memory was chosen as it is a cognitive domain strongly associated with activity in frontal-parietal brain regions [12, 28]; and impairment in episodic memory is a hallmark symptom of AD even in the early stages of the illness [29]. We specifically looked at immediate verbal episodic memory (ISL Trial One) and delayed verbal episodic memory (ISL Delayed Recall).
Neurobiological assessments
Resting state-EEG
EEG data was obtained from a 40-scalp electrode montage in the standard 10–20 positions (Quickcap, Compumedics Ltd., Australia). The cap was positioned such that FPz was positioned at 10%of the distance from the nasion to inion above the nasion. Electrode impedances were regularly checked and kept below 5 kΩ throughout the experiment. EEG signal was amplified (10000x), filtered (DC-3500 Hz) and digitized (10 kHz; Synamps2, Compumedics Ltd.) and recorded on a computer for offline analysis. EEG was recorded while participants were at rest, in both an eyes open (3 min) and eyes closed (3 min) condition. See the Supplementary Material for details of electrodes used, pre-processing and analysis of rs-EEG data.
TMS-EEG
TMS was delivered via a figure-of-eight MagVenture B-65 fluid-cooled coil (MagVenture A/S, Denmark) and stimulator using bi-phasic pulses. Resting motor threshold (RMT) was obtained from the abductor pollicis brevis (APB) muscle and was determined as the stimulus intensity required to evoke a motor evoked potential (MEP) of amplitude ± 50μV in at least five out of ten trials. Single pulse TMS was delivered, concurrent with EEG being recorded, at an intensity of 110%of the RMT (50 pulses, 0.25 Hz plus 10%jitter) over the left dorsolateral prefrontal cortex (DLPFC) as localized using F3 [30]. The TMS coil was positioned at 45° angle relative to midline, with the center of the coil directly over F3. A template of the TMS coil was used to enable reliable positioning throughout delivery of the single pulses. The template outlined the center of the coil as well as denoting 45° angle represented by perpendicular line. Once the template was positioned, the location of the front of the coil was marked on the EEG cap with tape and a whiteboard marker to allow for visual guidance to maintain reliable positioning of the TMS coil throughout delivery of pulses. EEG was recorded in the same manner and with the same parameter settings as with the resting data. During the TMS-EEG recordings white noise was played through headphones to reduce auditory artifacts from the TMS pulses. To minimize the impact of peak variability in individual latencies the average TEP amplitude values were obtained using time windows surrounding the peaks of interest. The time windows chosen for detection of the TEP components were: N40 (25 55 ms), P60 (45–75 ms), N100 (85–145 ms), P200 (190–250 ms). See the Supplementary Material for details of pre-processing and analysis of TMS-EEG data.
Statistical analysis
Statistical analyses were performed using SPSS version 24 (IBM Corp, Armonk, NY, USA) and Fieldtrip [31] (2019) (2010) MATLAB toolboxes. In addition to the analyses described in detail below, due to the medication status of participants (23 AD on stable medication, 17 AD on no medication), medication analyses were also undertaken and are reported in the Supplementary Material. Values that were more than three times the interquartile range below the first quartile or above the third quartile were defined as outliers. In total there were 3 such data points identified—all from separate individuals (1: right frontal-left parietal theta wPLI value for a moderate AD participant; 2: left frontal-left parietal theta wPLI value for a mild AD participant; 3. left frontal-left parietal theta wPLI value for a moderate AD participant). None of these values had a standardized score of greater than ±4. Data was also examined for normality. There were only minor violations of normality and due to their robustness parametric tests were used.
For the primary hypothesis, independent t-tests were used to compare functional connectivity between groups. In response to a reviewer request during the peer review process, we additionally conducted regression analyses to further investigate the contribution of relevant explanatory variables (i.e., age, time since diagnosis, and group [mild, moderate]) on functional connectivity (see the Supplementary Material). For the exploratory hypotheses, a series of correlations were undertaken. Where relevant correlations were run with and without the outlier, the most conservative outcome was reported (which was without the outlier). For our primary hypothesis (the comparison of functional connectivity between the mild and moderate groups), in order to provide a level of control for both family wise error rate and false negatives, we applied a Bonferroni correction, and a significance value of p < 0.0125 (two-tailed) was used, with > 0.0125 and < 0.05 considered a trend. For all exploratory analyses, specifically relationships between functional connectivity, cognition, and cortical excitability, a significance value of p < 0.05 was used.
Behavioral data
I ndependent t-tests were used to compare cognitive performance (i.e., MMSE, ADASCog, and CogState ISL [immediate and delayed recall]) between mild and moderate AD participants.
Neurobiological data
Resting state EEG analysis
Functional Connectivity-Weighted Phase Lagged Index (wPLI). The strength of connectivity between each electrode within the specified frontal regions and the specified parietal regions was computed using the weighted phase lagged index (wPLI) (see the Supplementary Material and Fig. 1 for specified electrode pairs). We deliberately selected a broad set of electrode pairs within the regions of interest to adequately capture the activity spread of underlying regions to a broad area of the scalp. The average connectivity strength between these regions of interest was calculated by taking the mean of the wPLI values for each electrode pair from the frontal and parietal region of interest. Further details of connectivity computations can be found in the Supplementary Material. To address our primary hypothesis, between group differences (mild, moderate) in functional connectivity were analyzed using t-tests in SPSS for connectivity from left-frontal to left-parietal, left-frontal to right-parietal, right-frontal to right-parietal, and right-frontal to left-parietal, separately. As both ipsilateral and contralateral fronto-parietal changes have been seen in AD (e.g., [14, 32]), both ipsilateral and contralateral frontal - parietal scalp electrode pairs were compared. In order to minimize multiple comparisons, we did not additionally look at contralateral frontal-frontal and parietal-parietal scalp electrode pairs as this was not part of our stated aims. Our analyses focused on the wPLI values for the theta frequency band, as for wPLI measures theta differences have been shown to be the most reproducible for volume conduction-corrected phase-based measures in resting state EEG analyses in AD [15]. Where there were no differences between the eyes open and eyes closed conditions, they were combined for statistical analysis.

a) EOIs for right frontal, left frontal, right parietal, and left parietal scalp electrode pairs used for ipsilateral and contralateral (dotted lines) connectivity analyses. b) Difference in theta wPLI for the right frontal–left parietal connectivity as a function of illness severity (p = 0.038). c) Difference in theta wPLI for the left frontal–right parietal connectivity as a function of illness severity (p = 0.042). Note: scale is the same across graphs to allow for comparison. ∧denotes trend level differences.
TMS-EEG
Independent t-tests were also used to compare participants with mild AD to participants with moderate AD in TEP amplitudes (N40, P60, N100, P200) extracted as the averaged values within specified time windows (reported in the Supplementary Material), averaged across Electrodes of Interest (EOI) corresponding to the left prefrontal cortex (electrodes F1, F3, FC1, FC3). We specifically chose the left prefrontal electrodes for the EOI, as opposed to the broader frontal region in the rs-EEG analysis, as it is a common neuromodulatory target, including in AD, thus examining cortical excitability from these electrodes and the relationship to functional connectivity allows for investigation of relevant neurophysiological markers which may related to possible mechanisms of neuromodulatory treatments.
In response to a reviewer’s request, we also conducted non-parametric cluster-based permutation analyses. This approach allows for investigation of global differences across all electrodes, while controlling for multiple comparisons [33]. See the Supplementary Material for additional information.
Correlations
To address our exploratory hypotheses, a priori defined Pearson’s correlations were undertaken. Specifically, correlations were undertaken to investigate the relationship between, (1) strength of functional connectivity and symptom severity, and (2) the strength of functional connectivity and cortical activity recorded from electrodes over the prefrontal cortex. Correlations were run using the averaged wPLI connectivity values for left-frontal to left-parietal and right-frontal to right-parietal scalp electrode pairs separately, peak EOI TEP amplitudes, MMSE, ADASCog, and CogState ISL scores. In order to restrict the number of correlations, we only conducted these exploratory correlational analyses where strength of functional connectivity was able to differentiate the two groups (i.e., mild versus moderate) at least at the p < 0.05 level. As the correlational analyses were part of our exploratory hypothesis, a significance level of p < 0.05 was set.
RESULTS
Data from a total of 40 participants with AD (25 mild severity, 15 moderate severity) were analyzed. Cognitive data was available for all 40 participants, as was resting state EEG data. TMS-EEG data was available for 35 participants (data from 5 participants [2 mild, 3 moderate] was of too poor quality to include). Medication analyses showed no significant differences across any of our neurobiological outcome variables when participants were compared based on medication status; these analyses are provided in the Supplementary Material.
Cognition
Means and standard deviations for performances on the cognitive tasks are provided in Table 1. Performances were compared across severity groupings and as expected independent t-tests showed those with mild AD performed significantly better compared to moderate AD: MMSE (t (38) = 11.74, p < 0.001), ADAS- Cog (t (38) = –8.71, p < 0.001), and CogState ISL: (Trial One: t (38) = 5.35, p < 0.001; Delayed Recall: t (38) = 3.77, p = 0.001).
Resting state-EEG
Functional connectivity: Group differences
As there were no differences between resting eyes open and eyes closed connectivity for the electrode pairs of interest (p > 0.50, see the Supplementary Material), the conditions were combined.
In individuals with moderate AD the strength of contralateral theta functional connectivity, between frontal and parietal scalp electrodes compared to mild AD did not reach statistical significance (right frontal-left parietal: t (38) = 2.146, p = 0.038, d =0.731; left frontal-right parietal: t (38) = 2.102, p =0.042, d = 0.686), see Fig. 1. For the ipsilateral theta connectivity comparisons both p-values were above 0.05 (left [t (38) = 0.667, p = 0.509] or right [t (38) =1.915, p = 0.063] hemisphere).
Functional connectivity: Correlations with cognition
Correlations were conducted between cognition and the strength of theta connectivity for the contralateral frontal and parietal electrode pairings only (as these differentiated the two groups at least at the p < 0.05 level and with moderate to large effect sizes). wPLI theta values for electrodes over left frontal-right parietal regions were significantly associated with immediate episodic verbal memory (CogState ISL Trial 1: r = –0.314, n = 40, p = 0.048); where greater connectivity was associated with worse cognitive performance. See Fig. 2.

Correlation between wPLI values for left frontal–right parietal theta connectivity and immediate verbal episodic memory (i.e., CogState International Shopping List Trial One): r = –0.314, n = 40, p = 0.048. *denotes significance.
The correlation between connectivity values in electrodes over left frontal-right parietal regions and the MMSE (r = –0.300, n = 40, p = 0.060) trended towards significance, again with greater connectivity associated with reduced cognitive performance. The correlations between connectivity and ADASCog (r = 0.282, n = 40, p = 0.078) and CogState delayed recall (r = –0.161, n = 40, p = 0.320) were non-significant. There were no significant correlations between right frontal-left parietal theta connectivity and cognitive performance when the extreme outlier (right frontal-left parietal theta wPLI value) was removed (MMSE: r = –0.255, n = 39, p = 0.117; ADASCog: r = 0.205, n = 39, p = 0.210; CogState Trial 1: r = –0.229, n = 39, p = 0.161; CogState Delayed Recall: r = –0.142, n = 39, p = 0.387).
TMS-EEG
TMS-evoked potentials: Group differences
The TEP waveform generated following stimulation over the left DLPFC is shown in Fig. 3, with the four peaks of interest (N40, P60, N100, P200) highlighted. See the Supplementary Material for information on the Signal-to-Noise Ratio (SNR) of the data. The EOI analysis showed no significant differences between those with mild and moderate AD for any of the TEP amplitudes (See Table 2). Non-parametric cluster-based analyses also showed no significant differences in TEP amplitudes between the two groups.
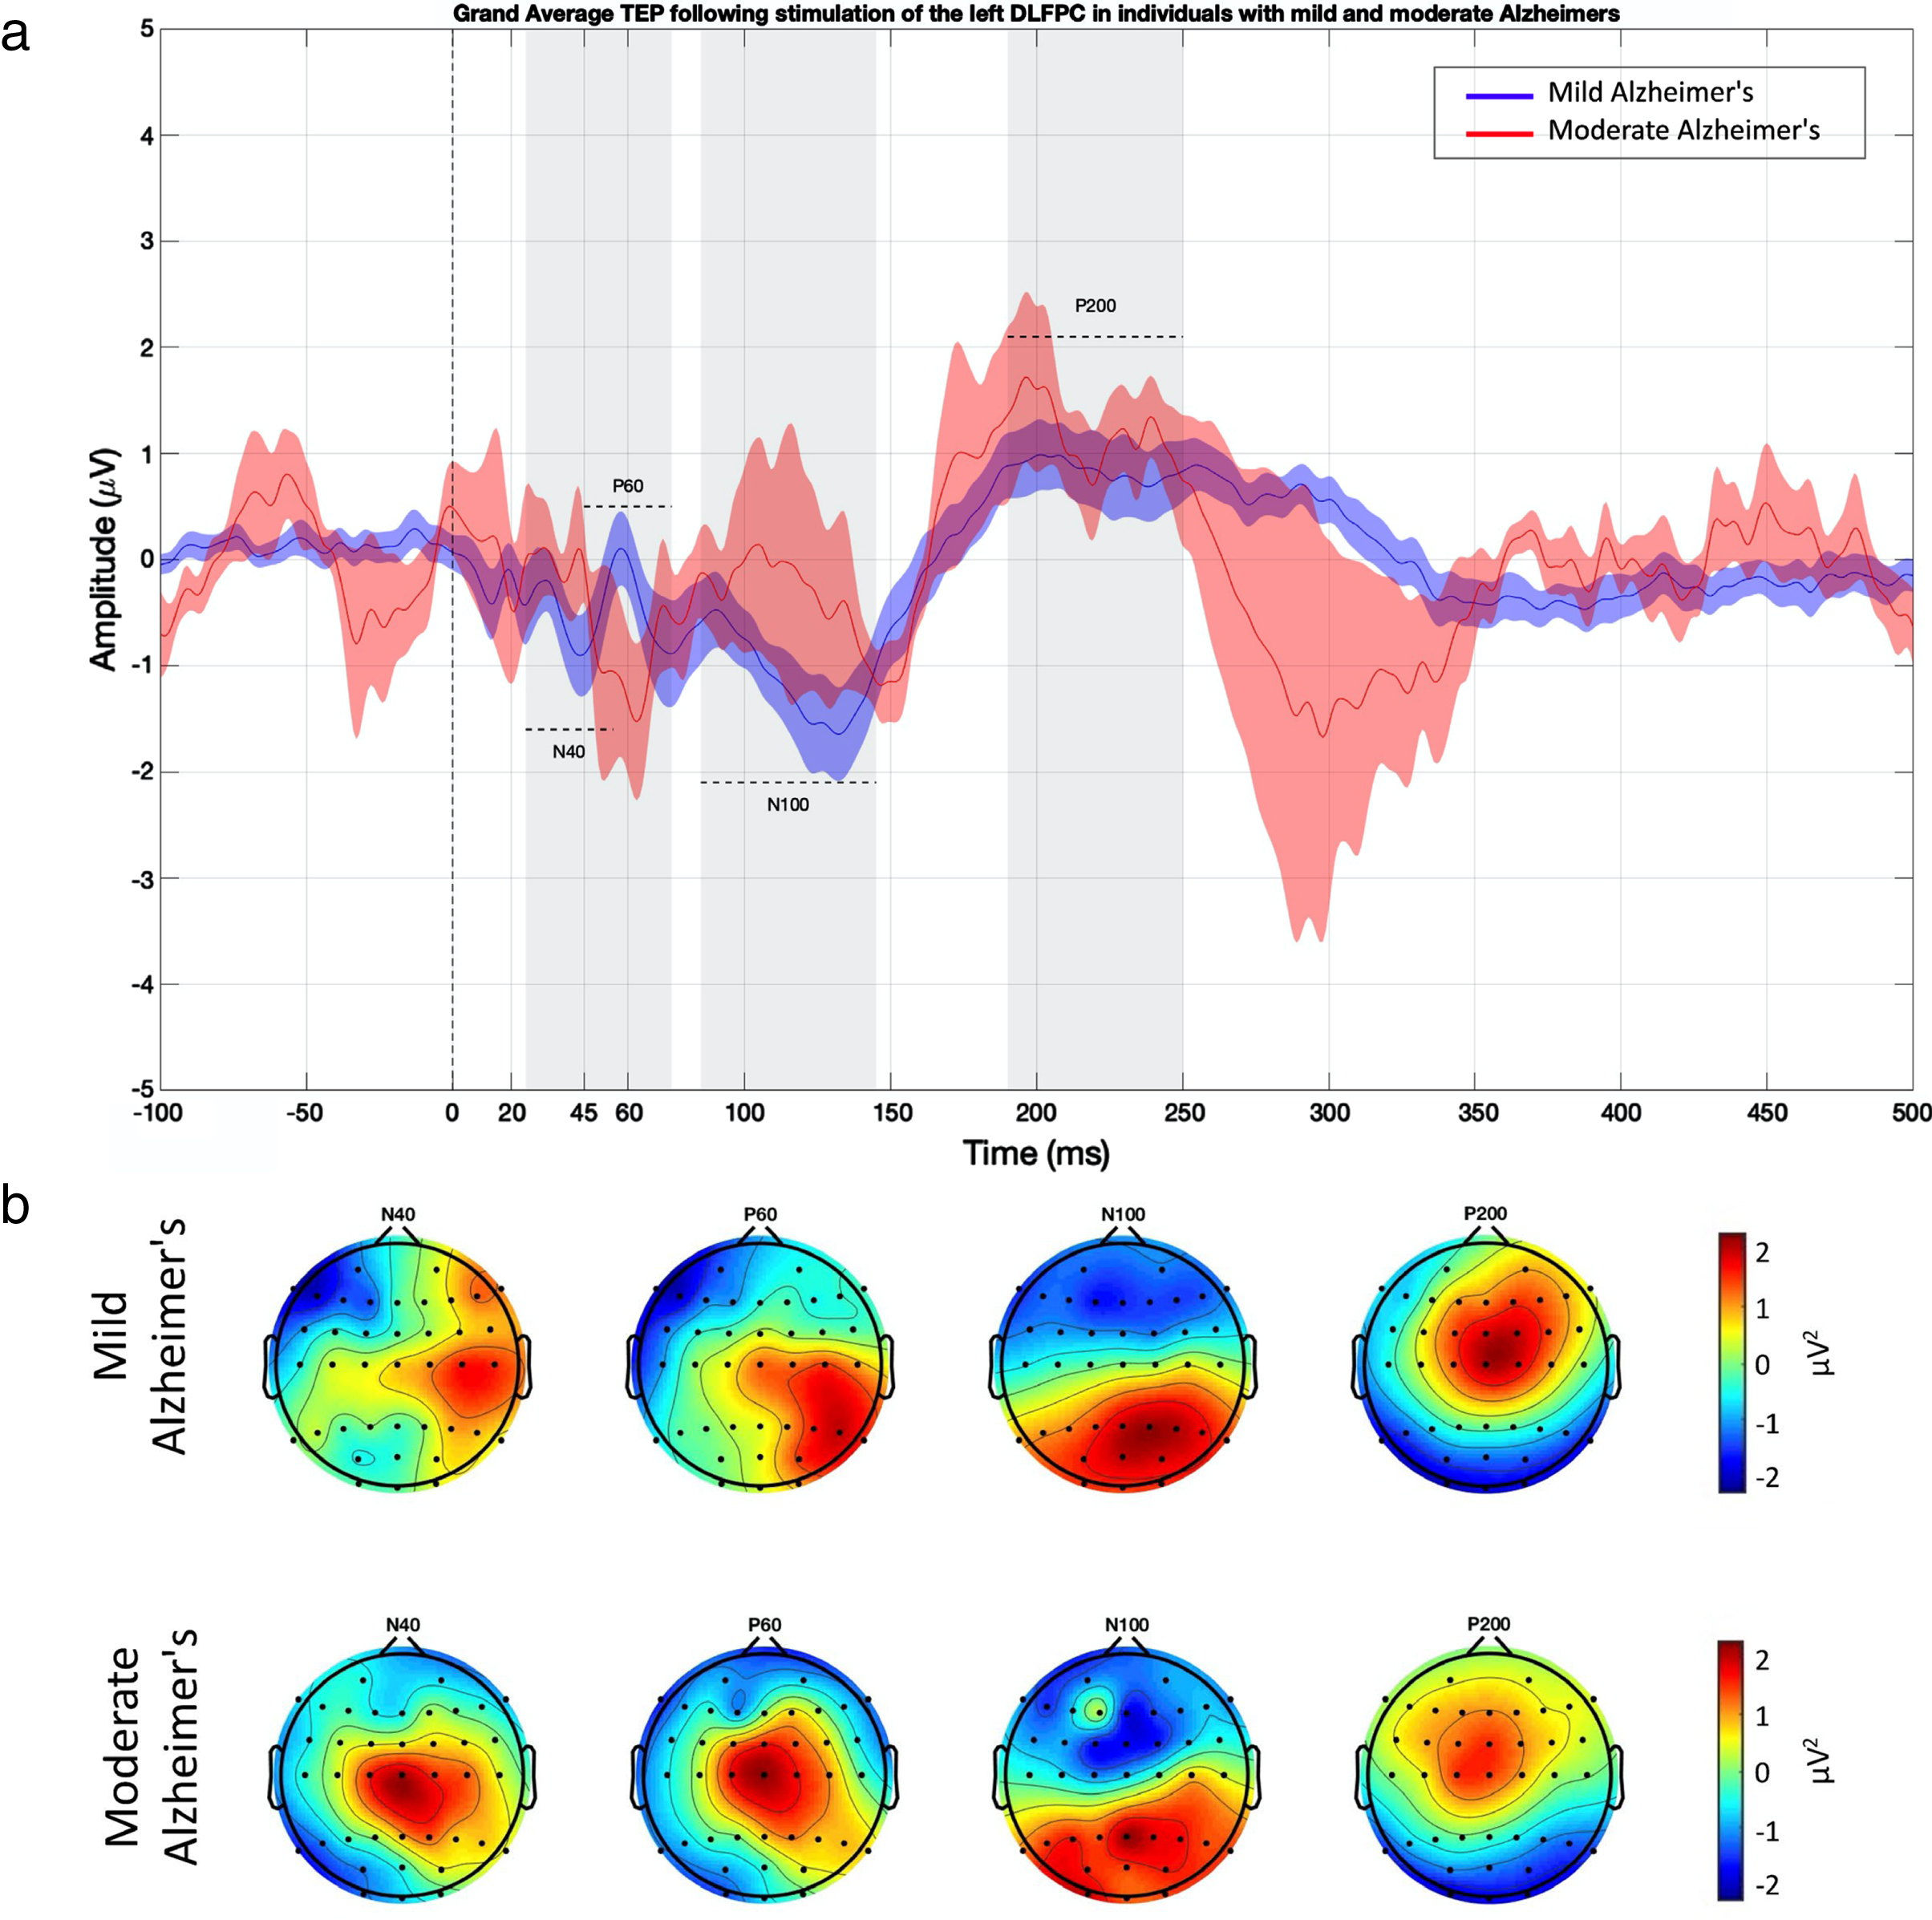
TMS-evoked potentials (TEPs) elicited following stimulation over the DLPFC. a) TEPs for left DLPFC EOI (shown for each group). b) Voltage for each of the TEP peaks (shown for each group). See the Supplementary Material for Butterfly Plots.
Means and standard deviations of TEP amplitudes as a function of illness severity
TMS-evoked potentials: Correlations with functional connectivity
Again, correlations were conducted between TEP amplitudes and the strength of theta connectivity for the contralateral frontal and parietal electrode pairings only (as these differentiated the two groups at least at the p < 0.05 level and with moderate to large effect sizes). The participant with the outlier connectivity value identified above did not undergo TMS-EEG assessments, therefore there was no requirement for outlier removal.
Right frontal-left parietal theta wPLI values correlated significantly with N100 amplitude (r = 0.374, n = 35, p = 0.027); while left frontal- right parietal theta wPLI values correlated significantly with P60 amplitude (r = –0.396, n = 35, p = 0.018). Both correlations indicate that reduced TEP amplitude is associated with enhanced theta connectivity (see Fig. 4).
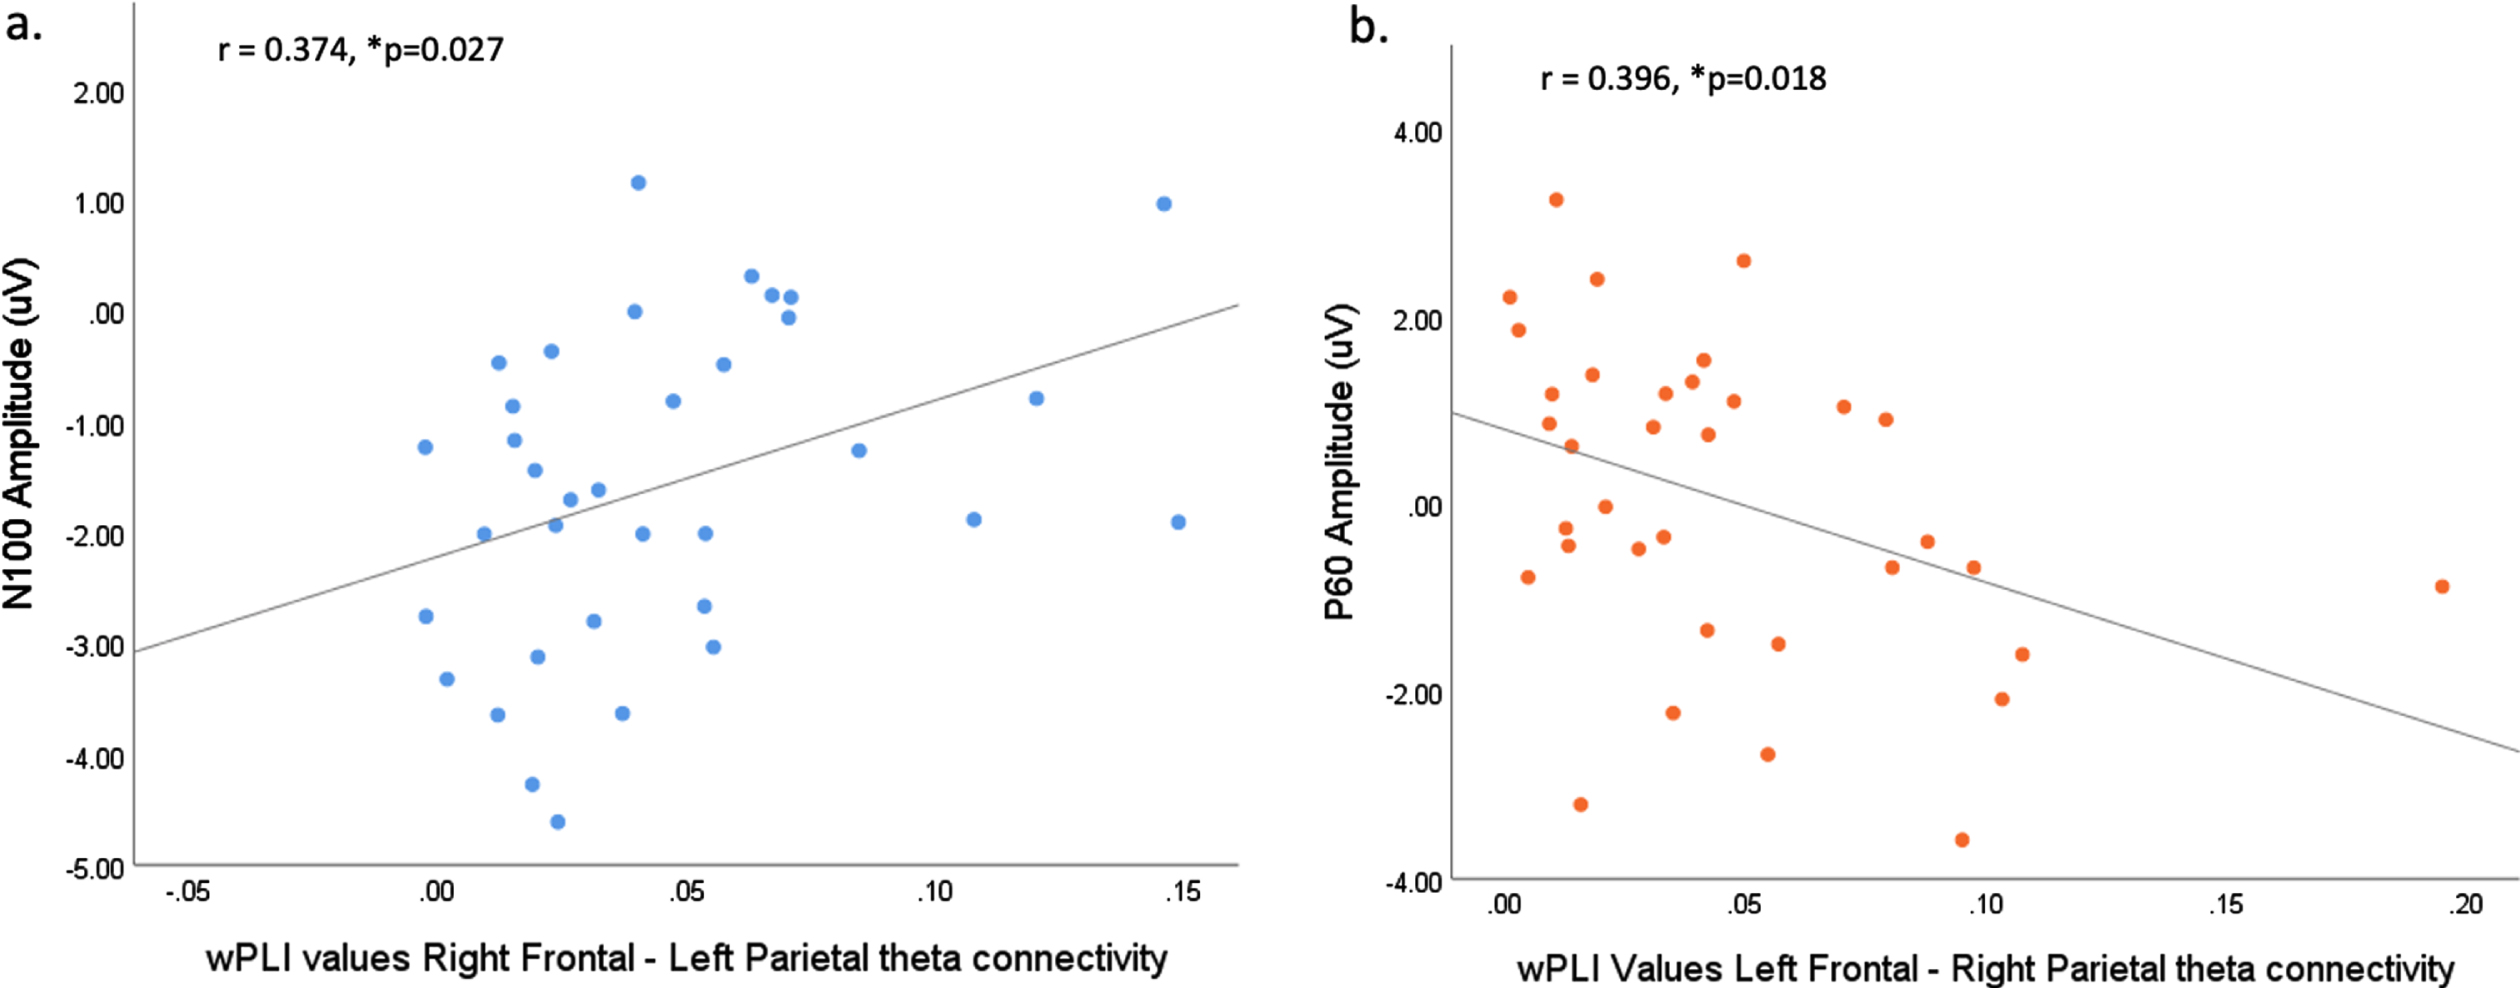
a) Correlation between wPLI values for right frontal–left parietal theta connectivity and N100 amplitude (r = 0.374, n = 35, p = 0.027). b) Correlation between wPLI values for left frontal–right parietal theta connectivity and P60 amplitude (r = –0.396, n = 35, p = 0.018). *denotes significance.
All other correlations were non-significant. Namely, between left frontal-right parietal connectivity and N40 (r = –0.162, n = 35, p = 0.352), N100 (r = 0.188, n = 35, p = 0.280), and P200 (r = –0.038, n = 35, p = 0.829). And between right frontal –left parietal connectivity and N40 (r = 0.070, n = 35, p = 0.689), P60 (r = –0.121, n = 35, p = 0.490), and P200 (r = –0.168, n = 35, p = 0.335).
DISCUSSION
The current study investigated associations between functional theta connectivity between scalp electrodes over frontal and parietal regions and symptom severity, and between this functional connectivity and cortical excitability, in participants with AD. Strength of connectivity was found to be negatively correlated with immediate episodic verbal memory for all participants, indicating that increased theta connectivity was associated with poorer episodic memory performance in AD. There were no differences in any of the TMS-evoked potentials (TEPs) amplitudes between moderate and mild AD. However, there were significant correlations between TEP amplitudes and strength of functional connectivity. Namely, left frontal-right parietal theta connectivity was significantly negatively correlated with P60 amplitude, while right frontal-left parietal theta connectivity was significantly positively correlated with N100 amplitude. As discussed below, the P60 and N100 are believed to represent different physiological mechanisms which are likely generated from divergent cortical regions; such variation may explain the differing correlations with functional connectivity. However, both correlations do suggest that greater connectivity is associated with reduced cortical activity (i.e., a smaller P60 and N100). As all of the significant results were found in our exploratory analyses these results should be interpreted with caution, however there are a number of potential insights from this research which can inform future research into the identification of alternative treatment targets for AD.
It is important to note here that the TMS-EEG field is continuing to evolve and develop and so TMS-EEG findings, and in particular TEPs, can be challenging to interpret [34]. In particular, the N100 is commonly thought to reflect GABAB mediated inhibition [35–37] and has been demonstrated to contain transcranially evoked cortical responses [38–39] but is also influenced by auditory and somatosensory processing [40]. As such, caution should be applied when considering the implications of our results, as it is possible that the N100 effects detected in our results are related to the auditory or somatosensory aspects of the N100 rather than cortical reactivity to the TMS pulse. There is a lack of consensus with respect to what could be driving the other responses, including the P60 (although there is growing evidence it may be related to excitatory mechanisms such as N-methyl-D-aspartate and/or glutamate activity [41, 42]). With respect to the spatio-temporal distribution of TEPs following DLPFC stimulation, the earliest peak (N40) generally occurs in the area of the stimulated electrodes. Peak distribution for the P60 is generally found over more central and contralateral frontal regions, with more bilateral central peak activations typically found for the N100 and P200 [43]. Therefore it is likely that the N100 and P60 components in the current study were influenced by cortical regions beyond the stimulation site and cannot be considered solely reflective of reduced prefrontal cortical activity [43, 44]. Indeed, there is growing research to suggest that the N100 may reflect a more generalized marker of cortical inhibition across the cortex [43–45]. With full acknowledgement of the challenges of, and ongoing research into, TEP interpretation the current findings indicate that following left prefrontal cortex stimulation in AD, less cortical activity (i.e., indexed via the N100, and P60) is significantly associated with greater theta connectivity between frontal and parietal electrode pairs.
The findings presented here of greater functional connectivity in more advanced AD presentations (i.e., moderate AD) of a moderate to large effect size (d = 0.713–0.686, p < 0.05), is consistent with the growing body of research positioning AD as a disorder of connectivity [7–12, 46–48]. Unfortunately, this result did not pass the threshold we set for significance, which we set as more stringent than the typical p < 0.05 due to the number of multiple controls. However, given the moderate effect size with our small sample and stringent statistical threshold, and the alignment with previous research, we consider the result as important to report as it informs suggestions for future research exploring the result more directly. EEG resting state connectivity studies have reported both increases and decreases in functional connectivity in AD [15, 17–19]. In a recent large reproducibility study Briels et al. (2020) found that for volume-corrected phase-based measures such as the wPLI increased theta connectivity was the most reproducible finding (consistent with results of the current study) [15]. Previous studies have also shown associations between enhanced connectivity and increased symptom severity [14], as was found in the current study; specifically, the current study showed an association between theta connectivity and episodic memory which was expected as episodic memory is strongly associated with activity in frontal-parietal brain regions [12, 28]. While the mechanisms underlying hypersynchrony in AD is unclear, it has been suggested that it may be the result of impaired inhibitory interneuron function and damaged excitatory-inhibitory balance particularly between anterior and posterior regions [10, 49]. This is supported by the TEP findings in the current study, whereby following left prefrontal cortex stimulation in AD, smaller P60 amplitudes (posited measure of cortical excitation) and smaller N100 amplitudes (posited measure of cortical inhibition) were both significantly associated with greater theta connectivity between frontal and parietal electrode pairs.
Greater functional theta connectivity in particular has been previously reported in AD [15]. Theta has been shown to co-ordinate interareal communication throughout the brain during cognitive processing, with a recent study suggesting tightly controlled theta connectivity between and within the FPN and DMN is a central mechanism underlying key cognitive processes including internally directed attention, autobiographical memory retrieval, cognitive control, and goal directed attention [50]. Greater resting theta connectivity is potentially suggestive of reduced control of oscillatory activity within these cognitive critical networks. The significant association seen in the current study between theta connectivity and symptom severity, namely episodic memory, further supports this.
The current findings offer novel initial support to an emerging theory of cognitive symptom presentation in AD, and in doing so suggests a potential therapeutic target which is both proximate to cognitive symptoms and highly amenable to intervention. Specifically, the associations between increased connectivity and cognitive symptom severity and between increased connectivity and reduced cortical activity provides experimental support for targeting impaired cortical activity in an attempt to restore healthy connectivity and improve cognitive function [20, 49]. Such an approach was recently tested in a computational model of AD degeneration, where the authors sought to identify the most effective intervention strategy to maintain network integrity. They found that the most successful approach was the selective stimulation of excitatory neurons [49]. The authors concluded that network damage due to pathological cortical activity could be opposed via ‘targeted adjustment of neuronal excitability levels’ [49]. Targeted modulation of neuronal activity can be achieved by a number of techniques including brain stimulation approaches. From optogenetics to non-invasive brain stimulation (i.e., transcranial magnetic stimulation, transcranial alternating current stimulation), these techniques have been shown to be relatively focal, effective in modulating the relevant brain activity and, with respect to non-invasive forms of brain stimulation, have a decidedly low side effect profile [21]. Following robust replication of the current results in larger samples, interrogation of identified potential therapeutic targets using these neuromodulatory approaches, including comprehensive assessment of target engagement and clinical relevance, would be a crucial next step for their therapeutic development.
The findings of the current study should be interpreted in light of the following methodological considerations. Firstly, it is critical to interpret the TEP findings with caution. While there has been progress recently with respect to determining what TEP findings represent, this area is still in its infancy which must be taken into account when interpreting these results. Additionally, in the absence of source localization it is possible that the signal from the scalp electrodes used over the frontal and parietal regions could reflect activity from distant regions; however, their main contributions are more likely to be generators underlying the specific region [51]. We only used 50 pulses for the TMS-EEG protocol, and a higher quality of data may have been achievable had we used a higher number of pulses. However, this specific protocol was deliberately designed to ensure tolerability of the length of the experimental session as a whole and SNR analysis showed acceptable ratios for the most part (with the exception of the P60) consistent with past research [52–53]. The SNR for the P60 TEP for the moderate AD group did show reduced signal to noise and thus these results should be interpreted with caution in this regard. In addition, while this study is, to the best of our knowledge, the largest multimodal investigation in AD to utilize both resting state-EEG and TMS-EEG, the sample size of 40 can still be considered statistically small. In light of this, and the non-randomized nature of the study, there is the risk of confounding bias. While we took steps to examine potential confounding factors via regression analysis, this may not have been sufficient. Further investigations in larger samples where the study design controls for the risk of confounding variables would increase confidence in these initial findings. Finally, we localized the left DLPFC for the TMS-EEG protocol using F3 rather than neuronavigation. While F3 has been shown to provide an accurate representation of the left DLPFC for this purpose [30], whenever possible neuronavigation, should be utilized.
Here we provide initial experimental evidence of the utility of a multimodal neurophysiological approach for the identification of potential therapeutic targets which are proximate to the cognitive symptoms of AD. In recent times the vast majority of interventional trials have been focused on reducing amyloid burden, with very few approaches focused on directly improving neural function through modulating connectivity. The lack of success of traditional approaches, coupled with the strong evidence for AD being a disorder of connectivity, requires a broadening of focus. Replication of these findings and interrogation of novel neurophysiological targets to determine target engagement and clinical relevance is a critical step in the development of novel therapeutics for AD.
Footnotes
ACKNOWLEDGMENTS
KEH was supported by NHMRC Fellowships (1082894 and 1135558). PBF was supported by a Practitioner Fellowship grant from the National Health and Medical Research Council (NHMRC) (1078567). This research was supported by project funding from the NHMRC (1135558), the Mason Foundation (MAS2015F011 & MAS2017F003) and State Trustees Australia Foundation (STAF-MR-2018-01).