
Abstract
Background:
Few studies have investigated associations between types of clock drawing test (CDT) errors and cognitive impairment.
Objective:
To explore associations of qualitative errors in the CDT with comprehensive neurocognitive assessment scores and clinical diagnosis.
Methods:
Outpatients at a memory clinic were enrolled. Frequencies of errors determined by Cahn’s method were explored according to cognitive status (cognitively normal [CN] (n = 279), mild cognitive impairment [MCI] (n = 321), and Alzheimer’s disease [AD]) (n = 575). Neuropsychological assessment scores were compared between participants with and without errors.
Results:
Stimulus-bound response (SB) was relatively rare (6.8%) in the CN group but was markedly more common in the MCI (23.4%) and AD (33.2%) groups. Conceptual deficit (CD) was found in more than 20%of CN individuals, as well as about 50%of AD patients. Planning deficit (PD) frequencies were relatively similar among the groups. SB in both of CN and MCI individuals, and CD in both of CN and MCI individuals were associated with lower scores in several neuropsychological assessments. Meanwhile, PD was not associated with lower assessment scores in any of CN, MCI, or AD individuals.
Conclusion:
The frequencies of SB and CD increased from CN, MCI, to AD but showed somewhat different patterns. Both SB and CD were associated with lower cognition in all three cognitive stages.
Keywords
INTRODUCTION
The clock drawing test (CDT) is widely used for cognitive assessment and has been shown to have reasonable test performance in screening for cognitive impairment [1]. It is quick and easy to administer in both clinical and community settings and does not require any special equipment. Several different brain systems are considered to be simultaneously activated during the clock drawing task, including the frontal, temporal, and parietal lobes. The CDT thus has the potential to evaluate different cognitive domains, including attention, memory, and executive function [2, 3]. Accordingly, the CDT is considered useful for assessing multiple cognitive domains.
Over the years, many scoring systems for the CDT have been developed [4]. However, there is no consensus on which scoring systems are superior for clinical or research use. Although different classifications of scoring systems have been proposed, the distinction between quantitative and qualitative aspects is an important point differentiating many scoring systems for the CDT. Quantitative scoring assesses the drawing of the clock with a numerical scale, whereas qualitative systems are based on evaluating characteristic errors [5]. While quantitative methods are easy to administer, qualitative methods are somewhat time-consuming [5]. However, several studies have shown that qualitative scoring systems have advantages in the differential diagnosis of dementia [6] or in its early detection [7]. A recent study also reported that qualitative assessment increased the validity of the CDT in screening for cognitive impairment in mild ischemic stroke [8].
Moreover, we previously reported that detection of a certain type of error (conceptual deficit [CD]) helped to predict progression to dementia from non-demented status [9]. The identification of error in CDT may help to characterize the cognitive profile of the subjects who made the error possibly independently from scoring of CDT.
Nonetheless, few studies have investigated associations between the type of error in the CDT and cognitive impairment. If we know that certain errors correspond to certain cognitive deficits, it would be helpful in using the CDT to evaluate individuals’ cognitive impairment, which may contribute to the differential diagnosis of dementia types or possibly predict the trajectories of cognitive function.
The objective of the current study was to investigate the cognitive characteristics of individuals with qualitative errors in CDT according to different cognitive status. It would help to characterize the cognitive profiles of those with errors in CDT. We cross-sectionally compared the scores of neuropsychological assessments with or without qualitative errors in the CDT in individuals with normal cognition (CN), mild cognitive impairment (MCI), and Alzheimer’s disease (AD), who visited a memory clinic.
METHODS
Participants
We enrolled a total of 1,175 consecutive patients who underwent cognitive assessments between January 2015 and December 2019 in the outpatient memory clinic of the geriatric department in Nagoya University Hospital. Data were retrospectively collected from medical charts. The study protocol was thoroughly reviewed before being approved by the Ethics Committee of Nagoya University Graduate School of Medicine (2020–0071).
Neuropsychological assessments
Three experienced clinical neuropsychologists performed a battery of neuropsychological assessments. The assessments involved the following tests: General cognition: The Mini-Mental State Examination (MMSE) [10] and the Alzheimer’s Disease Assessment Scale (ADAS) for general cognitive function [11]; Memory: The Logical Memory I and II subtests of the Wechsler Memory Scale-Revised (WMS-R) for immediate and delayed memory function, respectively [12]; Verbal fluency: Categorical (animal names) and letter fluency for verbal fluency; Working memory: The Digit Span subtest (forward and backward) of the WMS-R; Processing speed: The Digit Symbol subtest of the Wechsler Adult Intelligence Scale-III (WAIS-III) [13]; Frontal lobe function: The Frontal Assessment Battery (FAB) was used to assess frontal lobe function, [14]; Executive function: Trail Making Test (TMT) parts A and B [15] and the Stroop test [16] The time differences between TMT-A and -B and color and letter reading in the Stroop test were used in the analysis.
Clock drawing test
Three neuropsychologists administered the CDT. A blank piece of paper was provided to the participants and they were instructed to draw a clock as follows: “First, draw a clock face with a 10 cm diameter, and then write all of the numbers on it. Second, draw hands on the clock so that the clock reads 10 past 11.” The psychologists scored the drawn clocks using the method developed by Cahn et al. [17]. In Cahn’s scoring method, both quantitative scores and qualitative scores are assessed independently. Quantitative scores are obtained from three components: integrity of the clock face (0–2 points), presence and sequencing of the numbers (0–4 points), and presence and sequencing of the hands (0–4 points). The qualitative scores considered eight types of different errors. Total scores were calculated by subtracting qualitative scores from the quantitative score, which had a full score of 10, with higher scores indicating better performance. The Cronbach alpha for the three independent raters was 0.980.
The eight error types were as follows. Stimulus-bound response (SB): the tendency of the drawing to be dominated or guided by a single stimulus. Conceptual deficit (CD): this error type reflects a loss or deficit in accessing knowledge of the attributes, features, and meaning of a clock. Perseveration: the continuation or recurrence of activity without an appropriate stimulus. Neglect of left hemispace: all attributes of the clock are written on the right half of the clock face. Planning deficit (PD): this error type is represented by gaps before 12, 3, 6, or 9. Nonspecific spatial error: a deficit in the spatial layout of numbers, without any specific pattern in the spatial disorganization. Numbers written on the outside of the clock: numbers written either around the perimeter of the circle or the circle itself. Numbers written counterclockwise: arrangement of the numbers with “12” at the top of the clock face and then continuing around in a counterclockwise fashion.
AD and MCI diagnosis
AD was diagnosed according to the Diagnostic and Statistical Manual of Mental Disorders, Fifth Edition [18] by attending geriatricians considering medical histories and neuropsychological performance, and two independent dementia experts (HU and YS) checked the diagnosis. When inconsistencies in diagnosis occurred, two experts and attending geriatricians discussed to determine the diagnosis. Participants who did not satisfy these criteria were assigned to the non-demented group for analysis; the non-demented group comprised CN and MCI individuals. Petersen’s criteria were used to diagnose MCI [19]. The numbers of the involved individuals were 279, 321, and 575 for NC, MCI, and AD, respectively.
Statistical analysis
The backgrounds (age, years of education, and sex) were compared with or without each type of errors frequently found (SB, CD, and PD) within each group of cognitive status (CN, MCI, and AD). Age and educational years were compared by Student’s t-test, whereas sex distribution was compared by the chi-square test. Similarly, within each group (CN, MCI, and AD) cognitive performance was compared between participants who demonstrated errors on the clock drawing test and those who did not.Student’s t-test was used when there were no statistically significant differences in age, sex, and years of education and when statistical significance (p < 0.05) was present in age, sex, and years of education, analysis of covariance with adjustment for significantly different factors was used for the comparison. Specifically, the scores of cognitive assessments in NC with or without CD were compared with ANCOVA adjusted with age and education, and those in MCI with or without SB were with ANCOVA adjusted with age.
Effect size (Cohen’s d for Student T and η2 for ANCOVA) was calculated.
Multiple regression analysis was used to analyze the association between the error and MCI diagnosis.
RESULTS
Three types of errors—SB, CD, and PD—were more prevalent than the other types. SB was only found in 6.8%of the CN group but showed frequencies of 23.4%in the MCI group and 33.2%in the AD group. CD was found in 22.2%, 31.5%, and 47.3%of the CN, MCI, and AD groups. About 30%of each of the CN, MCI, and AD groups made PD-type errors (Fig. 1). The frequencies of both SB and CD significantly differed among the CN, MCI, and AD groups (p < 0.001), but no significant differences were found in PD prevalence among the three groups (p = 0.802). PR was found in 1.1%, 2.5%, and 5.8%of CN, MCI, and AD, respectively. No individuals in CN and MCI made NL type and CC type errors, but 1 (0.2%) and 4 (0.7%) individuals made these types of error in AD, respectively. NS was found in 4.7%, 5.9%, and 9.1%of CN, MCI, and AD, respectively. OC type of error was found in 4.3%of CN, 10.6%of MCI, and 9.2%of AD individuals.
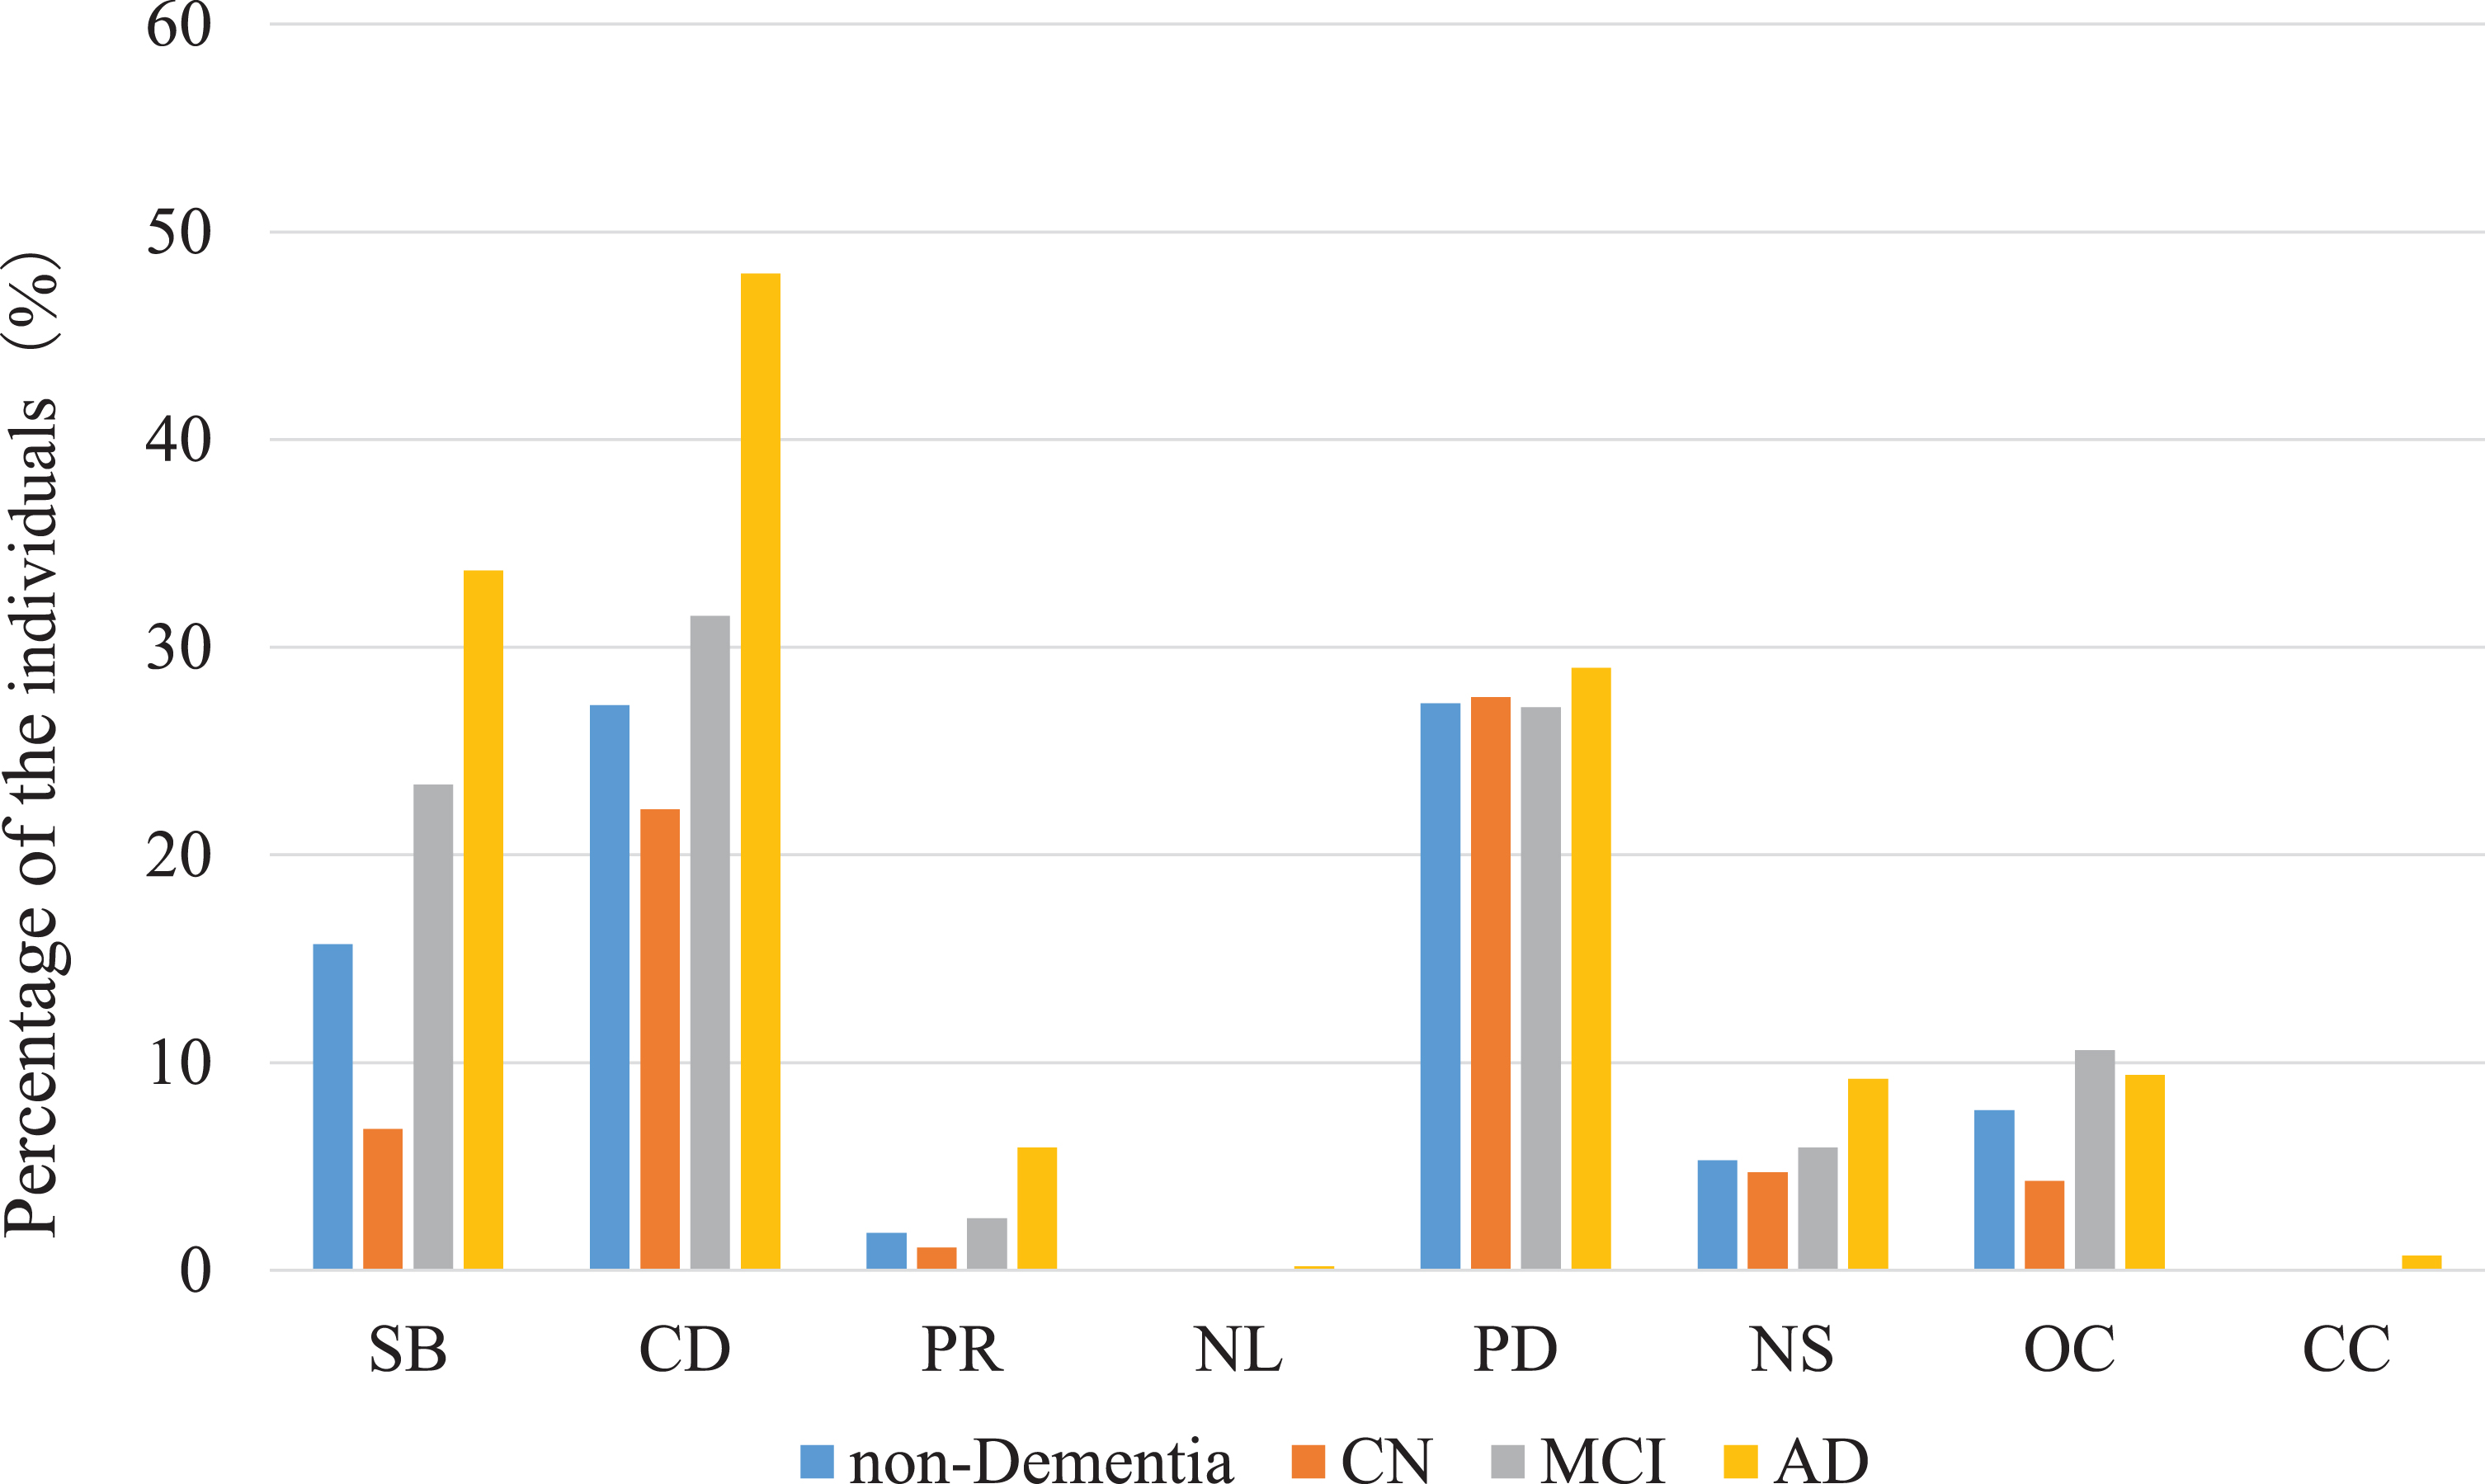
Distribution of error types SB, stimulus-bound response; CD, conceptual deficit; PR, perseveration; NL, neglect of left hemispace; PD, planning deficit; NS, nonspecific spatial error; OC, numbers written on the outside of the clock; CC, numbers written counterclockwise.
Individuals who exhibited both SB and CD tended to have lower scores in several cognitive assessments in CN (Table 1) and MCI (Table 2) groups. Those who had CD type error had lower performance in CDT. The differences between those with and without SB reached statistical significance in immediate and delayed memory, category and initial fluency, digit span, and FAB in CN (Table 1), and CDT, immediate memory, digit span, and ADAS in MCI (Table 2). Those who had CD type error had lower performance in CDT, immediate memory, and ADAS in CN (Table 1), and CDT, immediate memory, digit symbol, and Stroop in MCI (Table 2). Meanwhile, PD in both of CN and MCI individuals was not associated with lower scores on any of the tests performed in this study except clock drawing test score (Tables 1 2). The results of combined analysis of CN and MCI (non-demented) were shown in Supplementary Table 1. Both SB and CD were associated with lower scores in a wide range of cognitive assessments in non-demented individuals.
Demographic characteristics and assessment results of cognitively normal
CDT, clock drawing test; TMT, Trail Making Test; FAB, Frontal Assessment Battery; ADAS, Alzheimer’s Disease Assessment Scale; MMSE, Mini-Mental State Examination.
Demographic characteristics and assessment results of mild cognitive impairment
*p < 0.05, **p < 0.001. CDT, clock drawing test; TMT, Trail Making Test; FAB, Frontal Assessment Battery; ADAS, Alzheimer’s Disease Assessment Scale; MMSE, Mini-Mental State Examination
In AD, SB was associated with lower scores in the digit symbol, TMT, and FAB assessments, whereas CD was associated with lower scores on more assessments, including memory assessments (CDT, category and initial fluency, digit span, digit symbol, FAB, ADAS, and MMSE). PD was associated with only the assessment score for immediate memory (Table 3).
Demographic characteristics and assessment results of demented
*p < 0.05, **p < 0.01 CDT, clock drawing test; TMT, Trail Making Test; FAB, Frontal Assessment Battery; ADAS, Alzheimer’s Disease Assessment Scale; MMSE, Mini-Mental State Examination.
The results of multiple logistic regression analysis performed to investigate the associations of error types with MCI diagnosis in non-demented individuals are shown in Table 3. Only SB-type error was associated with a diagnosis of MCI in both statistical models (model 1 was adjusted with age, sex, years of education, and MMSE, whereas ADAS was applied instead of the MMSE in model 2) (Table 4).
Multiple logistic regression analysis of MCI diagnosis in non-demented individuals
SB, stimulus-bound response; CD, conceptual deficit; PD, planning deficit Model 1: age, sex, education, MMSE Model 2: age, sex, education, ADAS.
DISCUSSION
In this study, we explored the frequencies of each type of CDT error based on Cahn’s scoring system in the CN, MCI, and AD groups and the associations between error types and cognitive functional deficits in the non-demented (CN and MCI) and AD groups. Overall, SB, CD, and PD were frequently found. The frequency of SB-type error was relatively low (6.8%) in the CN group but was much higher in the MCI (23.4%) and AD (33.2%) groups. Moreover, CD was found in more than 20%of even CN individuals, as well as in about half of AD patients. The frequencies of PD were relatively similar among the groups. Both SB and CD were associated with a wide variety of impairments in neuropsychological assessments in non-demented individuals. However, more assessments in AD patients were associated with CD than with SB. PD was not associated with lower test scores in either the non-demented or AD groups.
SB is defined as a tendency for the clock drawing to be dominated by a single stimulus, generally involving the minute hand pointing to 10 instead of 2. This may be interpreted as the strong stimulus of the “10” being dominant over the “2” and may be due to the need for more complex operations for executive function [20]. Ryan et al. reported that SB was found in 3.0%of non-demented individuals and in 30.9%of AD individuals [21]. We found that the frequency of SB increased from 6.8%in the CN group to 33.7%in the AD group.
We found significantly poorer cognitive performance in a variety of cognitive domains in non-demented individuals with the SB-type, especially in NC. Moreover, SB was relatively rare in the CN group and increased its frequency in MCI or AD, as stated above, and its prevalence was significantly associated with a diagnosis of MCI in non-demented individuals. Therefore, SB-type error in the non-demented population can suggest the presence of a slightly poorer cognitive performance or MCI status, and this finding may be useful in clinical settings. In AD individuals SB was associated with only lower processing speed. Duro et al. reported that SB is a hallmark of AD versus frontotemporal dementia and Parkinson’s disease with dementia [22]; however, current results showed that CD was more frequent and associated with poor cognition performance in more tests than SB in AD individuals was.
CD is defined as a loss of knowledge of clock features and meaning. This type of error is considered to stem from semantic memory impairment, which is usually associated with lateral temporal lobe dysfunction [23]. Rouleau et al. reported that the frequency of CD increased with AD progression, unlike that of SB [24], with Lee et al. also reporting similar tendencies [25]. In the present study, we compared the different stages of cognitive status cross-sectionally and found that CD was often found even in the CN group (27.2%), as well as in 31.5%of the MCI group and in 48.1%of the AD group.
CD was associated with lower scores in some cognitive assessments in NC and MCI, and wide-range of cognitive domains in AD in the present study. A review concluded that CD most effectively reflected cognitive decline over time [26], and we previously demonstrated that CD predicted the progression to incident AD from non-demented status [9]. CD has been linked to falls in people with AD [27]. Falls have also been linked to decline in executive function [28], and the present study also showed that AD patients with CD have decline in a wide range of cognitive functions, including lower executive function.
Both SB and CD were associated with lower scores in several neuropsychological assessments in all three cognitive status (NC, MCI, and AD); however, we did not find clear patterns of impaired cognitive domains associated with each error type occurred with differences in cognitive status from NC to AD dementia. The most prominent difference between these two error types was their frequency distributions by cognitive status (CN, MCI, and AD). The frequencies of both errors increased according to dementia status but the profiles were different. SB was relatively rare (less than 7%) in CN individuals but found in 23.4%of MCI individuals, with 27.2%of CN individuals and 31.5%of MCI individuals making CD-type errors. The more frequent appearance of CD in pre-demented stages may be one reason why we found that CD, but not SB, predicted progression to dementia from pre-dementia in our previous study [9].
PD is defined by uneven gaps between numbers on the clock face. The frequency of this type of error did not increase from CN status to AD. PD is reported to reflect visuospatial and planning functions [29] and executive function [30] and is usually believed to be associated with parietal lobe impairment [20]. We found few significant differences in the scores of neuropsychological assessments between individuals with and without PD, including on tests assessing executive function (the TMT and Stroop tests) [31]. A study of MCI individuals [32] reported that CD and PD were associated with multiple neuropsychological assessments. However, no associations were found with SB, which does not completely agree with our present results. We did not include tests that specifically assess visuospatial ability in the present study, which may at least partly explain this discrepancy. Further exploration of the association between PD and cognitive ability is required.
To our knowledge, the present study is the first to explore the characteristics of errors in the CDT in a relatively large sample comprising people with various cognitive statuses. However, some limitations should be discussed. First, we only included AD, MCI, and CN individuals and excluded all other dementia subtypes. Further studies including other types of dementia may be warranted. Second, as discussed above, our battery of neuropsychological assessments did not specifically address the visuospatial domain, which may be one of the reasons why we could not determine which cognitive domain was associated with PD. Third, this study was performed in a single institute, which may potentially cause bias in participants’ characteristics, assessments of CDT errors, and possible diagnosis of dementia or MCI. A strong point of our study is the relatively large number of study participants. Forth, the CDT is a screening tool, not a diagnostic tool, the interpretation of the results should be with caution.
CONCLUSION
In conclusion, the frequency of SB was relatively low in the CN group and increased from the MCI to AD group. CD was more frequent than SB in the CN group and its frequency increased in the MCI and AD groups. The frequency of PD was similar among the CN, MCI, and AD groups. SB and CD were both associated with lower scores in several neuropsychological assessments in CN and MCI individuals. SB type error in CN was most prominently associated with poorer cognitive performance and SB in non-demented individuals was associated with a diagnosis of MCI. In AD, more neuropsychological assessments were associated with CD than with SB, whereas PD was associated with a poor cognitive performance in few of the tests. The current results may suggest that the qualitative measures in combination with quantitative scoring in CDT yield more effective screening measures. Future research would be warranted.