
Abstract
Background:
Abnormal default mode network (DMN) was associated with the progress of Alzheimer’s disease (AD). Rather than treat the DMN as a unitary network, it can be further divided into three subsystems with different functions.
Objective:
It remains unclear the interactions of DMN subsystems associated with the progress of cognitive impairments and AD pathological features.
Methods:
This study has recruited 187 participants, including test data and verification data. Firstly, an imaging analysis approach was utilized to investigate disease-related differences in the interactions of DMN subsystems in test data (n = 149), including 42 cognitively normal subjects, 43 early mild cognitive impairment (EMCI), 32 late mild cognitive impairment (LMCI), and 32 AD patients. Brain-behavior-pathological relationships regarding to the interactions among DMN subsystems were then further examined. Secondly, DMN subsystems abnormalities for classifying AD spectrum population in the independent verification data (n = 38).
Results:
This study found that the impaired cognition relates to disturbances in the interactions between DMN subsystems but preferentially in core subsystem, and the abnormal regulatory processes of core subsystem were significantly associated with the levels of cerebrospinal fluid Aβ and tau in AD-spectrum patients. Meantime, the nonlinear relationship between dysfunctional core subsystem and impaired cognition was observed as one progresses through the stages of MCI to AD. Importantly, this classification presented a higher sensitivity and specificity dependent on the core-centered connection abnormalities.
Conclusion:
The abnormal interaction patterns of DMN subsystems at an early stage of AD appeared and presented as core-centered connection abnormalities, which were the potential neuroimaging features for monitoring the development of AD.
Keywords
INTRODUCTION
Alzheimer’s disease (AD) is a neurodegenerative disease with cognitive impairment as the main clinical manifestation, and its incidence rate has risen sharply in recent years. The development of AD starts with the subjective cognitive decline, then continues into mild cognitive impairment (MCI) and ends in AD [1]. For earlier detection of disease in time, the risk of AD dementia is the highest in the MCI stage [2]. Indeed, convergent lines of evidence suggest that the Aβ and tau may be associated with AD progression [3–5]. Therefore, it is important to find these markers with higher sensitivity and specificity for detecting early AD.
The default mode network (DMN), an intrinsic functional network, has emerged as a focus of clinical neuroscientific study in AD. Previous studies have explored the functional connectivity changes in the DMN and reported their correlations with AD severity or progression [6, 7]. According to the functional dissection of DMN, it can be further divided into three subsystems: the core DMN subsystem, the dorsal medial prefrontal cortex (DMPFC) subsystem, and the medial temporal lobe (MTL) subsystem [8, 9]. Each subsystem has different functional characteristics. For example, the core subsystem includes the anterior medial prefrontal cortex (amPFC) and the posterior cingulate cortex (PCC), which are the hubs that connect other two subsystems [10–13]. DMPFC subsystem comprises dorsal medial prefrontal cortex (dmPFC), temporoparietal junction (TPJ), lateral temporal cortex (LTC), and temporal pole (TempP), which is mainly involved in psychological and conceptual processing [14, 15]. The MTL subsystem consists of ventral medial prefrontal cortex (vmPFC), posterior inferior parietal lobule (pIPL), retrosplenial cortex, parahippocampal cortex and hippocampus, which are mainly involved in autobiographical memory and episodic future thought [16, 17]. The DMPFC and MTL subsystems both overlap with the medial core. Importantly, the key regions of DMN are functional abnormals [18–21] and pathologically damaged by amyloid pathology a few years before the onset of clinical symptoms of AD, and DMN is intact during healthy aging but is damaged in the early stages of AD [22]. Therefore, it is absolutely necessary to explore the characteristics of damaged DMN subsystems in AD-spectrum patients.
Each subsystem of DMN subserves different cognitive functions [8], and there are also some preliminary studies on DMN subsystems in neuropsychiatric diseases. For example, the increases of functional connectivity between the core and the MTL subsystem, and the decreased connectivity between the core and the DMPFC subsystem and within the MTL subsystem were observed in major depressive disorder [23]. The memory-related MTL subsystem was predominantly disrupted in AD patients, albeit the overall interaction pattern between the three subsystems is still unclear [24]. These findings were in line with the hypothesis that the core DMN subsystem is crucial to moderate the relationship between DMN subsystems [25]. To our knowledge, AD-spectrum patients are associated with the abnormal multiple brain networks [26, 27] and are not uniformly disrupted in AD patients [17]. Interestingly, the cognitive decline-related brain network interaction has been observed in AD patients [28]. Increasing evidence suggests that the damaged interaction of brain networks is more sensitive and important to the monitoring and early diagnosis of AD than the alteration of single network [29–31]. However, it remains unclear whether and how to predict early AD using the changed pattern on the interaction of DMN subsystems as a candidate neuroimaging biomarker.
This study traced the associations between DMN subsystems and the progress of cognitive impairments and pathological features in AD-spectrum patients. We hypothesized that 1) abnormal interaction patterns of DMN subsystems at an early stage of AD appeared and presented as core-centered connection abnormalities, and 2) the cognitive decline related to these abnormal interactions of DMN subsystems may have a pathological basis behind them.
MATERIAL AND METHODS
Data source
Data used in this study were obtained from the Alzheimer’s Disease Neuroimaging Initiative (ADNI) database (http://adni.loni.usc.edu). The ADNI is a longitudinal multicenter study that was launched in 2003 that contributed by 20 companies and two foundations through the Foundation for the National Institutes of Health and the National Institute on Aging as a public-private partnership, led by Principal Investigator Michael W. Weiner, MD. The primary goal of testing whether neuroimaging, neuropsychologic, and other biomarker discovery can be used as reliable markers of AD pathogenesis. According to ADNI protocol, each participant was able to perform all test procedures described in the protocol. Informed written consent was obtained from all participants and the study partners at each site.
Participants
Based on the ADNI databases, we identified 187 participants, including test data and verification data. These subjects were matched in gender, age, and education level, and these subjects had no history of significant neurological and psychiatric illness (e.g., stroke, traumatic brain injury, depression, and others). An imaging analysis approach was utilized to investigate disease-related differences in the interactions of DMN subsystems in test data (n = 149), including 42 cognitively normal subjects, 43 early MCI (EMCI), 32 late MCI (LMCI), and 32 AD patients. Then, DMN subsystems abnormalities for classifying AD spectrum population in the independent verification data (n = 38). Every subject underwent resting-state fMRI scanning and neuropsychological tests. Full inclusion and exclusion criteria (for details, see the Supplementary Material) and detailed schedules of assessment for CN, EMCI, LMCI, and AD are available in the general procedure manual on the ADNI website (http://adni.loni.usc.edu/data-samples/access-data/).
Neuropsychologic assessments
All neuropathological assessments in ADNI have a study partner able to provide an independent evaluation and are performed through the central laboratory of the ADNI neuropathology core. Neuropsychologic evaluations were used in the study including general cognition and episodic memory. General cognition containing Mini-Mental State Examination (MMSE) and Montreal Cognitive Assessment (MoCA) is used for preliminary screening about cognitive impairment and dementia, while the Rey Auditory Verbal Learning Test (RAVLT) can be regarded as a marker of episodic memory in AD to distinguish AD, MCI, or normal aging.
Cerebrospinal fluid pathological markers
The lumbar puncture is not mandatory in the ADNI protocol, which is an invasive procedure, so not all subjects in our study had cerebrospinal fluid (CSF) samples. In previous studies, it has been known that Aβ1–42, total tau (t-tau), and phosphorylated tau (p-tau181) in CSF are correlated with cognitive impairment. Notably, in this study 133 CSF samples were obtained, including 34 CN, 40 EMCI, 30 LMCI, and 29 AD patients.
Resting-state fMRI data acquisition
Detailed descriptions about acquisition of ADNI imaging data are available at the ADNI website. MRI data were acquired with a 3.0-Tesla Philips MRI scanner. The resting-state fMRI scans images were collected with an echo-planar imaging sequence covering the entire brain with the following parameters: repetition time (TR) = 3000 ms; echo time (TE) = 30 ms; slice number = 48; slice thickness = 3.3 mm; flip angle = 80; acquisition matrix = 64×64; spatial resolution = 3.31×3.31×3.31 mm3. Then, a flowchart shows the whole pipeline of image processing (Fig. 1).

A flowchart shows the whole pipeline of image processing. In addition, three subsystems of the DMN were presented, i.e., the core subsystem (red), the DMPFC subsystem (blue), and the MTL subsystem (green).
Data preprocessing
For each participant, the resting-state fMRI data analyses were entirely performed on the Matlab platform (Matlab R2013b) using the SPM8 (www.fil.ion.ucl.ac.uk/spm), Resting-State fMRI Data Analysis Toolkit (REST, http://restfmri.net) [32] and the Data Processing Assistant for resting-state fMRI (DPARSF, http://restfmri.net/forum/DPARSF). The data preprocessing steps consisted of: 1) The first ten volumes were discarded for the signal equilibrium and subject’s adaptation to the scanning noise; 2) The remaining images were corrected for timing differences between each slice and head motion; 3) Spatial normalization from an individual functional space to the Montreal Neurological Institute (MNI) standard brain space, and resampled into 3 mm×3 mm×3 mm; 4) Spatially smoothed with a Gaussian kernel (full-width at half-maximum = 8 mm); 5) The linear trends and temporally filter (0.01 Hz < f<0.08 Hz) were erformed.
Network construction and analysis
Functional connectivity analyses of DMN subsystems
In this study, we used a voxel-wise functional connectivity approach. Firstly, the “ImCalc” of SPM8 was used to calculate the region of interest (ROI) in DMN subsystems, and three subsystem templates were derived from previous studies [23], including the core (i.e., amPFC and PCC), DMPFC (i.e., dmPFC, TPJ, LTC and TempP), and MTL (i.e., vmPFC, pIPL, retrosplenial cortex, parahippocampal cortex, and hippocampus) subsystems. Secondly, these three ROIs were used as seeds to detect the functional connectivity maps separately. For each participant, a mean time series for each ROI was computed as the reference time course. Cross-correlation analysis was then carried out between the mean signal change in the ROI and the time series of every voxel in the brain. The result of this voxel-wise analysis is a spatial map. A Fisher’s z-transformation was applied to improve the normality of the correlation coefficients. REST software calculated the Fisher’s z-map using the following formula: Z = 0.5log(1 + r)/(1-r). Thirdly, to remove possible effects of head motion, white matter signals and CSF signals on the results, six head motion parameters and the mean time series of white matter and CSF signals were also introduced as covariates.
Group-level analyses and brain-behavioral-pathological significance
1) To determine the patterns of one DMN subsystem connected to other two subsystems in each of the four groups, we focused on the regions belonging to the DMN. The spatial maps of the interactions of every DMN subsystem in each group were submitted to a random-effect analysis using one-sample t-tests in four groups. The statistical thresholds were set at a corrected p < 0.05, determined by FWE for multiple comparisons. 2) To explore to what extent changes in the interactions of DMN subsystems in AD-spectrum patients than in healthy controls, a voxel-wise analysis of variance (ANOVA) was performed in the four groups. Then, post-hoc tests were used to explore the details of the changes in the patterns of the DMN subsystems. Firstly, the mean value of functional connectivity within the mask of ANOVA interactions was extracted from each subject’s image. Secondly, the direct comparisons of the changed estimates among these four groups were further performed. The statistical thresholds were set at a corrected p < 0.05, determined by FWE for multiple comparisons. 3) We were particularly interested in these regions which were associated with statistically significant interactions of DMN subsystems (p < 0.05 corrected by FWE). Then, the neuropsychological and CSF pathological significance correlation with these regions of interest signals were further explored (p < 0.05).
Classification analysis
To avoid circular analysis, namely the use of the same data for selection and selective analysis will result in distorted descriptive statistics and invalid statistical inference whenever the test statistics are not inherently independent of the selection criteria under the null hypothesis [33]. Therefore, firstly, the core-centered connection abnormalities identified via the aforementioned group-level analyses were extracted as ROIs. Secondly, we examined unrelated samples of 38 subjects (CN, n = 10; EMCI, n = 11; LMCI, n = 7; AD, n = 10) and replicated the aforementioned functional connectivity analyses of DMN subsystems. Finally, the ability of ROIs (mean Z values, respectively) to separate these subjects was computed using Receiver Operating Characteristic (ROC). Area under the ROC curve (AUC), sensitivity and specificity values were extracted, and these values distinguishing AD spectrum population were further examined.
Statistical analysis involving demographic, neuropsychological, and CSF data
The differences among four groups in demographic, neuropsychological, and CSF data were assessed by Kruskal-Wallis tests (i.e., a nonparametric alternative for one-way ANOVA). Post-hoc tests were also performed by Mann-Whiney U Tests. The thresholds were set at p < 0.05 using SPSS 22.0 software (SPSS, Inc., Chicago, IL, USA).
RESULTS
Participant characteristics
The demographic and psychological characteristics of all 149 participants are shown in Table 1, respectively. No significant differences in terms of age, education level or gender were detected among the four groups. However, the results showed that the impairments of general cognition (i.e., MoCA and MMSE) and episodic memory (i.e., RAVLT_immediate, RAVLT_learning, and RAVLT_perc_forgetting) was gradually getting worse with the development of the disease.
Demographic and neuropsychological and cerebrospinal fluid data
Values were presented as the average±standard error (SE); p-value, because the data do not satisfy the normal distribution in the one-way ANOVA, the p value is obtained by Kruskal-Wallis test. p (Mann-Whiney U Test), which was used here due to the fact that the data were not normally distributed in the Post-hoc tests; * indicates a statistical difference between groups, p < 0.05; CN, cognitively normal; EMCI, early mild cognitive impairment; LMCI, late mild cognitive impairment; AD, Alzheimer’s disease; MMSE, Mini-Mental State Examination; MoCA, Montreal Cognitive Assessment; RAVLT, Rey Auditory Verbal Learning Test; Aβ, amyloid-β; t-tau, total tau; p-tau, phosphorylated tau.
A total of 133 CSF pathological samples were collected in this study, including 34 CN, 40 EMCI, 30 LMCI, and 29 AD. There is a tendency of pathological damage with the development of AD has been found in the present study, especially a significant reduction of CSF Aβ levels and increased CSF t-tau, p-tau levels in AD patients compared to CN, EMCI, and LMCI groups (p < 0.05).
Interactions among DMN subsystems in AD-spectrum patients
Figure 1 shows the three subsystems of the DMN, including the core subsystem, the DMPFC subsystem and the MTL subsystem. A qualitative visual inspection of these four sample groups demonstrates that there were similar patterns of one subsystem connects two other systems (p < 0.05 corrected by FWE) (Fig. 2). In details, the functional connectivity between core subsystem and other subsystems were mainly associated with bilateral prefrontal cortex, left temporal cortex, bilateral posterior cingulate, bilateral precuneus, and bilateral parahippocampal gyrus in the four groups, while DMPFC connects to other subsystems is mainly related to bilateral medial frontal gyrus, bilateral posterior cingulate, bilateral precuneus, and bilateral parahippocampal gyrus. Finally, the functional connectivity of MTL subsystem and other subsystems are mainly linked to bilateral prefrontal cortex, left middle temporal gyrus, bilateral posterior cingulate and bilateral precuneus.
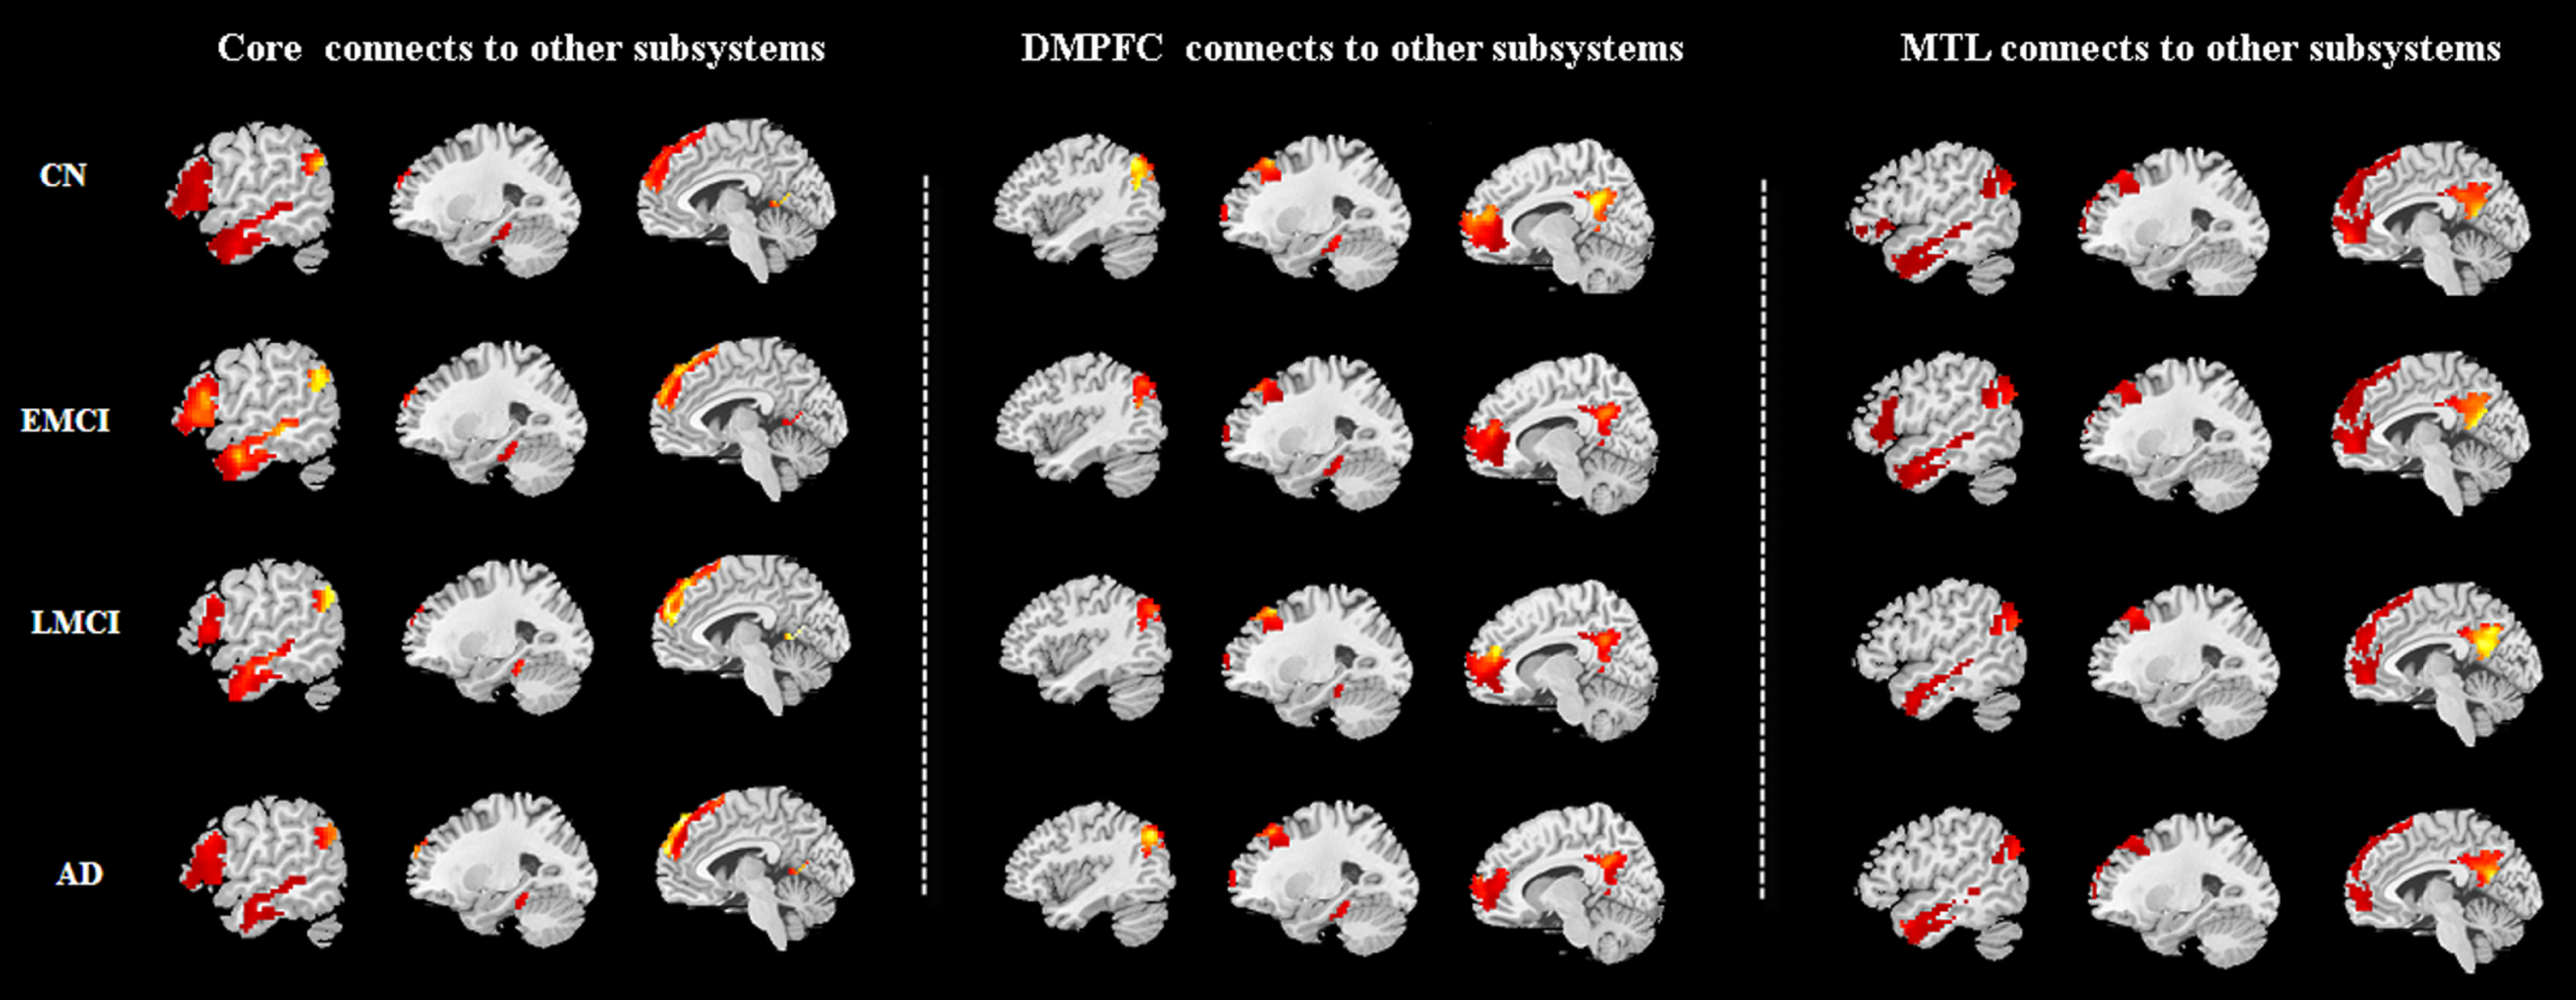
A qualitative visual inspection of these four sample groups demonstrates that there were similar patterns of one subsystem connects two other systems (p < 0.05 corrected by FWE). 1) the functional connectivity between core subsystem and other subsystems were mainly associated with bilateral prefrontal cortex, left temporal cortex, bilateral posterior cingulate, bilateral precuneus and bilateral parahippocampal gyrus in the four groups. 2) DMPFC connects to other subsystems is mainly related to bilateral medial frontal gyrus, bilateral posterior cingulate, bilateral precuneus and bilateral parahippocampal gyrus. 3) The functional connectivity of MTL subsystem and other subsystems are mainly linked to bilateral prefrontal cortex, left middle temporal gyrus, bilateral posterior cingulate and bilateral precuneus.
Furthermore, one-way ANOVA of functional connectivity between DMN subsystems in four groups were showed in Table 2. There were no significant difference in DMPFC connects to other subsystems and MTL subsystem connects to other subsystems between these four groups (p > 0.05 corrected by FWE). However, core subsystem connects to DMPFC which were associated with left superior frontal gyrus, left inferior frontal gyrus, and left middle temporal gyrus, while core subsystem connects to MTL that was observed in left precuneus between four groups (p < 0.05 corrected by FWE).
One-way ANOVA of functional connectivity between DMN subsystems in groups
A corrected threshold of p < 0.05 corrected by FWE was taken as meaning that there was a significantly difference between groups. BA, Brodmann area; MNI, Montreal Neurological Institute; L, left; cluster size is in mm3.
When compared to CN, LMCI, and AD groups, EMCI group showed significant functional connectivity abnormalities between core subsystem and other two subsystems after post-hoc analysis (Fig. 3), including three highest connections and one lowest connection were observed in EMCI group. In details, the EMCI group was associated with the highest functional connectivity of core subsystem connects to DMPFC (i.e., left superior frontal gyrus: peak – 3 36 57; left inferior gyrus: peak – 51 24 3; left middle temporal gyrus: peak – 60 – 30 – 9) and the lowest functional connectivity within core subsystem connects to MTL (i.e., left precuneus: peak – 9 – 57 12) than other three groups (p < 0.05 corrected by FWE). In addition, AD group showed decreased functional connectivity in core subsystem connects to DMPFC (i.e., left middle temporal gyrus: peak – 60 – 30 – 9) and core subsystem connects to MTL (i.e., left precuneus: peak – 9 – 57 12) when compared to CN group (p < 0.05 corrected by FWE).

After post-hoc analysis, 1) the EMCI group was associated with the highest functional connectivity of core subsystem connects to DMPFC (i.e., left superior frontal gyrus: peak -3 36 57; left inferior gyrus: peak – 51 24 3; left middle temporal gyrus: peak – 60 – 30 – 9) and the lowest functional connectivity within core subsystem connects to MTL (i.e., left precuneus: peak – 9 – 57 12) than other three groups (p < 0.05 corrected by FWE). 2) AD group showed decreased functional connectivity in core subsystem connects to DMPFC (i.e., left middle temporal gyrus: peak – 60 – 30 – 9) and core subsystem connects to MTL (i.e., left precuneus: peak – 9 – 57 12) when compared to CN group (p < 0.05 corrected by FWE). Violet, CN; Brick red, EMCI; Green, LMCI; Blue, AD.
AD pathological-brain-behavior interactions
The interactions of DMN subsystems associated with psychological and CSF pathological characteristics (Fig. 4). Core subsystem connects to DMPFC subsystem: the interactions between core and DMPFC (i.e., left middle temporal gyrus) was negatively correlated with the level of CSF t-tau level (rho = – 0.374, p = 0.017) and p-tau (rho = – 0.374, p = 0.018) in EMCI group and CSF Aβ (rho = – 0.586, p = 0.001) in AD group. In addition, it should be noted that the higher RAVLT_prec_forgetting scores were associated with the more impaired episodic memory. The interactions between core and DMPFC (i.e., left superior frontal gyrus) was positively correlated with RAVLT_prec_forgetting scores (i.e., the higher core-DMPFC connection was associated with more impaired episodic memory) in EMCI group (rho = 0.304, p = 0.048). Core subsystem connects to MTL: the interactions between core connects to MTL (i.e., left precuneus) displayed a significantly negative correlation with RAVLT_prec_forgetting scores (i.e., the higher core-MTL connection was associated with less impaired episodic memory) in EMCI group (rho = – 0.315, p = 0.040) and the CSF Aβ level in AD group (rho = – 0.387, p = 0.038).
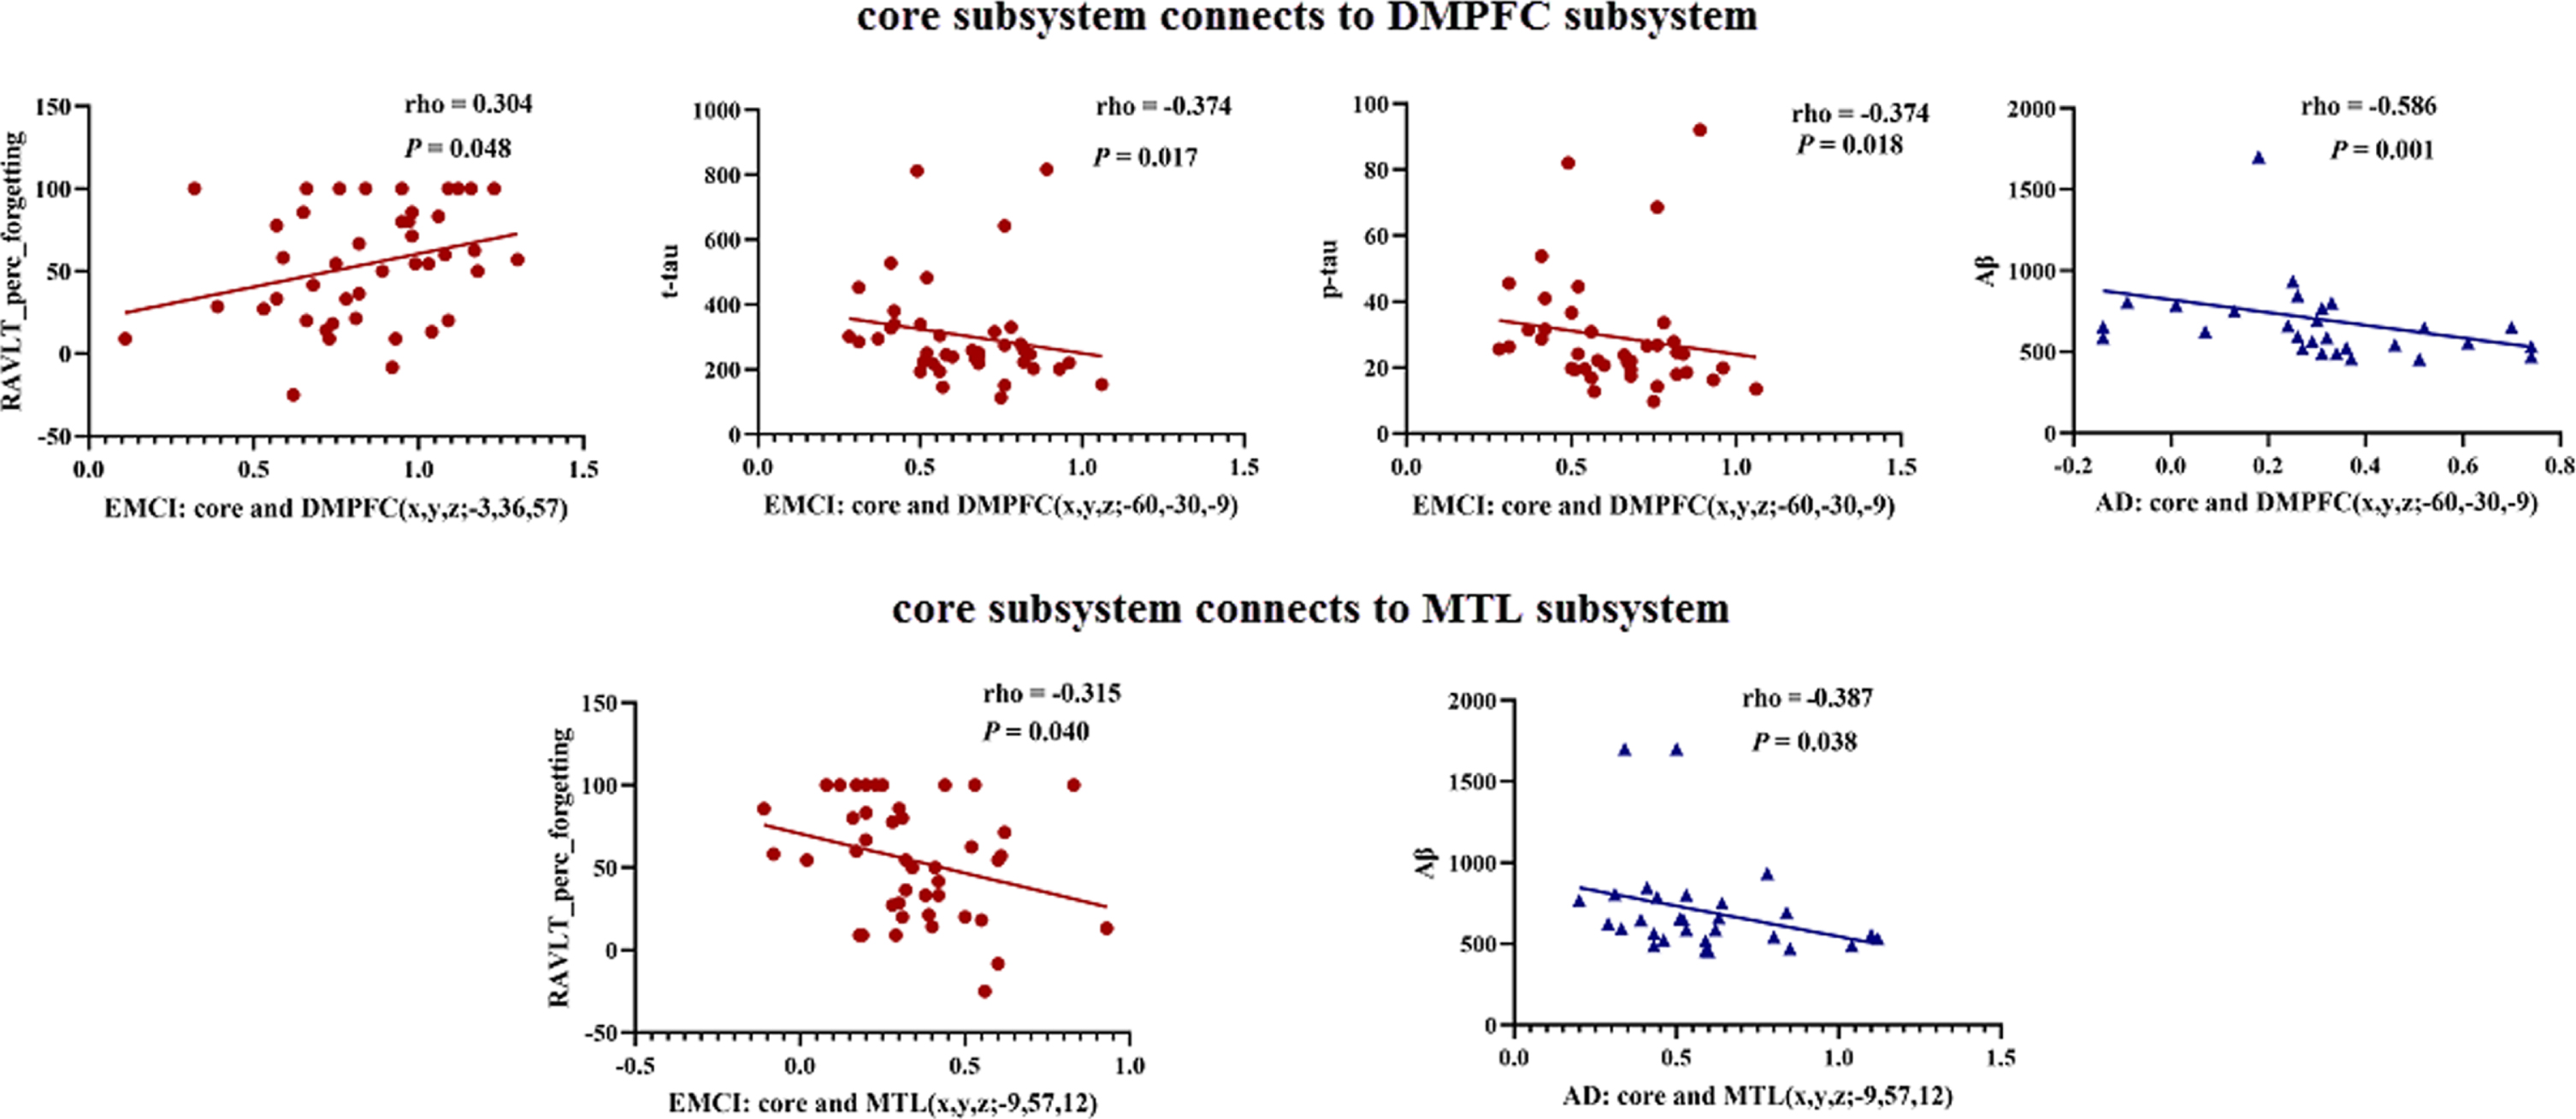
The interactions of DMN subsystems associated with psychological and CSF pathological characteristics were as follows: 1) core subsystem connects to DMPFC subsystem: the interactions between core and DMPFC (i.e., left superior frontal gyrus) was positively correlated with RAVLT_prec_forgetting scores (i.e., the higher core-DMPFC connection was associated with more impaired episodic memory) in EMCI group (rho = 0.304, p = 0.048). In addition, the interactions between core and DMPFC (i.e., left middle temporal gyrus) was negatively correlated with the level of CSF t-tau level (rho = – 0.374, p = 0.017) and p-tau (rho = – 0.374, p = 0.018) in EMCI group and CSF Aβ (rho = – 0.586, p = 0.001) in AD group. 2) Core subsystem connects to MTL: the interactions between core connects to MTL (i.e., left precuneus) displayed a significantly negative correlation with RAVLT_prec_forgetting scores (i.e., the higher core-MTL connection was associated with less impaired episodic memory) in EMCI group (rho = – 0.315, p = 0.040) and the CSF Aβ level in AD group (rho = – 0.387, p = 0.038). Brick red, EMCI; Blue, AD.
Core-centered connection abnormalities for classifying AD spectrum population
The present study further demonstrated that DMN subsystems could be used to establish classification criteria with ROC curves. As illustrated in Fig. 5, this classification presented a higher sensitivity and specificity dependent on the core-centered connection abnormalities.
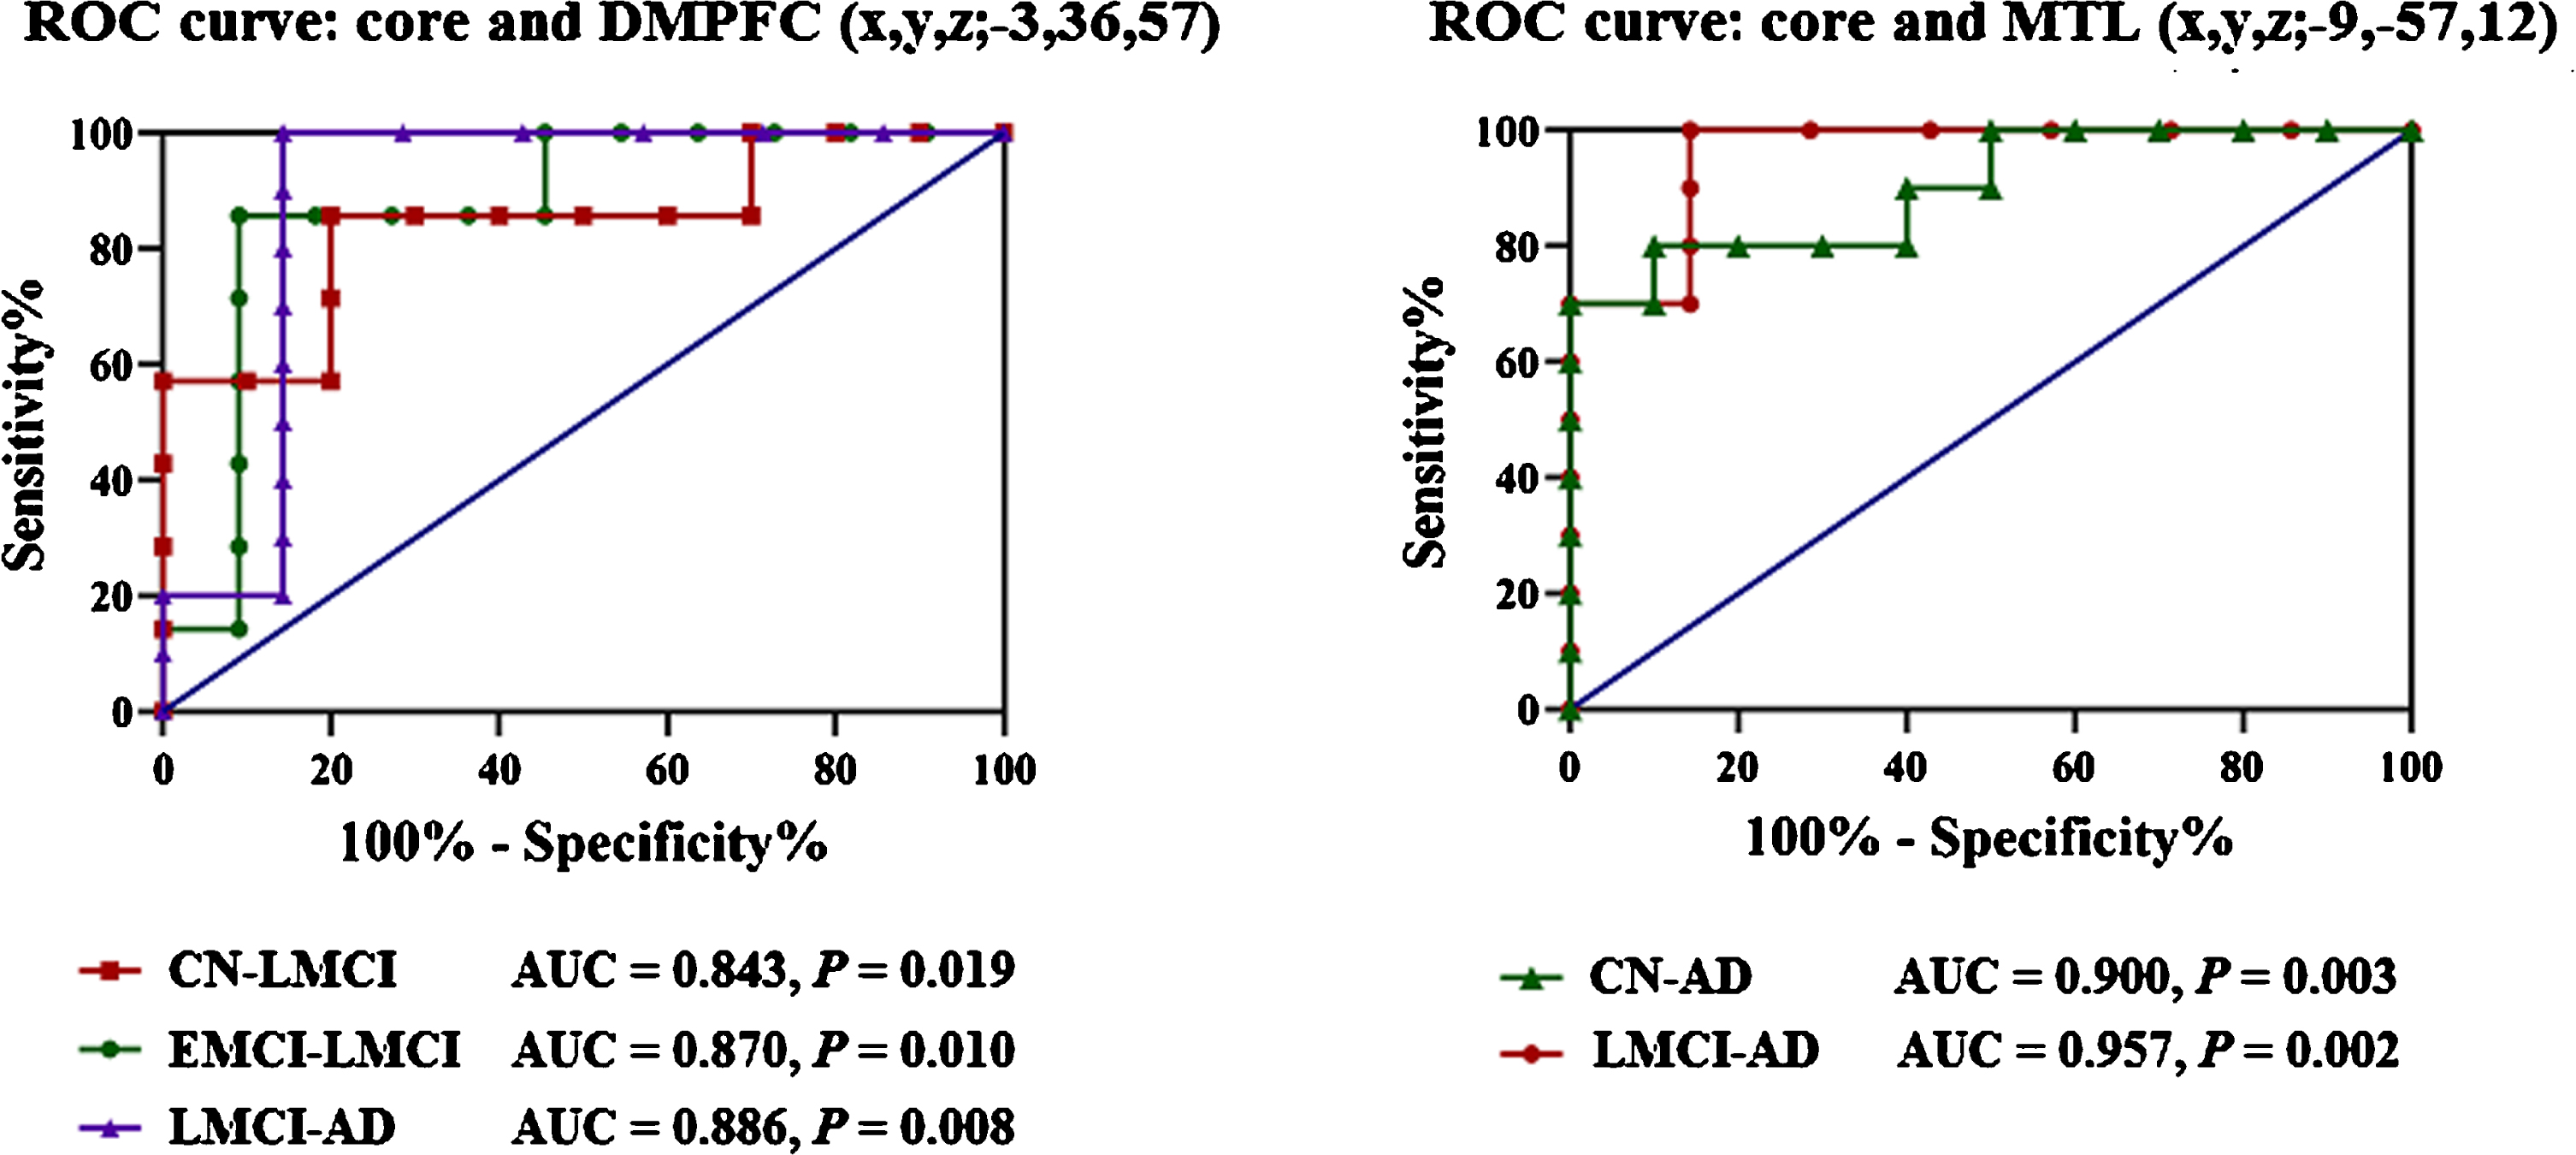
Core-centered connection abnormalities for classifying AD spectrum population. 1) The interactions between core and DMPFC (peak – 3 36 57) regarding the classification of groups: AUC are 0.843 (p = 0.019, 95% CI is 0.636 to 1.0, cutoff of 0.648 with sensitivity is 80.0%, specificity is 85.7%), 0.870 (p = 0.010, 95% CI is 0.691 to 1.0, cutoff of 0.604 with sensitivity is 90.9%, specificity is 85.7%) and 0.886 (p = 0.008, 95% CI is 0.673 to 1.0, cutoff of 0.608 with sensitivity is 85.7%, specificity is 100%), to discriminate the CN from LMCI, EMCI from LMCI, and LMCI from AD, respectively. 2) The interactions between core and MTL (peak – 9 – 57 12) regarding the classification of groups: AUC is 0.900 (p = 0.003, 95% CI is 0.763 to 1.0, cutoff of 0.445 with sensitivity is 90.0%, specificity is 80.0%) in distinguishing CN from AD patients; AUC is 0.957 (p = 0.002, 95% CI is 0.862 to 1.0, cutoff of 0.601 with sensitivity is 85.7%, specificity is 100%) in distinguishing LMCI from AD patients.
ROC analysis provided information on mean Z values of the interactions between core and DMPFC (peak – 3 36 57) regarding the classification of groups: AUC are 0.843 (p = 0.019, 95% CI is 0.636 to 1.0, cutoff of 0.648 with sensitivity is 80.0%, specificity is 85.7%), 0.870 (p = 0.010, 95% CI is 0.691 to 1.0, cutoff of 0.604 with sensitivity is 90.9%, specificity is 85.7%) and 0.886 (p = 0.008, 95% CI is 0.673 to 1.0, cutoff of 0.608 with sensitivity is 85.7%, specificity is 100%), to discriminate the CN from LMCI, EMCI from LMCI, and LMCI from AD, respectively.
In addition, the interactions between core and MTL (peak – 9 – 57 12) regarding the classification of groups: AUC is 0.900 (p = 0.003, 95% CI is 0.763 to 1.0, cutoff of 0.445 with sensitivity is 90.0%, specificity is 80.0%) in distinguishing CN from AD patients; AUC is 0.957 (p = 0.002, 95% CI is 0.862 to 1.0, cutoff of 0.601 with sensitivity is 85.7%, specificity is 100%) in distinguishing LMCI from AD patients.
DISCUSSION
This study investigated the interactions of DMN subsystems and the underlying pathological basis in AD-spectrum patients. Here are the three main findings: 1) The disturbances of the interactions between DMN subsystems were preferentially in core subsystem, and it presented a higher sensitivity and specificity of the classification in AD-spectrum patients; 2) The abnormal regulatory processes of core subsystem were significantly associated with the levels of CSF Aβ and tau in AD-spectrum patients; 3) The dysfunctional core subsystem from cognitive impairment to AD was not a linear development model.
Impaired cognition relates to disturbances in the interactions between DMN subsystems but preferentially in core subsystem
DMN comprises three interacting subsystems, involving memory processing through the division of different emphasis [14]. Higher-order cognitive functions depend on top-down regulatory processes to ensure that relevant goals are achieved, and core subsystem was associated with the different regulatory effects on DMPFC and MTL subsystem in the DMN subsystems [8, 23]. Increasing evidence supported the core subsystem of DMN was the pivotal subsystem in the DMN [34]. Importantly, we found that the disturbances of the interactions between DMN subsystems was preferentially in core subsystem in AD-spectrum patients, and this classification presented a higher sensitivity and specificity dependent on the core-centered connection abnormalities. In addition, the previous studies have shown that the connections within the MTL or DMPFC were significantly associated with cognitive impairments in AD patients [19]. Therefore, the present findings further supported that the impaired cognition was also related to the abnormal regulatory processes of core subsystem. In line with these findings, the cognitive impairment patients with end-stage renal disease also showed the preferentially disrupted core subsystem [35]. It should be noted that DMN is not a unitary network but rather is composed of interconnected subsystems involving in different roles in the processing of AD [36, 37]. Therefore, we speculated that the top-down progressive damage may appear more obvious in the later stages of AD, although the other two subsystems (i.e., DMPFC subsystem and MTL subsystem) were reserved at an early functionally in the present study. In addition, we found these regulatory regions associating leftward lateralization of the core subsystem in this study. A recent study found leftward lateralization in hemispheric network efficiency and noted that the degree of leftward hemispheric lateralization in network local efficiency significantly increased with development [38], albeit the contrasting lateralization findings may be attributed to the age range of the subject sample and various imaging analyzed methods [39]. The underlying mechanism was that the left hemisphere plays a leading role in highly demanding cognitive processes, such as memory [38].
Interaction of core subsystem and other subsystems is intimately related to AD pathological damage
Neuropathological biomarkers of AD were associated with extracellular Aβ deposits and intraneuronal neurofibrillary tangles, and the quantification of Aβ and tau protein levels in CSF have also been developed for diagnosis of AD [40, 41]. In this study, EMCI patients showed increased functional connectivity between core and DMPFC when compared to cognitively normal individuals, and the interactions were negatively correlated with the level of CSF t-tau and p-tau. On the contrary, AD patients were observed decreased functional connectivity between core and other two subsystems when compared to controls, while these decreases were negatively related to the level of CSF Aβ. Therefore, the abnormal regulatory processes of core subsystem were significantly associated with the levels of CSF Aβ and tau in AD-spectrum patients. These regions of the interactions between core and other two subsystem were involved in frontal, temporal and parietal lobe in the present study. These findings were in line with the previous studies, and the Aβ plaque deposition is mainly concentrated in the medial prefrontal lobe and medial parietal lobe [42], while tau protein has been found to be correlated with the structural stability of temporal lobe connectivity [43]. Importantly, AD pathology progression has been explained through the network degeneration hypothesis, a model of “up- and downstream” functional AD pathology progression, suggesting that AD pathology evolves along functional connectivity networks not only “downstream” but also in part “upstream” or “retrograde” [44].
Nonlinear relationship between dysfunctional core subsystem and impaired cognition as one progresses through the stages of MCI to AD
In this study, core-DMPFC and core-MTL on the brain anomalies resulted in a completely opposite pattern. Specifically, core-DMPFC showed a certain phase of hyperactivity during EMCI, followed by rapid declines in brain function for LMCI and AD patients, while the opposite patterns were observed in core-MTL. Therefore, we speculated that the dysfunctional core subsystem from cognitive impairment to AD was not a linear development model. The possible reason may be concluded as follows: the connection between subsystems in DMN is different in terms of mode, especially the connection is different between core and other two subsystems [45–47]. Regarding the first increased and then decreased interactions of core-DMPFC, it could reflect the functional compensation. When the mechanism eventually falters, a more dramatic level of functional failure is suddenly uncovered, which translates into an accelerated decline afterward [33]. On the contrary, core-MTL showed the patterns involving first decreased and then increased interactions. A previous study confirmed that different brain regions interact with each other and eventually reach a balance to facilitate global brain communication [48]. Therefore, we assumed that the relationship of dynamic restriction may be in the interconnected subsystems, for example, core-DMPFC and core-MTL may tend to a balance at the level of integration of DMN.
Limitations
There were several limitations in this study. Firstly, this study focused on the DMN subsystems in the AD-spectrum, and more investigation associated with the interactions between DMN subsystems and other resting state networks could be explored. Secondly, the temporal dynamics of functional connectivity is related to the underlying structural network characteristics in DMN, and less stable functional and structural networks of DMN in individuals with poorer cognitive insight [49]. Therefore, it is necessary to detect the characteristics and changes of DMN subsystem at the structural level in the future.
CONCLUSION
In conclusion, this study revealed the abnormal interaction patterns of DMN subsystems at an early stage of AD appeared and presented as core-centered connection abnormalities. Moreover, the abnormal regulatory processes of core subsystem were significantly associated with AD pathological damage in AD-spectrum patients. Therefore, the present study further demonstrated that core-centered connection abnormalities could be used to establish classification criteria, and these findings could add to accumulating evidence that the interactions of DMN subsystems are expected to become potential neuroimaging features for monitoring the development of AD.
Footnotes
ACKNOWLEDGMENTS
This work was supported partly by grants from the National Natural Science Foundation of China (No. 81822013; 82071186), Jiangsu Provincial Key Medical Talents (No. ZDRCA2016085), the Key Research and Development Program of Jiangsu Province of China (BE2016610), the National Key Research and Development Program of China (2016YFC1300500-504) and Jiangsu Province Key Medical Discipline (ZDXKA2016020).
Data collection and sharing for this project was in part funded by the Alzheimer’s Disease Neuroimaging Initiative (ADNI) (National Institutes of Health Grant U01 AG024904) and DOD ADNI (Department of Defense award number W81XWH-12-2-0012). ADNI is funded by the National Institute on Aging, the National Institute of Biomedical Imaging and Bioengineering, and through generous contributions from the following: AbbVie, Alzheimer’s Association; Alzheimer’s Drug Discovery Foundation; Araclon Biotech; BioClinica, Inc.; Biogen; BristolMyers Squibb Company; CereSpir, Inc.; Cogstate; Eisai Inc.; Elan Pharmaceuticals, Inc.; Eli Lilly and Company; EuroImmun; F. Hoffmann-La Roche Ltd and its affiliated company Genentech, Inc.; Fujirebio; GE Healthcare; IXICO Ltd.; Janssen Alzheimer Immunotherapy Research &Development, LLC.; Johnson & Johnson Pharmaceutical Research & Development LLC.; Lumosity; Lundbeck; Merck & Co., Inc.;Meso Scale Diagnostics, LLC.; NeuroRx Research; Neurotrack Technologies; Novartis Pharmaceuticals Corporation; Pfizer Inc.; Piramal Imaging; Servier; Takeda Pharmaceutical Company; and Transition Therapeutics. The Canadian Institutes of Health Research is providing funds to support ADNI clinical sites in Canada. Private sector contributions are facilitated by the Foundation for the National Institutes of Health (![]() ). The grantee organization is the Northern California Institute for Research and Education, and the study is coordinated by the Alzheimer’s Therapeutic Research Institute at the University of Southern California. ADNI data are disseminated by the Laboratory for Neuro Imaging at the University of Southern California.
). The grantee organization is the Northern California Institute for Research and Education, and the study is coordinated by the Alzheimer’s Therapeutic Research Institute at the University of Southern California. ADNI data are disseminated by the Laboratory for Neuro Imaging at the University of Southern California.