
Abstract
Background:
Amnestic mild cognitive impairment (aMCI) is the transitional stage between normal aging and Alzheimer’s disease (AD). Some aMCI patients will progress into AD eventually, whereas others will not. If the trajectory of aMCI can be predicted, it would enable early diagnosis and early therapy of AD.
Objective:
To explore the development trajectory of aMCI patients, we used diffusion tensor imaging to analyze the white matter microstructure changes of patients with different trajectories of aMCI.
Methods:
We included three groups of subjects:1) aMCI patients who convert to AD (MCI-P); 2) aMCI patients who remain in MCI status (MCI-S); 3) normal controls (NC). We analyzed the fractional anisotropy and mean diffusion rate of brain regions, and we adopted logistic binomial regression model to predicate the development trajectory of aMCI.
Results:
The fraction anisotropy value is significantly reduced, the mean diffusivity value is significantly increased in the two aMCI patient groups, and the MCI-P patients presented greater changes. Significant changes are mainly located in the cingulum, fornix, hippocampus, and uncinate fasciculus. These changed brain regions significantly correlated with the patient’s Mini-Mental State Examination scores.
Conclusion:
The study predicted the disease trajectory of different types of aMCI patients based on the characteristic values of the above-mentioned brain regions. The prediction accuracy rate can reach 90.2%, and the microstructure characteristics of the right cingulate band and the right hippocampus may have potential clinical application value to predict the disease trajectory.
Keywords
INTRODUCTION
Alzheimer’s disease (AD) is a neurodegenerative disease that affects 10%of the elderly population older than 65 years, and due to the lack of disease-modifying treatments, is thought to be the fifth leading cause of death worldwide [1]. AD, the most common cause of dementia, is a devastating terminal illness characterized by progressive cognitive impairment, and increasing functional dependence. Acetylcholinesterase inhibitors are now used for the treatment of mild or moderate AD, and memantine, an N-methylD-aspartate receptor antagonist is commonly used for moderate and severe AD. Although helpful, these medicines can only relieve the symptoms of the disease. Meta-analyses show that the medicine has a short-term effect on cognitive function but no effect on the progression of the disease [2]. Threatened by the lack of curative treatment for AD and amnestic mild cognitive impairment (aMCI), the early detection and intervention will provide an opportunity to slow down or reverse the deterioration [3–5]. Early diagnosis of AD will help doctors offer patients a reasonable treatment plan to avoid the deterioration of the disease, thus reducing cognitive deficits and ultimately help patients preserve their quality of life. Therefore, finding the early diagnostic image marker of AD is very important.
aMCI is thought to be an intermediate stage between normal healthy status and AD status [6–8]. Existing studies have suggested that approximately 25%of individuals with aMCI tend to progress to AD in 5 years [9–12]. Patients who convert to AD are defined as MCI-P, and those who remain in MCI status are referred to as MCI-S [2, 14]. Therefore, analyzing the characteristics of aMCI with different clinical trajectories and predicting the possibility of conversion to AD will not only deepen our understanding of aMCI but also provide effective information for diagnosis and intervention in the early stage.
AD is characterized by two underlying pathological hallmarks: the progressive accumulation of extracellular amyloid-β (Aβ) plaques and intracellular neurofibrillary tangles [15]. Bateman and co-workers reported that the appearance of a decreased CSF Aβ42 and an elevated CSF tau precede the clinical symptomatic by 25 and 15 years respectively [16]. Nowadays, structural magnetic resonance imaging (sMRI) has already been used to observe the atrophy of the hippocampus and temporal lobe as an auxiliary method to diagnose AD; however, it is not very sensitive to the subtle changes at the early stage of aMCI or AD [17]. Therefore, it is essential to find a sensitive biomarker of the aMCI stage which might be an early warning of AD disease.
Diffusion tensor imaging (DTI) reflects the integrity and connectivity of the brain tissue structure by measuring the diffusion of water molecules in different directions in the brain. DTI is very sensitive to the tiny changes in the microstructure of the white matter fiber bundles in the brain, so it is suitable for the study of the early characteristics of brain diseases. In recent years, DTI has been widely used in white matter damage and classification studies in AD and MCI patients [18–21]. Fractional anisotropy (FA) and mean diffusivity (MD) are two commonly employed diffusion parameters in the analysis of DTI data. FA reflects the directional variation of water molecule diffusion measured in the different directions [22, 23], whereas MD represents the average diffusivity [22, 23]. The FA decrease and MD increase are parallel to the loss of myelin and axonal membranes that restrict the random movement of water molecules along with the white matter bundle. In short, the changes of FA and MD indicate the destruction of white matter microstructure integrity. A large number of DTI studies had found that the white matter fiber bundles showed extensive damage in patients with AD and aMCI. The changed brain regions were mainly located in the hippocampus, cingulum, fornix, uncinate, and longitudinal [19, 24–27]. Liu et al. found that the degree of white matter fiber tract damage in MCI patients is relatively mild, which is between AD and normal healthy elderly [28, 29]. Oishi and other studies have shown that the degree of FA damage in the fornix can be used to distinguish AD patients from normal controls (NC) [30]. Tang et al. found stronger atrophy in the hippocampus, amygdala and greater expansion in ventricle happened in the MCI-P group [31]. While Liu et al. indicated that the hippocampus alone couldn’t be used as an independent variable to predict the conversion from MCI to AD [32]. DTI studies have shown that the FA and MD values of brain white matter fiber tracts in amnestic and non-amnestic MCI patients were significantly different [33]. A study compared the different subtypes of aMCI and found that both MCI patients had a lower FA value in the right superior longitudinal compared with that of NC [34]. Also, the degree of the changes in FA value of left uncinate fasciculus and other brain areas are different in the two MCI groups. These results indicated that the early changes in the brain microstructure of patients with different types of amnestic MCI were different, which might be one of the reasons that some of them convert to AD while others do not. So, can the inconsistency of the change be used to predict whether patients with amnestic MCI will transform into the AD stage in the future? In response to this question, this study presented both horizontal research and longitudinal prediction on the MCI-P and MCI-S to find sensitive indicators that can assist in predicting the clinical development trajectories of aMCI as is shown in Fig. 1.
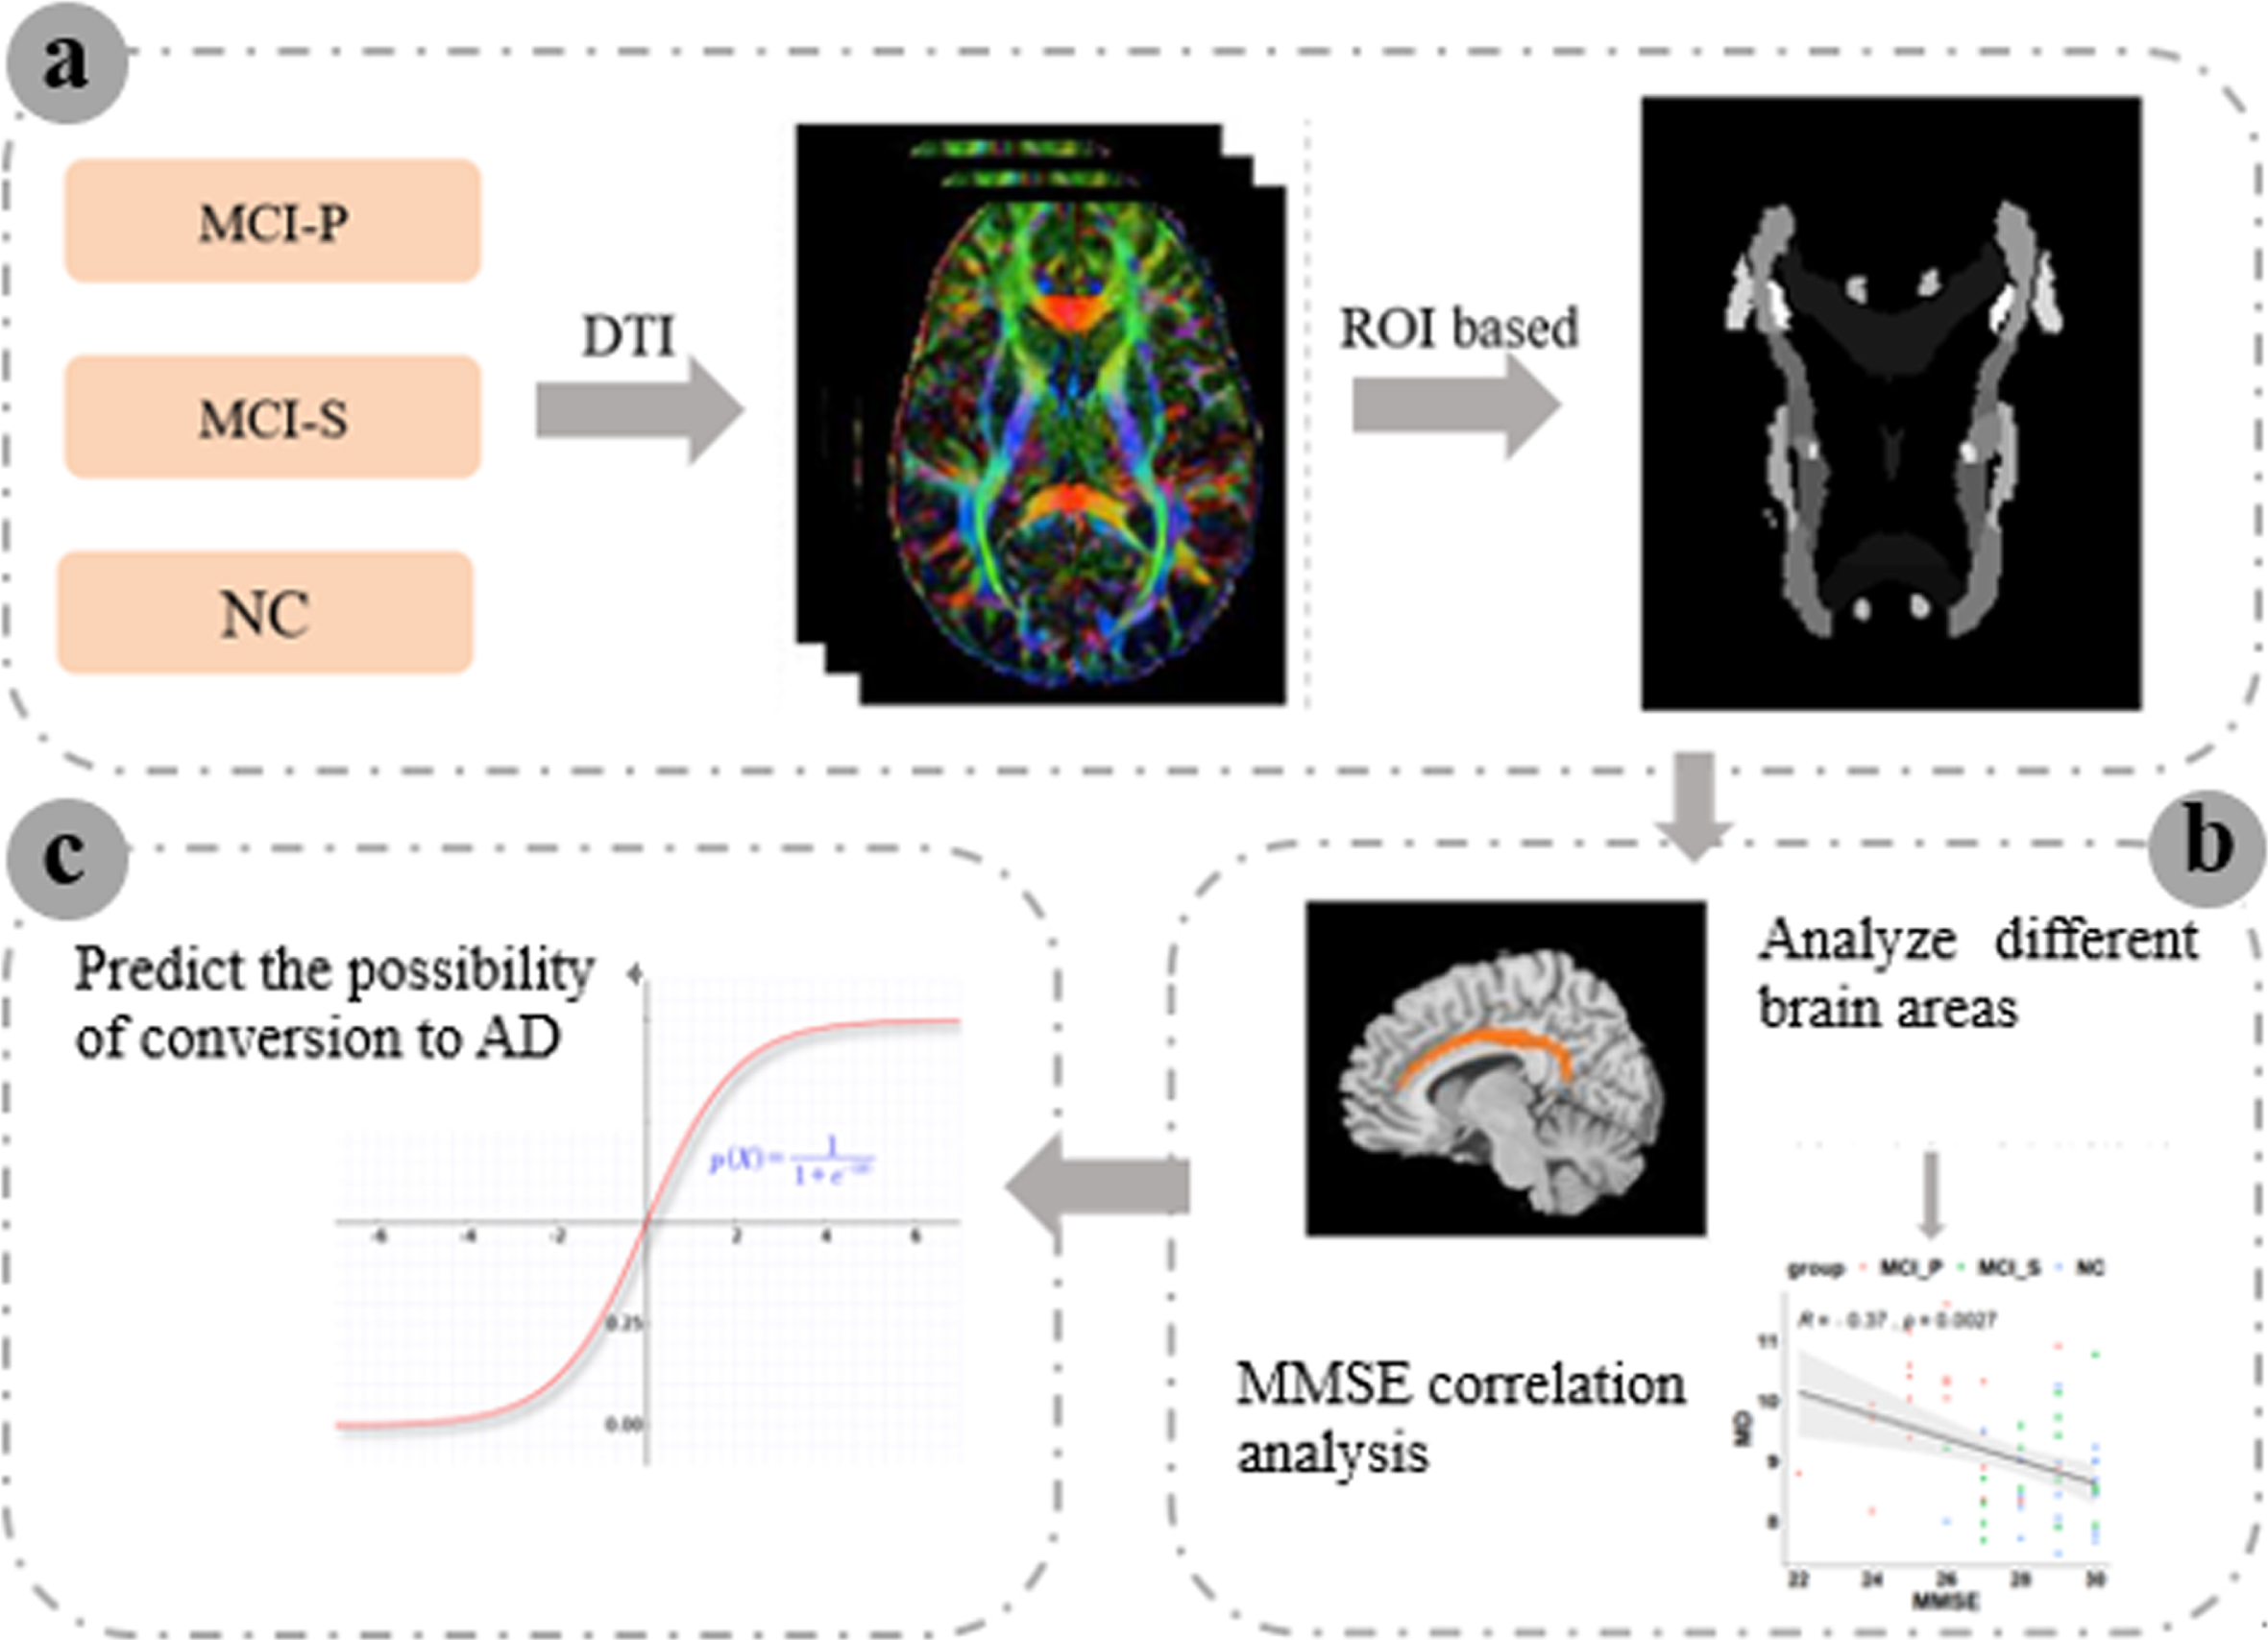
The flow chart of the study. (a) The FA and MD values of 50 brain subjects from the three groups based on the template were extracted. (b) The FA and MD values were registered to the standard space and analyze white matter changes among the three groups. (c) Based on binary logistic regression to predict the future development of aMCI patients. FA, fraction anisotropy; MD, mean diffusivity; AD, Alzheimer’s disease; MMSE, Mini-Sental State Examination; MCI, mild cognitive impairment; MCI-P, MCI patients who convert to AD; MCI-S, MCI patients who remain in MCI status; NC, normal controls; ROI, region of interest; DTI, diffusion tensor imaging.
MATERIALS AND METHODS
ADNI database
The data used in this study was obtained from the Alzheimer’s Disease Neuroimaging Initiative (ADNI) open database (http://adni.loni.usc.edu/). The ADNI study was launched in 2003 by the National Institute on Aging (NIA), the National Institute of Biomedical Imaging and Bioengineering (NIBIB), the Food and Drug Administration (FDA), private pharmaceutical companies and non-profit organizations. The goals of ADNI were to find sensitive and accurate methods to diagnose AD at earlier stages and test whether neuroimaging (e.g,. MRI, fMRI, PET) and genetic profiles and biomarkers in blood and cerebrospinal fluid could be combined to measure the progression of MCI and early AD. Now ADNI includes four phases (ADNI, ADNI GO, ADNI 2, and ADNI 3), recruiting over 1,500 adults. Participates in the research ages from 55 to 90, consisting of AD patients, MCI subjects, and normal controls. For more up-to-date information, please see http://www.adni-info.org.
Ethics statement
Written informed consent was given at the time of enrollment for imaging by the study subjects. Genetic sample collection and completed questionnaires were approved by each participating site’s Institutional Review Board (IRB). The authors state that they have obtained approval from the ADNI Data Sharing and Publications Committee for the purpose of using the data and confirm that the data were analyzed anonymously.
Subjects
All the data used in this research were downloaded from phase ADNI 2. All subjects have at least 5 years of data collection. The scale data is consistent without any missing. Cognitive function and degree of dementia were evaluated by the Mini-Mental State Examination (MMSE) and Clinical Dementia Rating (CDR) [35]. The MMSE and CDR scores assessed when they participant in ADNI2 was regarded as baseline diagnosis result and the time that MCI-P progressed into the AD stage was regarded as the final diagnosis result. The average time that MCI-P progressed into the AD stage was 2∼3 years. As for the MCI-S group, we tracked at least 5 years of MMSE and CDR assessment to ensure their stability in aMCI status and chose 2∼3 years’ assessment result as the final diagnosis score. General inclusion/ exclusion criteria are as follows: 1) MCI-P subjects: diagnosed as aMCI at the time of enrollment in ADNI 2, MMSE scores = 24∼30, CDR = 0.5, convert to AD, absence of depression, or other kinds of dementia. 2) MCI-S subjects: assessed as aMCI, MMSE scores = 26∼30, CDR = 0.5, unchanged CDR during the data collection process, MMSE scores did not fluctuate more than 2 points, absence of depression or other kinds of dementia. 3) NC subjects: MMSE scores between 28 and 30, CDR = 0, normal cognition during the data collection stage, absence of depression or other kinds of dementia. The gender and age of all subjects were matched. Demographics and clinical information are listed in Table 1.
Subject demographics and clinical information
Data are given as mean±standard error (SE). According to One-way ANOVA with Bonferroni post-hoc analysis, there were no group differences in age and gender among the MCI-P, MCI-S and NC groups. Analysis of variance (ANOVA) showed that there were significant differences among the three groups of CDR and MMSE scores. Bonferroni post-hoc analysis showed that there was no significant difference in CDR between the MCI-S and MCI-P groups, but their MMSE score was significantly different. The MMSE scores of the MCI-S and NC groups were not significantly different. MMSE, Mini-Mental State Examination; CDR, Clinical Dementia Rating scale; MCI, mild cognitive impairment; MCI-P, MCI patients who convert to AD; MCI-S, MCI patients who remain in MCI status; NC, normal controls; F, female; M, male, aResult obtained by the chi-square test, bResult obtained by the One-way Analysis of Variance (ANOVA).
Data acquisition
The DTI data were downloaded from phase ADNI 2. The DTI was acquired using 3.0 T GE MEDICAL SYSTEMS. Subjects should have their eyes open. Parameters list as follows: repetition time =12300 ms, echo time = 68.4 ms, acquisition matrix= 128×128, scan matrix = 256×256×2714, flip angle = 90°, 41 directions, voxel size = 1.37×1.37×2.7 mm, slice thickness = 2.7 mm, layer spacing = 2.7 mm, slices were acquired for b values of 0 and 1000 s/mm2 using gradients along 41 different diffusion directions.
Data processing
Preprocessing
This study used the PANDA toolkit for DTI data preprocessing [36]. The data preprocessing procedures are as follows: 1) Convert DICOM files into NIfTI images. 2) Estimate the brain mask. 3) Crop raw images. 4) Correct for the eddy-current effect. PANDA just splits the 4D file (the input file of eddy_correct) into some 3D files and then performed the affine-registration exactly like eddy_correct. The purpose of this implementation was to avoid large memory demand when the 4D file size is huge. Finally, the gradient direction of each DWI volume was rotated according to the resultant affine transformations. 5) Calculate diffusion tensor (DT) metrics. This step involves a voxel-wise calculation of the tensor matrix and the DT metrics, including FA, MD, axial diffusivity (AD), and radial diffusivity (RD) [37, 38]. 6) Register all the individual images to a standardized template. 7) Smooth the standardized image. 8) Calculate the FA and MD corresponding to each brain area according to the template, before performing statistical analysis of the white matter atlas.
Registration from individual space to standard space
After the DTI data were preprocessed, the FA and MD value of the individual space needs to be registered to the standard space. First, the FA and MD maps of all the subject’s baseline data were registered to the MNI152 standard space with 1×1×1 mm3 using the FNIRT non-linear registration algorithm [39]. Next, the data were spatially smoothed with a 6 mm full width half maximum (FWHM) Gaussian kernel. Finally, the average value of FA and MD were calculated according to the white matter atlas corresponding to each brain area. The brain template used in this study came from the template established by Mori and his team at Johns Hopkins University [40]. The template divided the white matter atlas of 50 brain regions. Specific names of the brain regions were listed in Table 2.
Names of the 50 white matter regions
No, number; ROI, region of interest; R, right; L, left; limb, limbic.
Horizontal study of MCI with different outcomes
For each ROI, the difference of the FA and MD values among NC, MCI-P, and MCI-S were compared with one-way ANOVA. The post-hoc analysis was obtained by the Wilcoxon rank-sum test analysis. The significance threshold was set at p < 0.05. To determine whether the significantly changed brain regions are related to the severity of MCI, we calculated the Pearson correlation coefficients between the altered FA and MD values of these brain regions and the MMSE scores, the significant threshold was set at p < 0.05.
A longitudinal study on the development trajectory of amnestic MCI
We used binomial logistic regression to analyze whether the MMSE score of aMCI patients combined with characteristic values of brain microstructures can predict the clinical development trajectory of aMCI.
RESULTS
We used data obtained from the ADNI database and selected DTI data from 41 aMCI patients (24 MCI-P, 17 MCI-S) and 22 NC for further study. In the study, we used DTI data to analyze the early white matter microstructure changes of patients with aMCI and normal elderly. Then binomial logistic regression was used to figure out the features that can predict the development trajectory of the aMCI patients.
FA registration result
We checked the registration results one by one. The red outline is the border of the template and the background image is the normalized FA in MNI space. We checked whether the tissue border of the background image is in correspondence to the red lines one by one. All the registration results were very good. Figure 2 shows examples of randomly selected registration results.
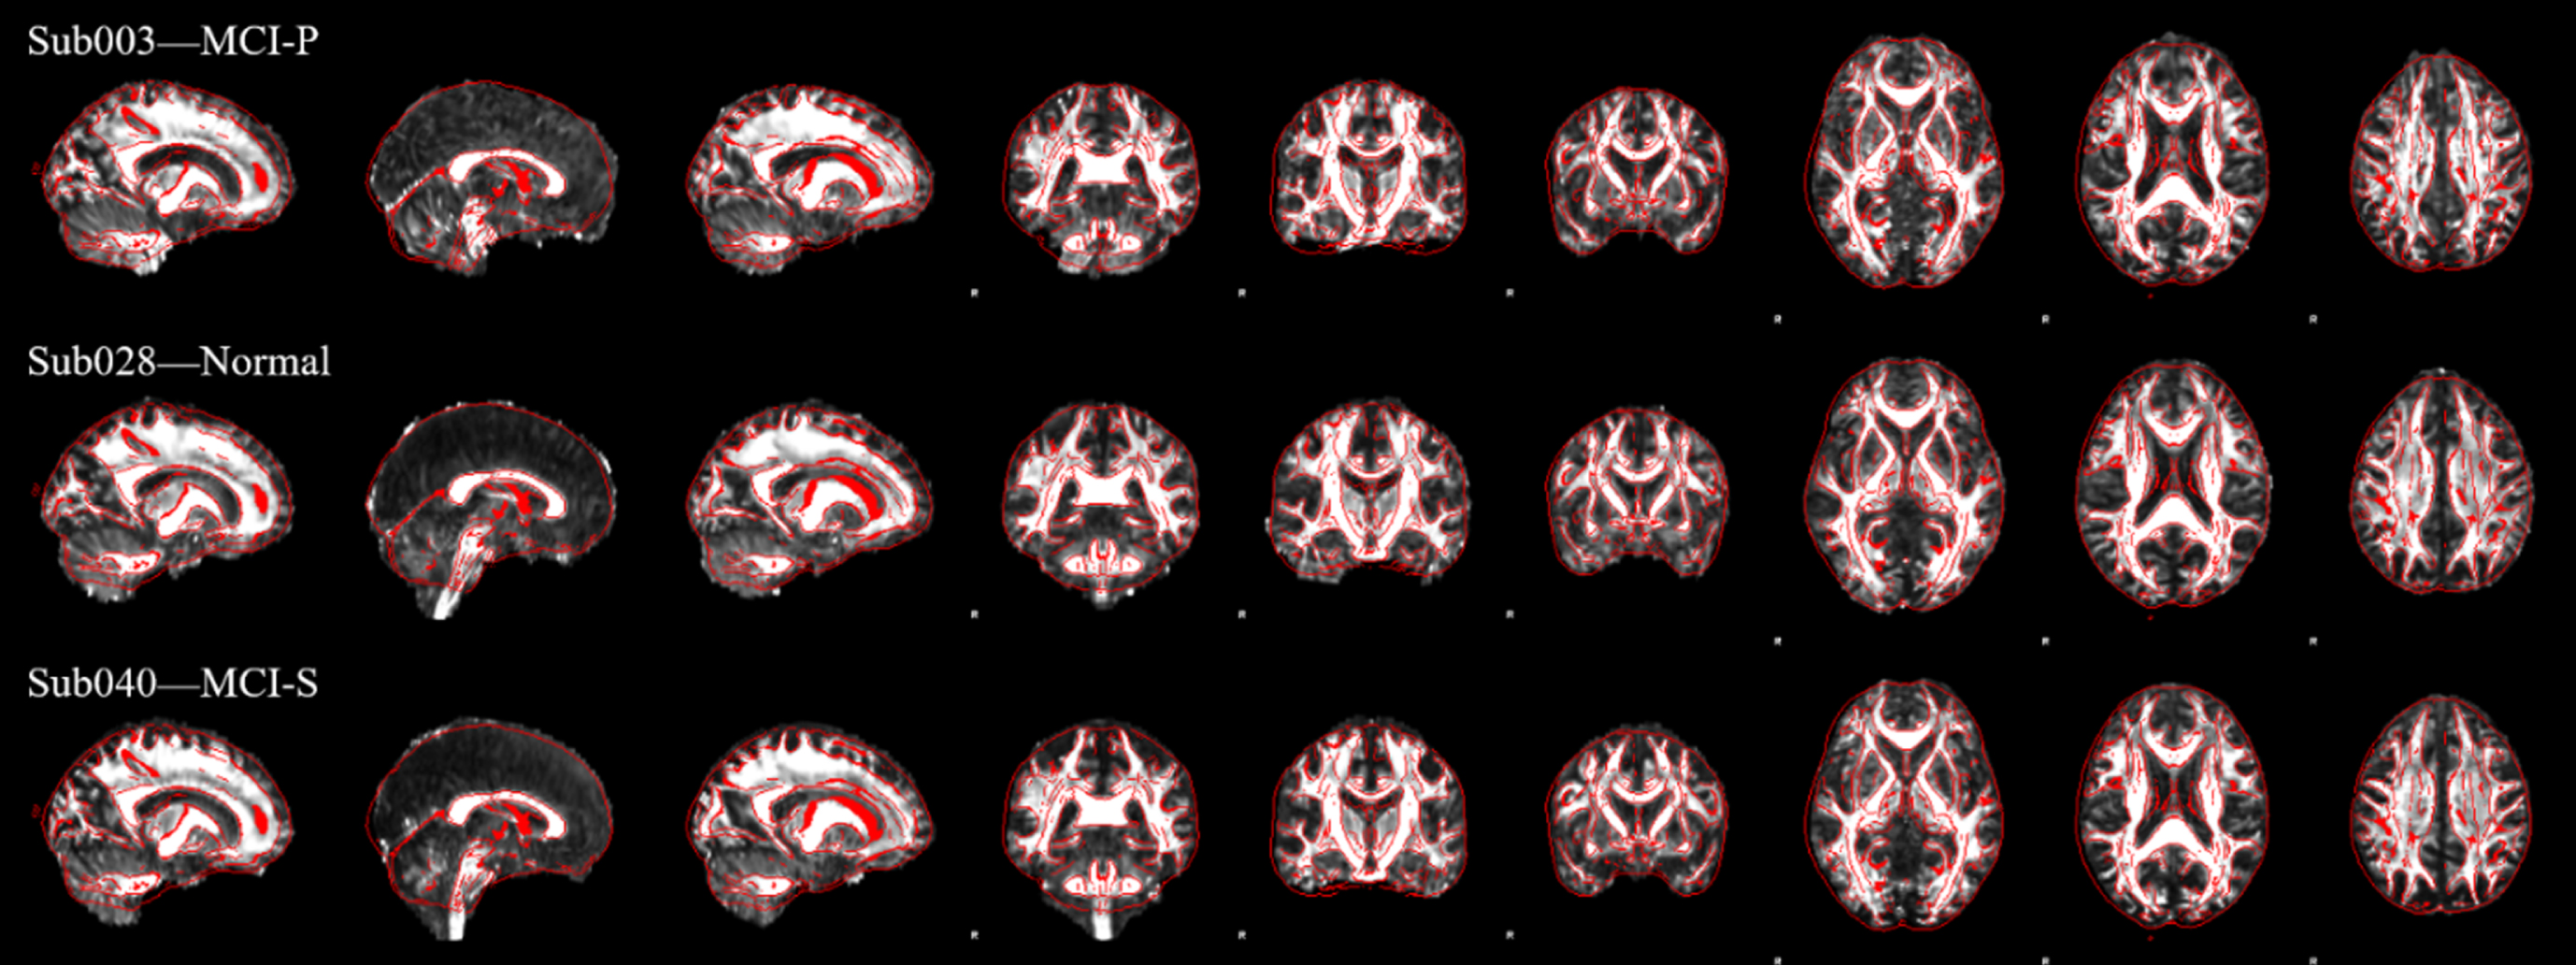
Examples of FA registration results. The figure shows examples of registration results of randomly selected subjects. Red is the outline of the standard template, and the background image is the result of matching the FA image to the standard template. FA, fraction anisotropy.
Brain white matter microstructure changes of the three groups
The average fiber bundle signal of 50 ROIs was extracted based on the Johns Hopkins University (JHU) White Matter Atlas (rICBM_DTI_81_WMPM_FMRIB58 [40]). One-way ANOVA was used on the DTI baseline data of FA and MD values of each brain area to compare the differences of the white matter microstructure among the MCI-P, MCI-S, and the NC groups. The brain areas that differed among groups were mainly located in the cingulate gyrus, hippocampus, fornix, and hook bundle. The FA values of these brain regions decreased in the two MCI groups and the MCI-P group presented a larger decline than that of the MCI-S group. There were significant statistical differences between MCI-P versus NC and MCI-S groups. However, there were no significant differences between MCI-S and NC (shown in Fig. 3). Pearson correlation analysis was shown in Fig. 4. The changes of FA values in the cingulate gyrus, hippocampus, right fornix, and right uncinate fasciculus regions were positively correlated with the MMSE scores.

The identified brain regions of significantly changed FA values among the MCI-P and the MCI-S and the NC groups. From (a) to (f) shows the changed FA values of the brain regions identified by ANOVA. The brain regions have the same codes corresponding to that in Table 3. FA, fraction anisotropy; MCI-P, MCI patients who convert to AD; MCI-S, MCI patients who remain in MCI status; NC, normal controls; L, left; R, right and *p < 0.05).
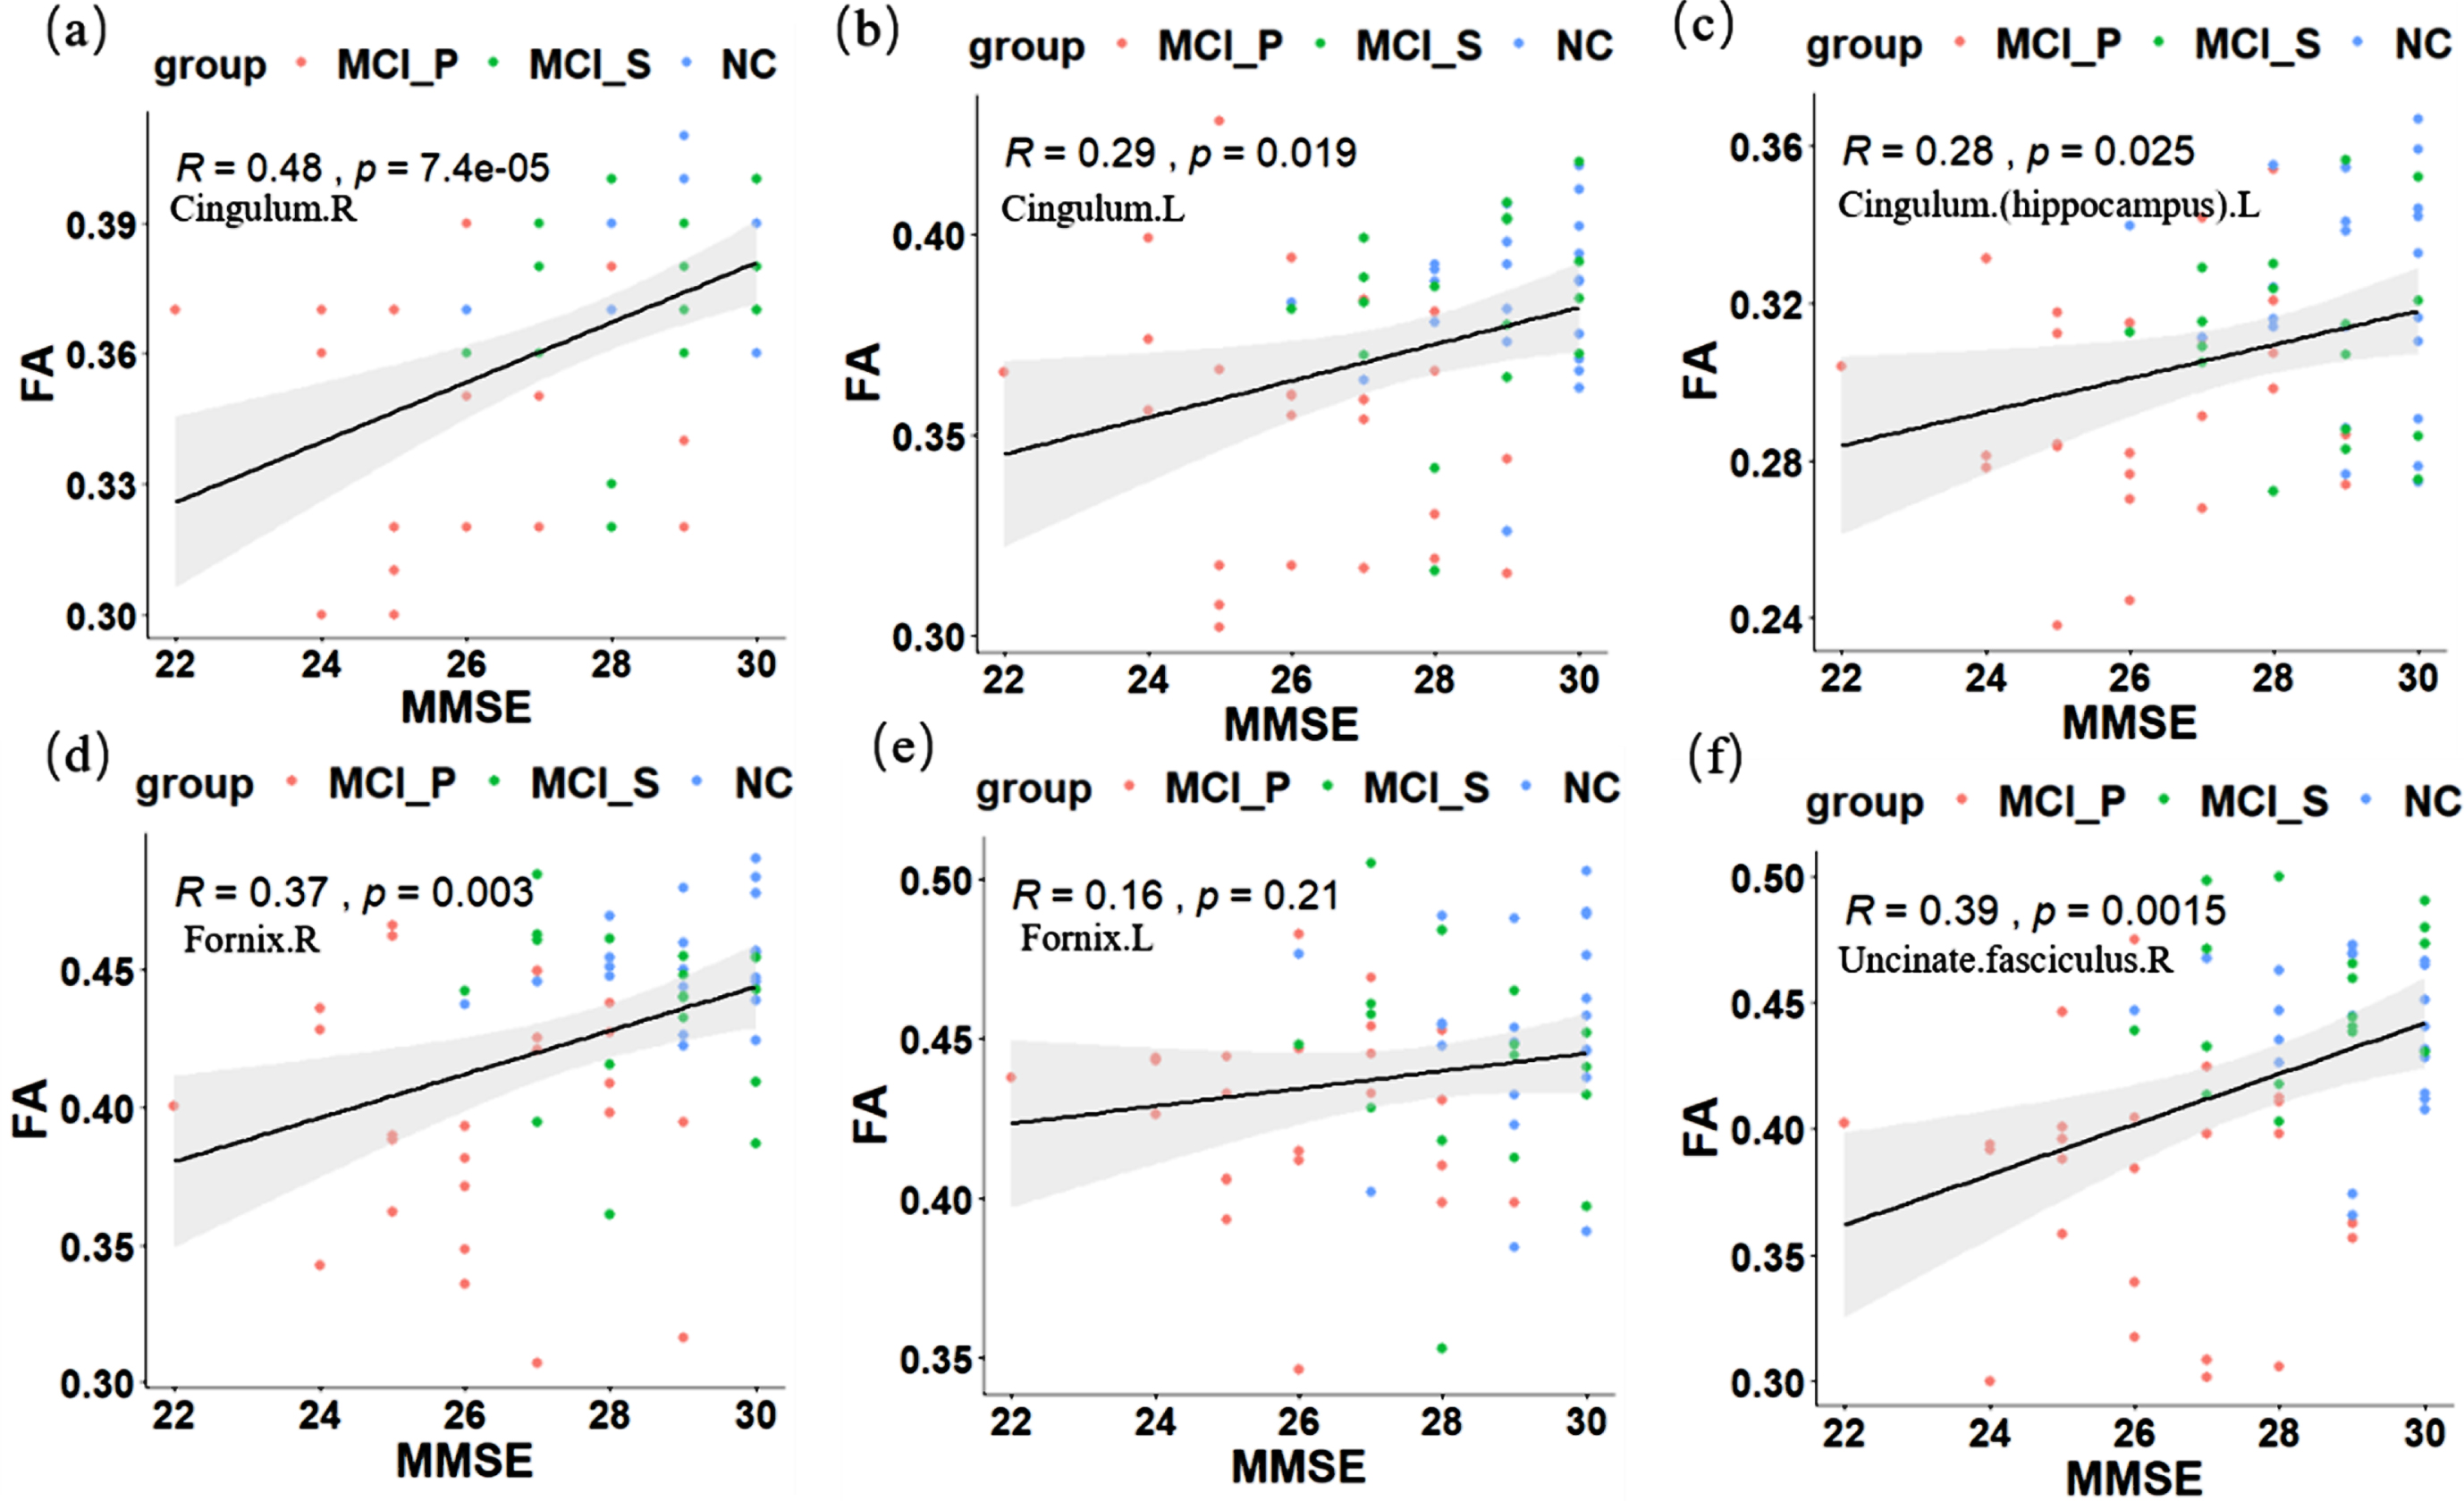
Pearson correlation analysis between FA values and MMSE scores. The brain regions have the same codes corresponding to that in Table 3. FA, fraction anisotropy; MMSE, Mini-Mental State Examination; MCI-P, MCI patients who convert to AD; MCI-S, MCI patients who remain in MCI status; NC, normal controls; L, left; R, right.
Post-hoc analysis of six significantly changed FA values
p is the difference between the three group subjects obtained by One-Way ANOVA. Post-hoc analysis was obtained by the Wilcoxon rank-sum test analysis. *Indicates that the post-hoc analysis was statistically significant, p < 0.05. No a-f, correspond to a-f in Figs. 4. FA, fraction anisotropy; MCI, mild cognitive impairment; MCI-P, MCI patients who convert to AD; MCI-S, MCI patients who remain in MCI status; NC, normal controls; R, right; L, left.
As is shown in Fig. 5, compared with the NC group, we found that MD values of 10 brain regions were higher in the two aMCI groups. The post-hoc analysis revealed that only the MCI-P group showed a significant increase to the NC group whereas there was no statistical difference between the MCI-S and NC groups. These altered brain areas were mainly located in the cingulate gyrus, posterior thalamus, hippocampus, fornix, and unciform fasciculus (see Table 4 for more information). Figure 6 shows the MD values of the left posterior thalamic radiation (Posterior. thalamic. radiation. L), bilateral hippocampus, uncinate. fasciculus and fornix were significantly negatively correlated with MMSE scores.
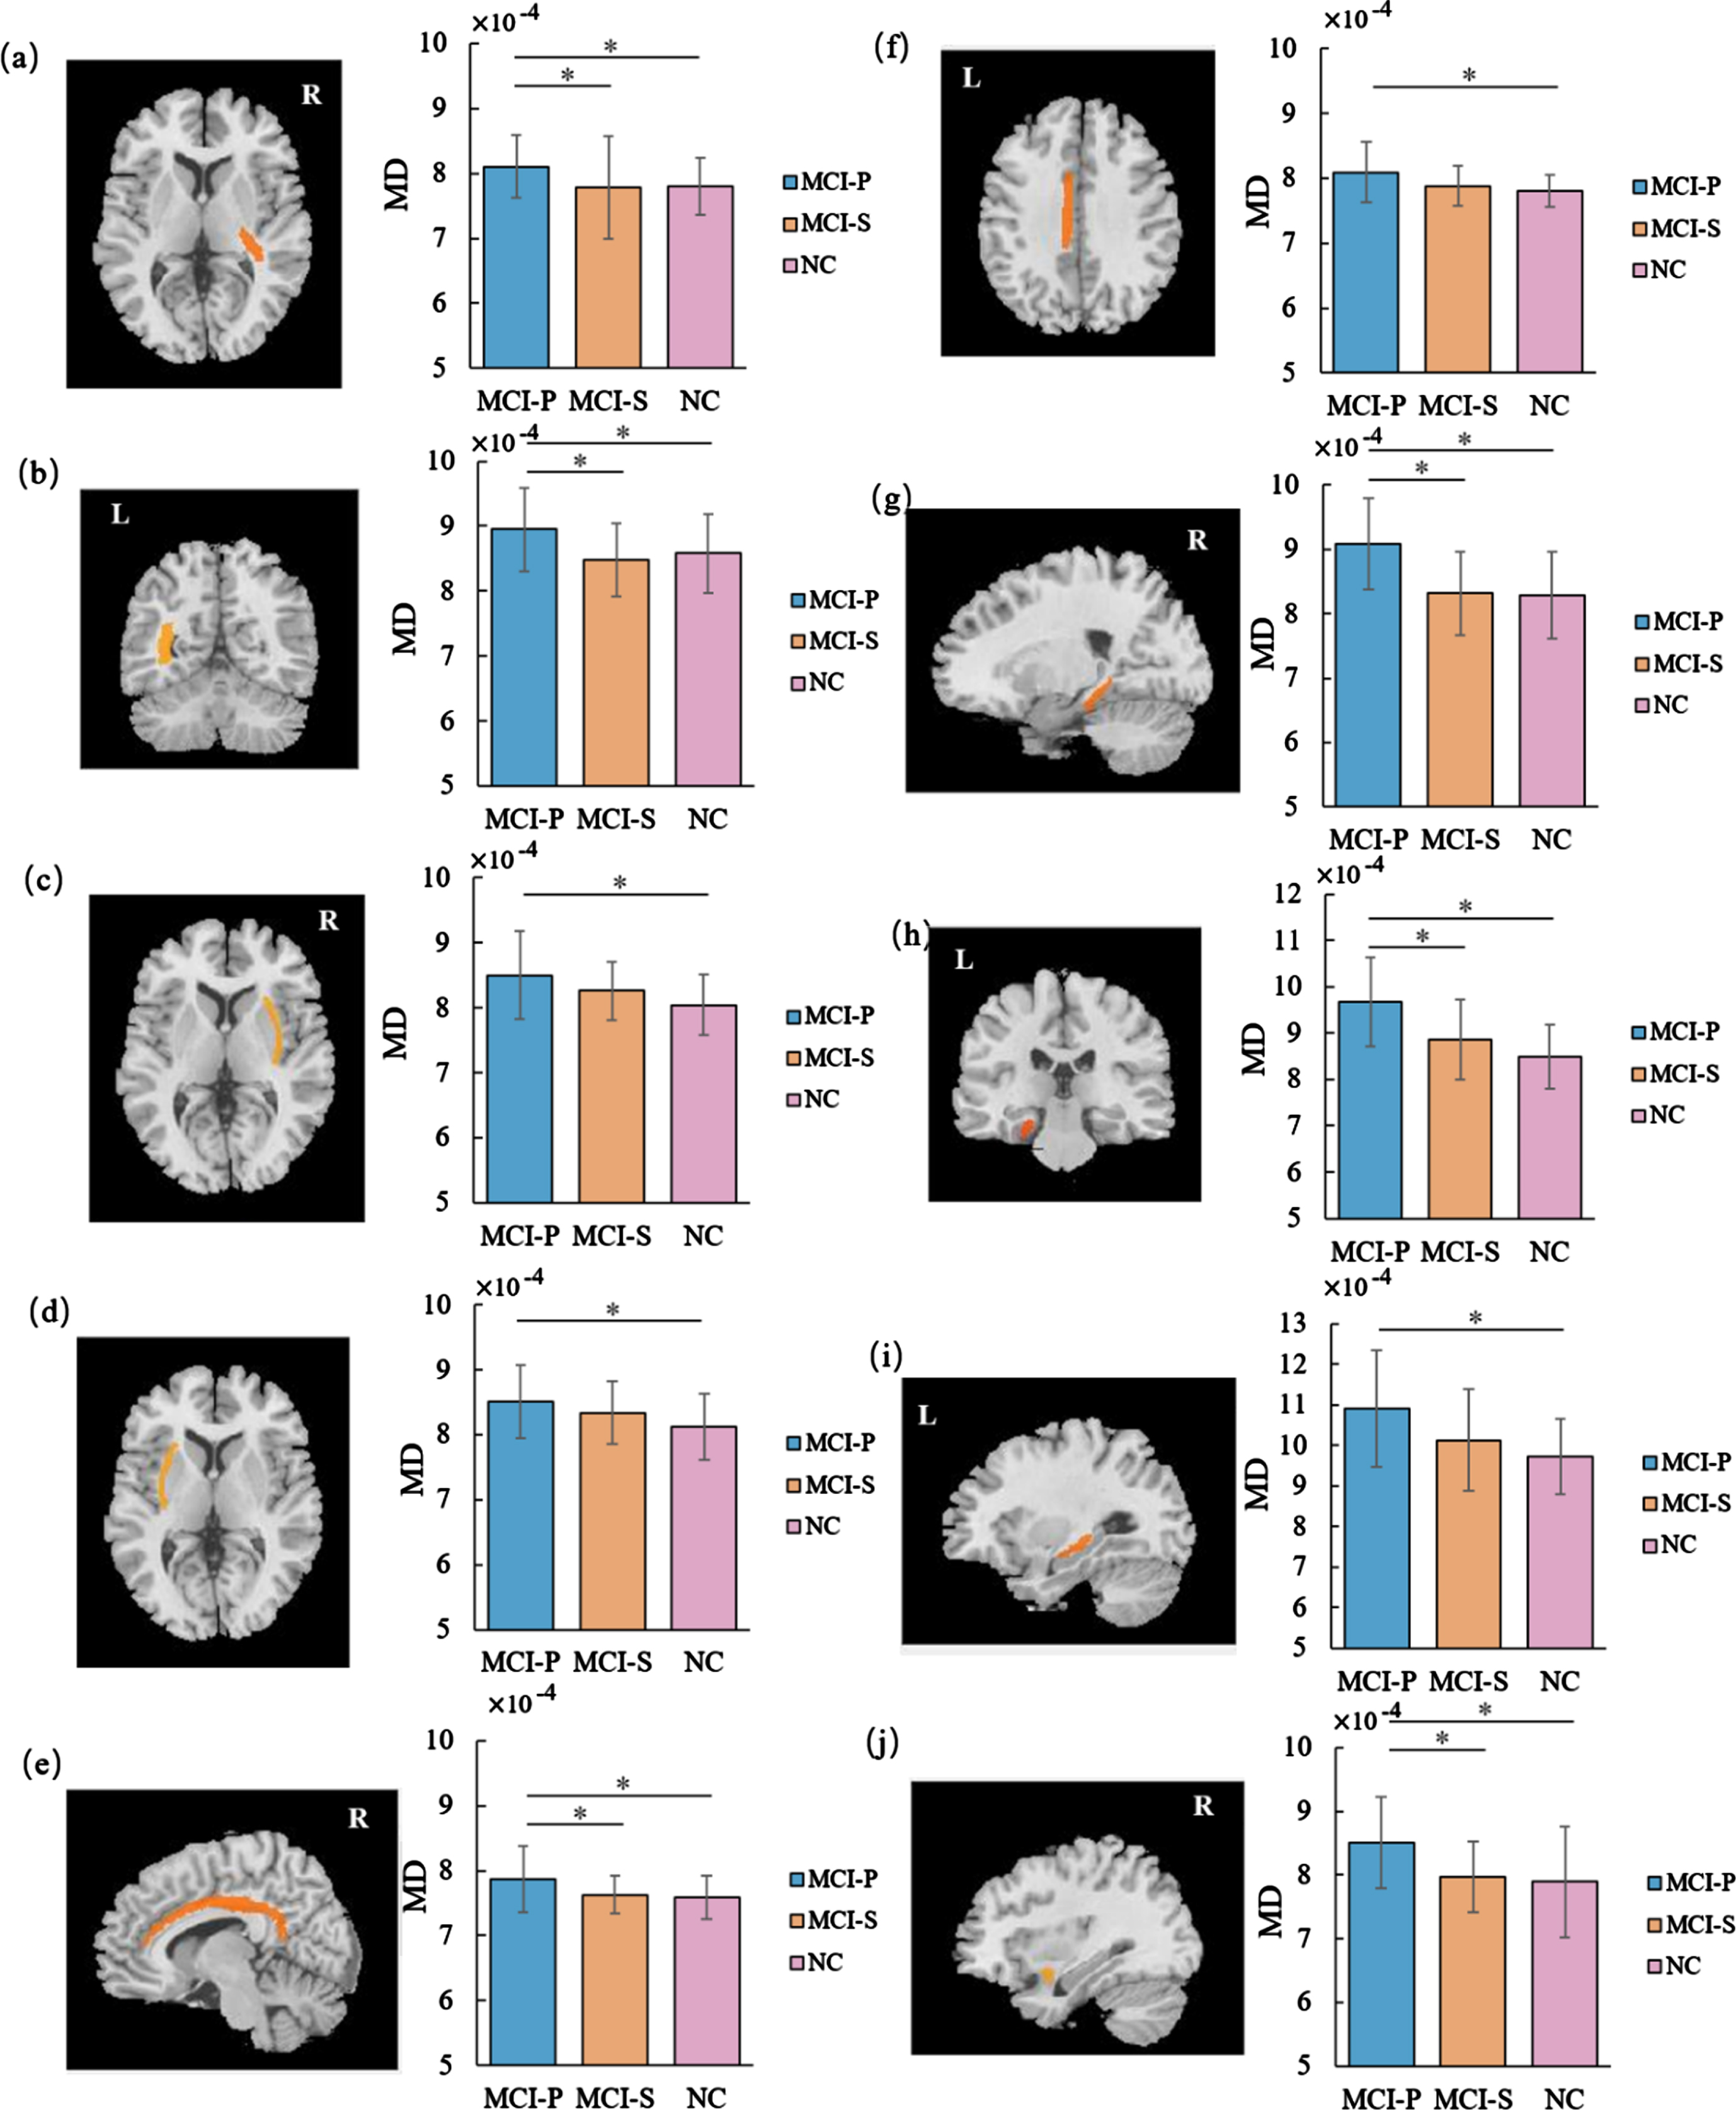
The identified brain regions of significantly changed MD values among the MCI-P and the MCI-S and the NC groups. Figure (a)∼(j) changed MD values of the brain regions identified by ANOVA. Same brain region codes were used as in Table 4. MD, mean diffusivity; MCI-P, MCI patients who convert to AD; MCI-S, MCI patients who remain in MCI status; NC, normal controls; L, left; R, right. *p < 0.05.
Post-hoc analysis of 10 significantly changed MD values
p is the difference between the three group subjects obtained by one-way ANOVA, the post-hoc analysis obtained by the Wilcoxon rank-sum test analysis, *means p < 0.05. the numbers a∼j correspond to the same codes in Figs. 6. MD, mean diffusivity; MCI, mild cognitive impairment; MCI-P, MCI patients who convert to AD; MCI-S, MCI patients who remain in MCI status; NC, normal controls; R, right; L, left.
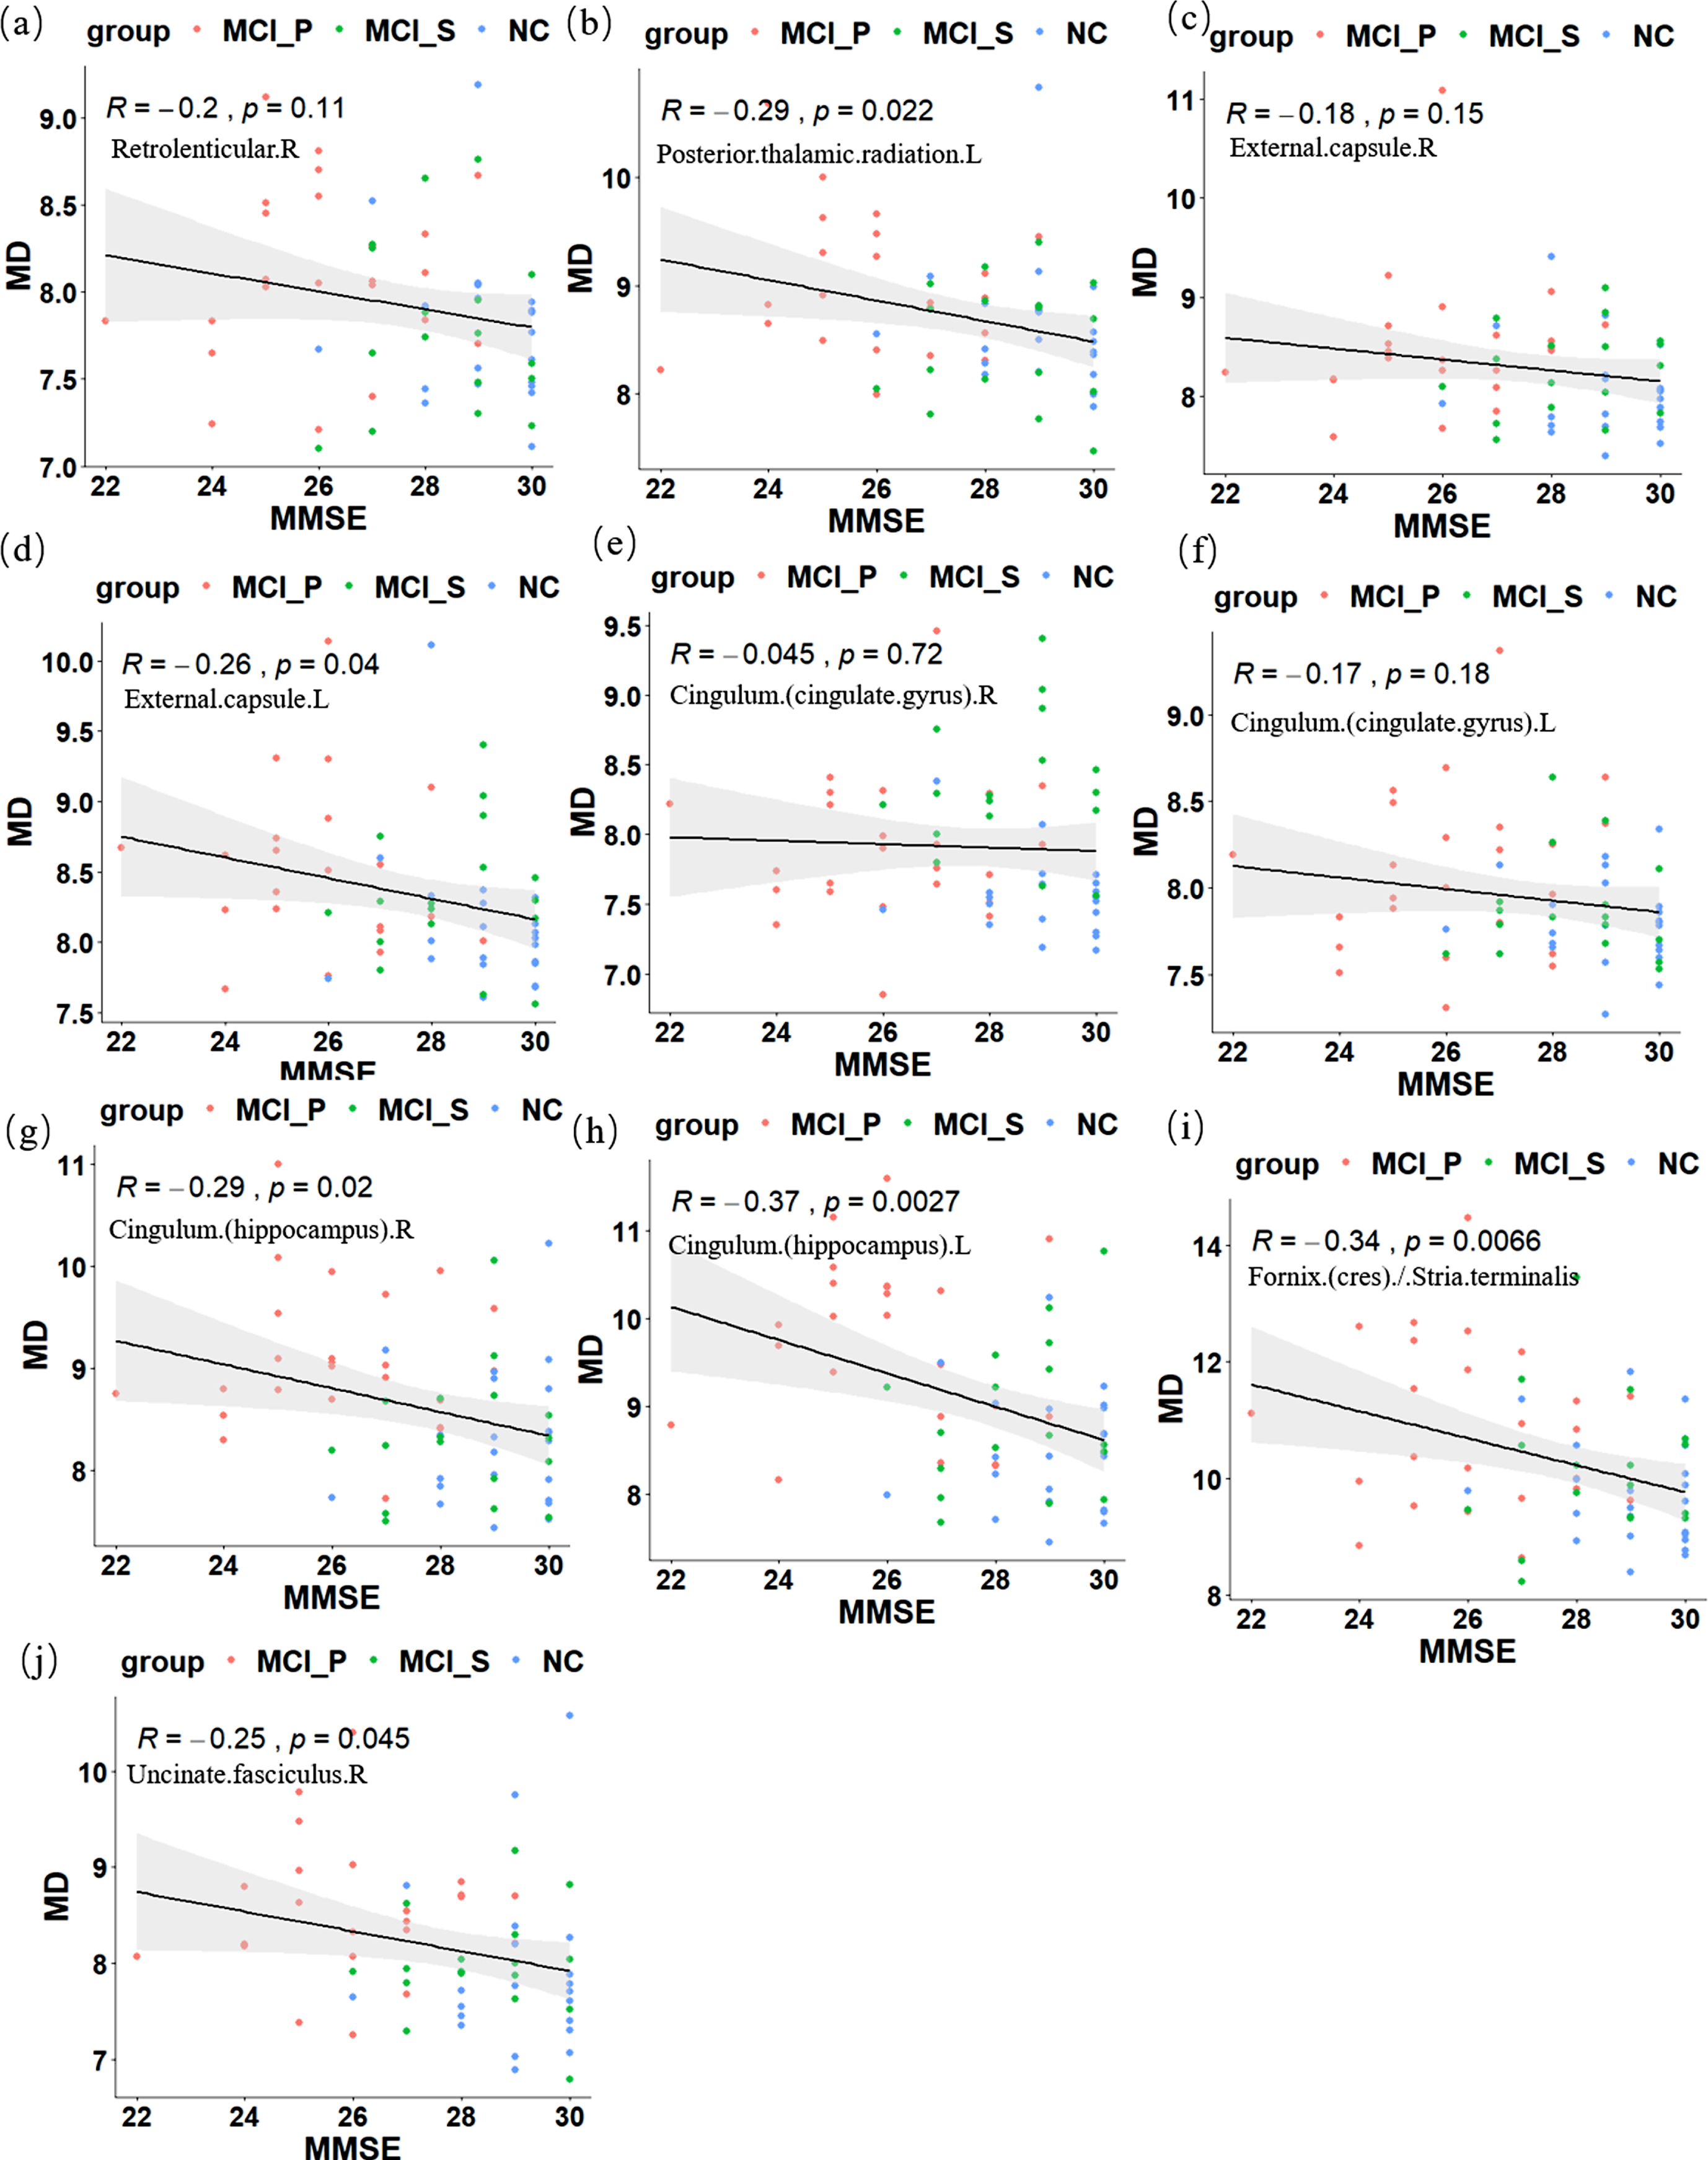
Pearson correlation analysis between MD values and MMSE scores. The brain regions have the same codes corresponding to that in Table 3. MD, mean diffusivity; MMSE, Mini-Mental State Examination; MCI-P, MCI patients who convert to AD; MCI-S, MCI patients who remain in MCI status; NC, normal controls; L, left; R, right.
Longitudinal prediction of the MCI development trajectory
We used the MMSE score combined with the characteristic values of the brain white matter microstructure to predict whether the patients would convert to AD. Binomial logistic regression analysis was adopted. MMSE scores, FA and MD values from brain regions with statistical differences were used as the predicted feature values. Age and gender were used as confounding factors. The results showed that neither age nor gender extended any influence on AD progression (p > 0.05). Table 5 shows prediction accuracy with different input factors. When the MMSE scores and FA values were selected as predictors, the prediction accuracy was 73.2%. The FA value of the right cingulate gyrus (Cingulum. (Cingulate gyrus). R,) could significantly affect whether MCI individuals would convert to AD (p = 0.016). When selecting MMSE scores and MD values as predictors, the accuracy was 82.9%. Among the 6 input MD values, only the MD value of the right hippocampus could significantly impact the conversion from MCI to AD (p = 0.032). Finally, when MMSE scores, FA, and MD values were all selected as predictors, the accuracy increased to 90.2%, and both FA values of the right cingulate gyrus (p = 0.029), as well as right hippocampus (p = 0.021), presented significant influence on the prediction.
The prediction results of the progression of MCI into AD by different input features.
Interval estimation refers to calculating an interval according to a predetermined probability. *Means p < 0.05. OR, odds ratio; CI, confidence interval; MCI, mild cognitive impairment; AD, Alzheimer’s disease; MMSE, Mini-Mental State Examination; FA, fraction anisotropy; MD, mean diffusivity; R, right.
DISCUSSION
In this study, we compared the microstructure differences of white matter fiber bundles in 50 brain regions in subjects among MCI-P, MCI-S, and the NC group. We found that compared with the NC group, both MCI-P and MCI-S groups exhibited changes in the microstructure of the white matter fiber bundles but with significantly different magnitude. Pearson correlation analysis showed that the changes in the unciform fasciculus, cingulate gyrus, hippocampus, and fornix significantly correlated with the MMSE score. At last, binomial logistic regression analysis was adopted to do prediction on the development trajectory of aMCI. The FA value of the right cingulate gyrus and the MD value right hippocampus were shown to have a significant impact on the prediction. So, the microstructure change of the two brain regions may be a potential biomarker of the prediction of the clinical development trajectory of the aMCI.
DTI is very sensitive to the change of brain white matter fiber bundles. Studies have shown that DTI of the brain could reflect the clinical memory performance of MCI patients [26, 42]. Also, research indicated that FA reduction could provide information for neuropathology [43]. The FA reduction is a result of the reduction of white matter organization caused by various microstructure changes, such as demyelination, axon degradation, or glial degeneration [44–47]. MD value is more sensitive to degenerative neuropathy, and the increase in MD may be due to the decrease of cell membrane density caused by cell aging [44].
Our results showed that compared with NC, patients with aMCI showed a significantly changed white matter microstructure. Among the brain regions where the FA value decreased, the significantly changed brain regions mainly included the cingulate gyrus, hippocampus, fornix, and unciform fasciculus. Besides the above-motioned brain region, MD values also significantly increased in the posterior thalamic projection area in the aMCI patients. These results were consistent with previous researches [26, 49]. The hippocampus is involved in memory formation and the unciform fasciculus belongs to the limbic system, which is the channel for the combination of white matter in the human brain, connecting the frontal lobe (such as the orbitofrontal cortex), and limbic system, such as the parahippocampal gyrus and amygdala in temporal lobe [50]. Studies have shown that the unciform fasciculus was related to functions such as memory storage and redirecting frontal lobe decision-making [51]. The cingulate bundle and fornix are C-shaped white matter fiber bundles, which also play a connection role, mainly connecting the hippocampus and the limbic system, such as the amygdala and hypothalamus [52]. In addition, the cingulate bundle connects the hippocampus and the cortex, the parietal lobe, and the frontal lobe [53]. The fornix connects the amygdala and the cortex also connects to the medial prefrontal lobe [53]. The cingulate bundle is involved in working memory, attention, and other cognitive functions. The damage to the hippocampus, cingulate bundles, fornix, and other connecting structures of the patient’s brain may affect the information transmission between different brain regions in the brain, thus causing a wide range of cognitive dysfunction. Post-hoc analysis showed that, at similar ages, the changes in brain microstructure of the MCI-P were statistically different from those of the MCI-S and the NC. Although MCI-S have decreased FA values and increased MD values in these brain areas compared with NC, some of the changes had no statistically significant. This might be a possible reason why MCI-S patients did not convert to AD. MCI-S patients only have a greater decline in cognitive abilities such as memory loss compared with normal aging. However, this kind of damage may not be as severe as the pathological damage shown by the MCI-P, which damage will gradually extend to other brain areas over time, and seriously affect patients’ other cognitive functions and physiological function.
Previous studies have shown that the white matter fiber bundles of the brain were highly sensitive to changes in cognitive function [54]. Oishi et al. found that the damage of the fornix gradually became more serious with the development of AD [30, 55]. Therefore, we then studied the relationship between the brain regions with FA and MD changes and the patient’s MMSE scores. Pearson correlation analysis showed that these significantly changed brain regions were related to the severity of aMCI. Among them, FA values of the cingulate gyrus, hippocampus, and unciform fasciculus were positively correlated with MMSE score (p < 0.05), while the MD values of the hippocampus, unciform fasciculus, and fornix region were negatively correlated with MMSE scores (p < 0.05). These results implied that MCI-P and MCI-S showed different damage degrees of white matter microstructure.
Finally, we used the binomial logistic regression analyses to explore aMCI clinical development trajectory. We chose the significantly altered FA and MD values as input index to do the prediction. When combined MMSE scores, FA and MD values together, the accuracy is 90.2%. The FA value of the right cingulate bundle and the MD value of the right hippocampus was found to have a significant impact on the prediction. Similarly, Gold et al. used support vector machines to classify patients with MCI and showed that when the cingulate gyrus was added as a classification index, the classification accuracy can be increased to 91%[56]. Li et al. supported that when cognitive related white matter fiber was used as a classification index, the MD value of the cingulate gyrus was the most important in the classification process, and it presented the greatest contribution to the classification [57, 58]. Such results showed that the cingulate gyrus and hippocampus are more sensitive to the clinical development trajectory of aMCI. The characteristic value of the cingulate gyrus and hippocampus might be used as a potential biomarker to assist in predicting the future development of aMCI patients.
Limitations and future considerations
There are several limitations to this study. First, the study mainly focused on the DTI features, since AD is closely related to amyloid burden and APOE4 carriers, future research should combine genotype analysis or bioanalysis to elucidate the fundamental pathology of AD. Second, the sample size is also a critical limitation in our study, the small sample size may have confined the statistical results and provided little information for classification. Finally, given the evidence that the AD patients showed widespread grey matter atrophy throughout the brain, it would be necessary to investigate the relationship between the altered structure (e.g., grey matter atrophy, white matter hyperintensities) and the progress of the disease in future studies.
CONCLUSION
This study revealed that both MCI-P and MCI-S groups exhibited changes in the microstructure of the white matter fiber bundles but with significantly different magnitude. The altered brain regions are mainly located in the hippocampus, fornix, cingulate bundle, and uncinate fasciculus. The characteristic values of these areas present a sufficient correlation with the MMSE score. FA value of the right side of the cingulate gyrus and MD value of the right hippocampus is more sensitive to the disease progression and might be used as potential biomarkers to predict the development trajectory of the aMCI patients in the future.
Footnotes
ACKNOWLEDGMENTS
The study was financially supported by the National Natural Science Foundation of China (Grant No. 31972907, U1913216, 61806210 and 61431012), Natural Science Basic Research Program of Shaanxi (Program No.2020JQ-096). We feel grateful for the doctors and staff who have been involved in this work.
Data collection and sharing for this project were funded by the Alzheimer’s Disease Neuroimaging Initiative (ADNI) (National Institutes of Health Grant U01AG024904) and DODADNI (Department of Defense award number W81XWH-12-2-0012). ADNI is funded by the National Institute on Aging, the National Institute of Biomedical Imaging and Bioengineering, and through generous contributions from the following: AbbVie, Alzheimer’s Association; Alzheimer’s Drug Discovery Foundation; Araclon Biotech; BioClinica, Inc.; Biogen; Bristol-Myers Squibb Company; CereSpir, Inc.; Cogstate; Eisai Inc.; Elan Pharmaceuticals, Inc.; Eli Lilly and Company; EuroImmun; F. Hoffmann-La Roche Ltd and its affiliated company Genentech, Inc.; Fujirebio; GE Healthcare; IXICO Ltd.; Janssen Alzheimer Immunotherapy Research & Development, LLC.; Johnson & Johnson Pharmaceutical Research & Development LLC.; Lumosity; Lundbeck; Merck & Co., Inc.; Meso Scale Diagnostics, LLC.; NeuroRx Research; Neurotrack Technologies; Novartis Pharmaceuticals Corporation; Pfizer Inc.; Piramal Imaging; Servier; Takeda Pharmaceutical Company; and Transition Therapeutics. The Canadian Institutes of Health Research is providing funds to support ADNI clinical sites in Canada. Private sector contributions are facilitated by the Foundation for the National Institutes of Health (![]() ). The grantee organization is the Northern California Institute for Research and Education, and the study is coordinated by the Alzheimer’s Therapeutic Research Institute at the University of Southern California. ADNI data are disseminated by the Laboratory for Neuro Imaging at the University of Southern California.
). The grantee organization is the Northern California Institute for Research and Education, and the study is coordinated by the Alzheimer’s Therapeutic Research Institute at the University of Southern California. ADNI data are disseminated by the Laboratory for Neuro Imaging at the University of Southern California.