
Abstract
Background:
Scan acceleration techniques, such as parallel imaging, can reduce scan times, but reliability is essential to implement these techniques in neuroimaging.
Objective:
To evaluate the reproducibility of the longitudinal changes in brain morphology determined by longitudinal voxel-based morphometry (VBM) between non-accelerated and accelerated magnetic resonance images (MRI) in normal aging, mild cognitive impairment (MCI), and Alzheimer’s disease (AD).
Methods:
Using data from the Alzheimer’s Disease Neuroimaging Initiative (ADNI) 2 database, comprising subjects who underwent non-accelerated and accelerated structural T1-weighted MRI at screening and at a 2-year follow-up on 3.0 T Philips scanners, we examined the reproducibility of longitudinal gray matter volume changes determined by longitudinal VBM processing between non-accelerated and accelerated imaging in 50 healthy elderly subjects, 54 MCI patients, and eight AD patients.
Results:
The intraclass correlation coefficient (ICC) maps differed among the three groups. The mean ICC was 0.72 overall (healthy elderly, 0.63; MCI, 0.75; AD, 0.63), and the ICC was good to excellent (0.6–1.0) for 81.4%of voxels (healthy elderly, 64.8%; MCI, 85.0%; AD, 65.0%). The differences in image quality (head motion) were not significant (Kruskal–Wallis test, p = 0.18) and the within-subject standard deviations of longitudinal gray matter volume changes were similar among the groups.
Conclusion:
The results indicate that the reproducibility of longitudinal gray matter volume changes determined by VBM between non-accelerated and accelerated MRI is good to excellent for many regions but may vary between diseases and regions.
Keywords
INTRODUCTION
In recent years, longitudinal structural magnetic resonance imaging (MRI) has become widely used to estimate the rate of brain atrophy during normal aging and in a variety of neurodegenerative disorders. Between-subject morphological differences are usually significantly greater than the within-subject morphological changes. Extensive between-subject variability in brain morphology reduces the sensitivity for detecting changes in brain morphology. Longitudinal structural MRI reduces the variability associated with the between-subject differences in brain morphology by using the individual subjects as their own controls. This may avoid some of the problems caused by secular trends and between-subject variation. However, the statistical power to detect changes in brain morphology can be limited by measurement errors. Nevertheless, to quantify the changes in brain morphology from serial MRI scans in a precise manner, it is important that the acquisition conditions at baseline and at subsequent scans are as similar as possible.
Sufficient reliability is essential when using neuroimaging as a potential biomarker of neurodegenerative disorders, especially when monitoring longitudinal changes and treatment effects. Many previous studies have evaluated the reliability of structural T1-weighted imaging [1–15] and diffusion imaging [16–23]. Scan acceleration techniques, such as parallel imaging, can reduce scan times and are especially useful in subjects who cannot tolerate longer scans, and are therefore widely used in neuroimaging. Parallel imaging shortens scan times (typically by a factor of 2 to 3) by a reduction in the number of phase-encoding steps during image acquisition using the spatial information inherent in receiver coils. On the other hand, shorter scan times may cause a reduced signal-to-noise ratio and parallel imaging relies on the accuracy of the coil calibration data. However, few studies have investigated the effects of scan acceleration on the estimated longitudinal changes in brain morphology [24–28]. In addition, we are unaware of any studies that have fully investigated the reproducibility of longitudinal changes in brain morphology between non-accelerated and accelerated imaging on a voxel-wise basis. It is also unclear whether the type of disease affects the reproducibility.
We obtained 3.0 T structural T1-weighted MRI data from the Alzheimer’s Disease Neuroimaging Initiative (ADNI) database to determine the reproducibility (i.e., variation due to different scan sequences) of the longitudinal (2-year) changes in brain morphology, measured by longitudinal voxel-based morphometry (VBM), between non-accelerated and accelerated scans in healthy elderly subjects, patients with mild cognitive impairment (MCI), and patients with Alzheimer’s disease (AD).
MATERIALS AND METHODS
Subjects
This study used data from the ADNI 2 database (available at http://adni.loni.usc.edu) comprising subjects who underwent non-accelerated and accelerated structural T1-weighted MRI at screening and at a 2-year follow-up (i.e., 2 [1 non-accelerated and 1 accelerated] scans×2 time-points per subject) on 3.0 T Philips scanners. The study included 112 subjects: 50 healthy control subjects, 54 patients with MCI, and eight patients with AD. The mean age (range) at screening was 72.3±6.3 years (healthy control subjects, 72.5±5.4 years [64.1–83.7 years]; patients with MCI, 71.2±6.8 years [56.7–88.7 years]; patients with AD, 78.1±5.5 years [70.3–86.6 years]). The mean scan interval (range) was 2.1±0.1 years (healthy control subjects, 2.1±0.1 years [1.9–2.4 years]; patients with MCI, 2.0±0.1 years [1.8–2.2 years]; patients with AD, 2.0±0.04 years [2.0–2.1 years]).
The ADNI was launched in 2003 as a public–private partnership, led by the Principal Investigator Michael W. Weiner, MD. The primary goal of ADNI was to test whether serial MRI, positron emission tomography (PET), other biological markers, and clinical and neuropsychological assessment can be combined to measure the progression of MCI and early AD. The ADNI was approved by the institutional review boards of all participating sites. Written informed consent was obtained from all participants.
Imaging data acquisition
MRI scans were performed using 3.0 T Philips scanners at multiple sites and the same ADNI 3.0 T imaging protocol (http://adni.loni.usc.edu). Various models of scanners were used, but each subject was scanned at screening and follow-up using the same scanner. Non-accelerated structural T1-weighted images were acquired using a three-dimensional (3D) magnetization-prepared rapid gradient-echo (MP-RAGE) sequence in 170 sagittal slices (repetition time = 6.8 ms; echo time = 3.1 ms; inversion time = 900 ms; flip angle = 9°; field of view =256×240 mm; slice thickness = 1.2 mm with no gap; acquisition matrix = 256×240; image matrix =256×256; reconstructed voxel size = 1.0×1.0×1.2 mm; scan time = 9 : 06). Accelerated structural T1-weighted images were acquired using the 3D MP-RAGE sequence with sensitivity encoding (SENSE) acceleration (phase reduction = 1, phase oversampling factor = 1.5, slice reduction = 1.8) in 170 sagittal slices (repetition time = 6.8 ms; echo time = 3.1 ms; inversion time = 900 ms; flip angle = 9°; field of view = 270×253 mm; slice thickness = 1.2 mm with no gap; acquisition matrix = 244×227; image matrix= 256×256; reconstructed voxel size = 1.05×1.05×1.2 mm; scan time = 5 : 34). B1 non-uniformity correction was integrated into the sequences and correction for gradient non-linearity distortion was not applied because of the linearity of Phillips gradient systems. The non-parametric non-uniform intensity normalization algorithm N3 was used to correct the MP-RAGE images for non-uniform intensity [29–31].
The quality of the MP-RAGE images was subjectively graded as good, adequate, or poor by three radiologists with 21 (H.T.), 10, and 2 years of experience in neuroradiology independently and in a blinded manner. In case of disagreements, final evaluations were made by consensus.
Image processing
Image processing was primarily performed using statistical parametric mapping (SPM) 12 software developed in the Wellcome Department of Imaging Neuroscience, Institute of Neurology, University College London and MATLAB 9.1 (Mathworks, Sherborn, MA). The image processing steps described below are summarized in Fig. 1.
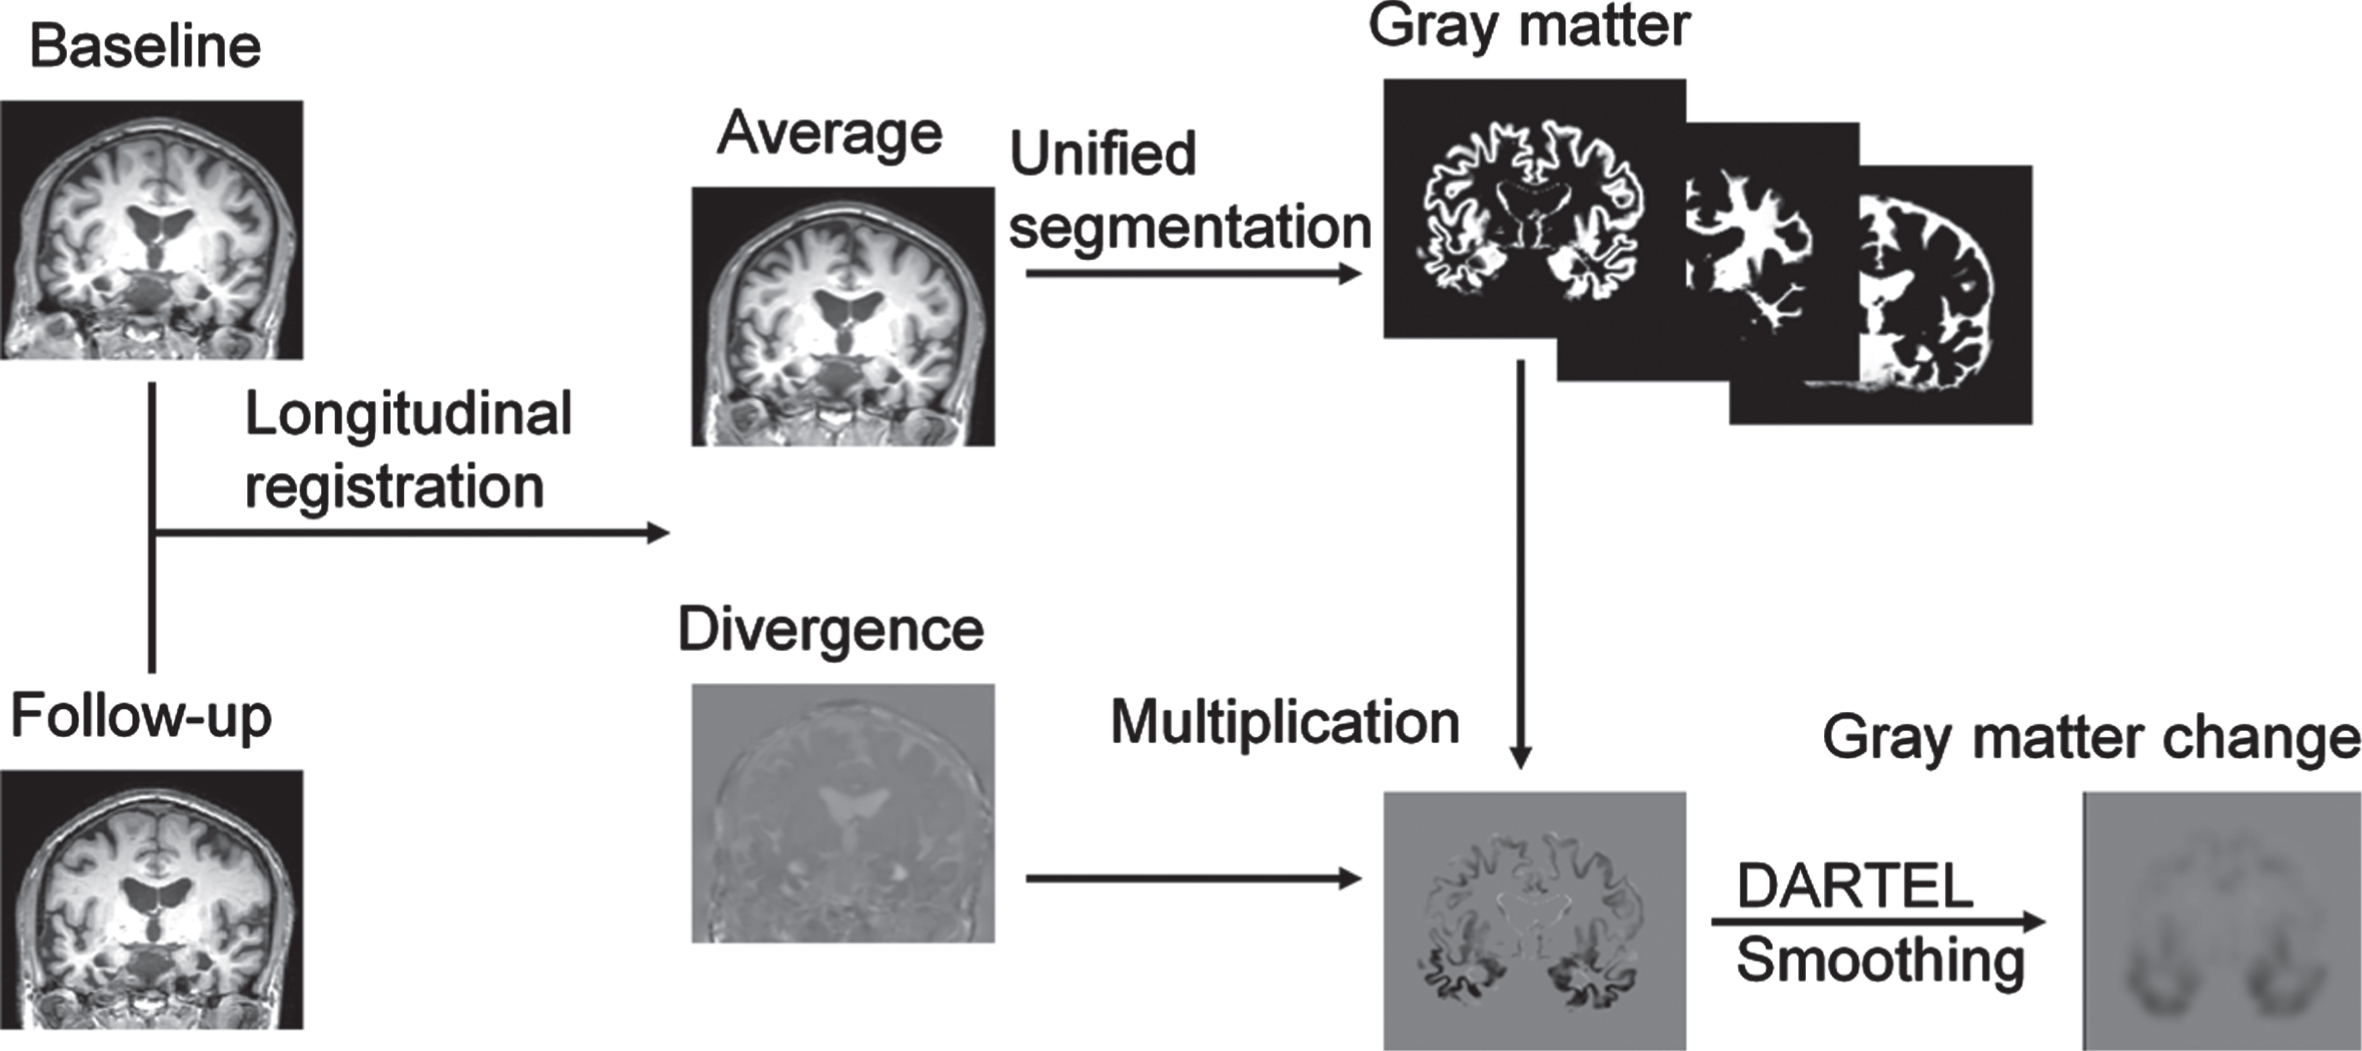
Overview of the longitudinal voxel-based morphometry (VBM) conducted using statistical parametric mapping (SPM) 12 software. DARTEL, Diffeomorphic Anatomical Registration Through Exponentiated Lie Algebra.
Longitudinal registration of pairs (obtained at screening and 2 years later) of MP-RAGE images was performed by pairwise inverse-consistent alignment between the first and second scans for each subject, while incorporating bias field correction [32] to calculate the mid-point average images and to map the divergences in velocity fields (representing the rates of volumetric expansion/contraction). The mid-point average images were segmented into gray matter, white matter, and cerebrospinal fluid using the unified segmentation algorithm [33], and using the International Consortium for Brain Mapping gray matter, white matter, cerebrospinal fluid, bone, soft tissue, and air/background templates as priors. The segmented gray matter and white matter images, and the maps of longitudinal gray matter volume changes, which were calculated by multiplying the gray matter images by the divergence maps, were spatially normalized using the Diffeomorphic Anatomical Registration Through Exponentiated Lie Algebra (DARTEL) algorithm [34]. The normalized images were modulated to correct voxel intensity for volume displacement during normalization to reflect brain volume, and were smoothed using an 8 mm kernel.
Statistical analysis
To examine the reproducibility of the longitudinal changes in gray matter volume between non-accelerated and accelerated structural T1-weighted imaging, the intraclass correlation coefficient (ICC) was calculated for each voxel using a single-measurement, absolute-agreement, two-way mixed-effects model [35, 36] in MATLAB 9.1, as follows:
where
Histogram analysis was performed for each ICC map with a histogram bin width of 0.002 and a range of –1.0 to 1.0. Only voxels with a volume of > 0.05 on all gray matter images were included in the ICC calculation and histogram analysis. The ICC was interpreted using Cicchetti’s criteria, which classify an ICC of <0.40 as poor, 0.40–0.59 as fair, 0.60–0.74 as good, and 0.75–1.00 as excellent [37].
The mean and within-subject standard deviation images of longitudinal gray matter volume changes were calculated from non-accelerated and accelerated images. The standard deviation images of longitudinal gray matter volume changes were calculated from non-accelerated images.
To evaluate the effect of image quality on the reproducibility of longitudinal changes in gray matter volume between non-accelerated and accelerated imaging, we used the Kruskal–Wallis test to compare the image quality among healthy control subjects, patients with MCI, and patients with AD using SPSS Statistics 22 (IBM, Armonk, NY). The significance level was set at p < 0.05.
RESULTS
ICC maps and histogram analysis
The voxel-wise ICC maps of the longitudinal changes in gray matter volume over 2 years for reproducibility between non-accelerated and accelerated imaging in healthy control subjects, patients with MCI, and patients with AD are shown in Fig. 2. The results of the histogram analysis (frequency polygons) of the ICC maps are shown in Fig. 3. The ICC maps and their frequency polygons differed among the three groups of subjects. The mean ICC was 0.72 overall (0.63 for healthy control subjects, 0.75 for patients with MCI, and 0.63 for patients with AD). The median ICC was 0.75 overall (0.66 for healthy control subjects, 0.79 for patients with MCI, and 0.71 for patients with AD). The histogram peak was 0.81 overall (0.70 for healthy control subjects, 0.84 for patients with MCI, and 0.85 for patients with AD). The distribution of the voxel-wise ICC estimates is summarized in Table 1. Overall, the reproducibility was excellent (ICC = 0.75–1.00) for 49.3%of voxels (23.6%for healthy control subjects, 60.2%for patients with MCI, and 43.3%for patients with AD). The reproducibility was good to excellent (ICC = 0.60–1.00) for 81.4%of voxels (64.8%for healthy control subjects, 85.0%for patients with MCI, and 65.0%for patients with AD).
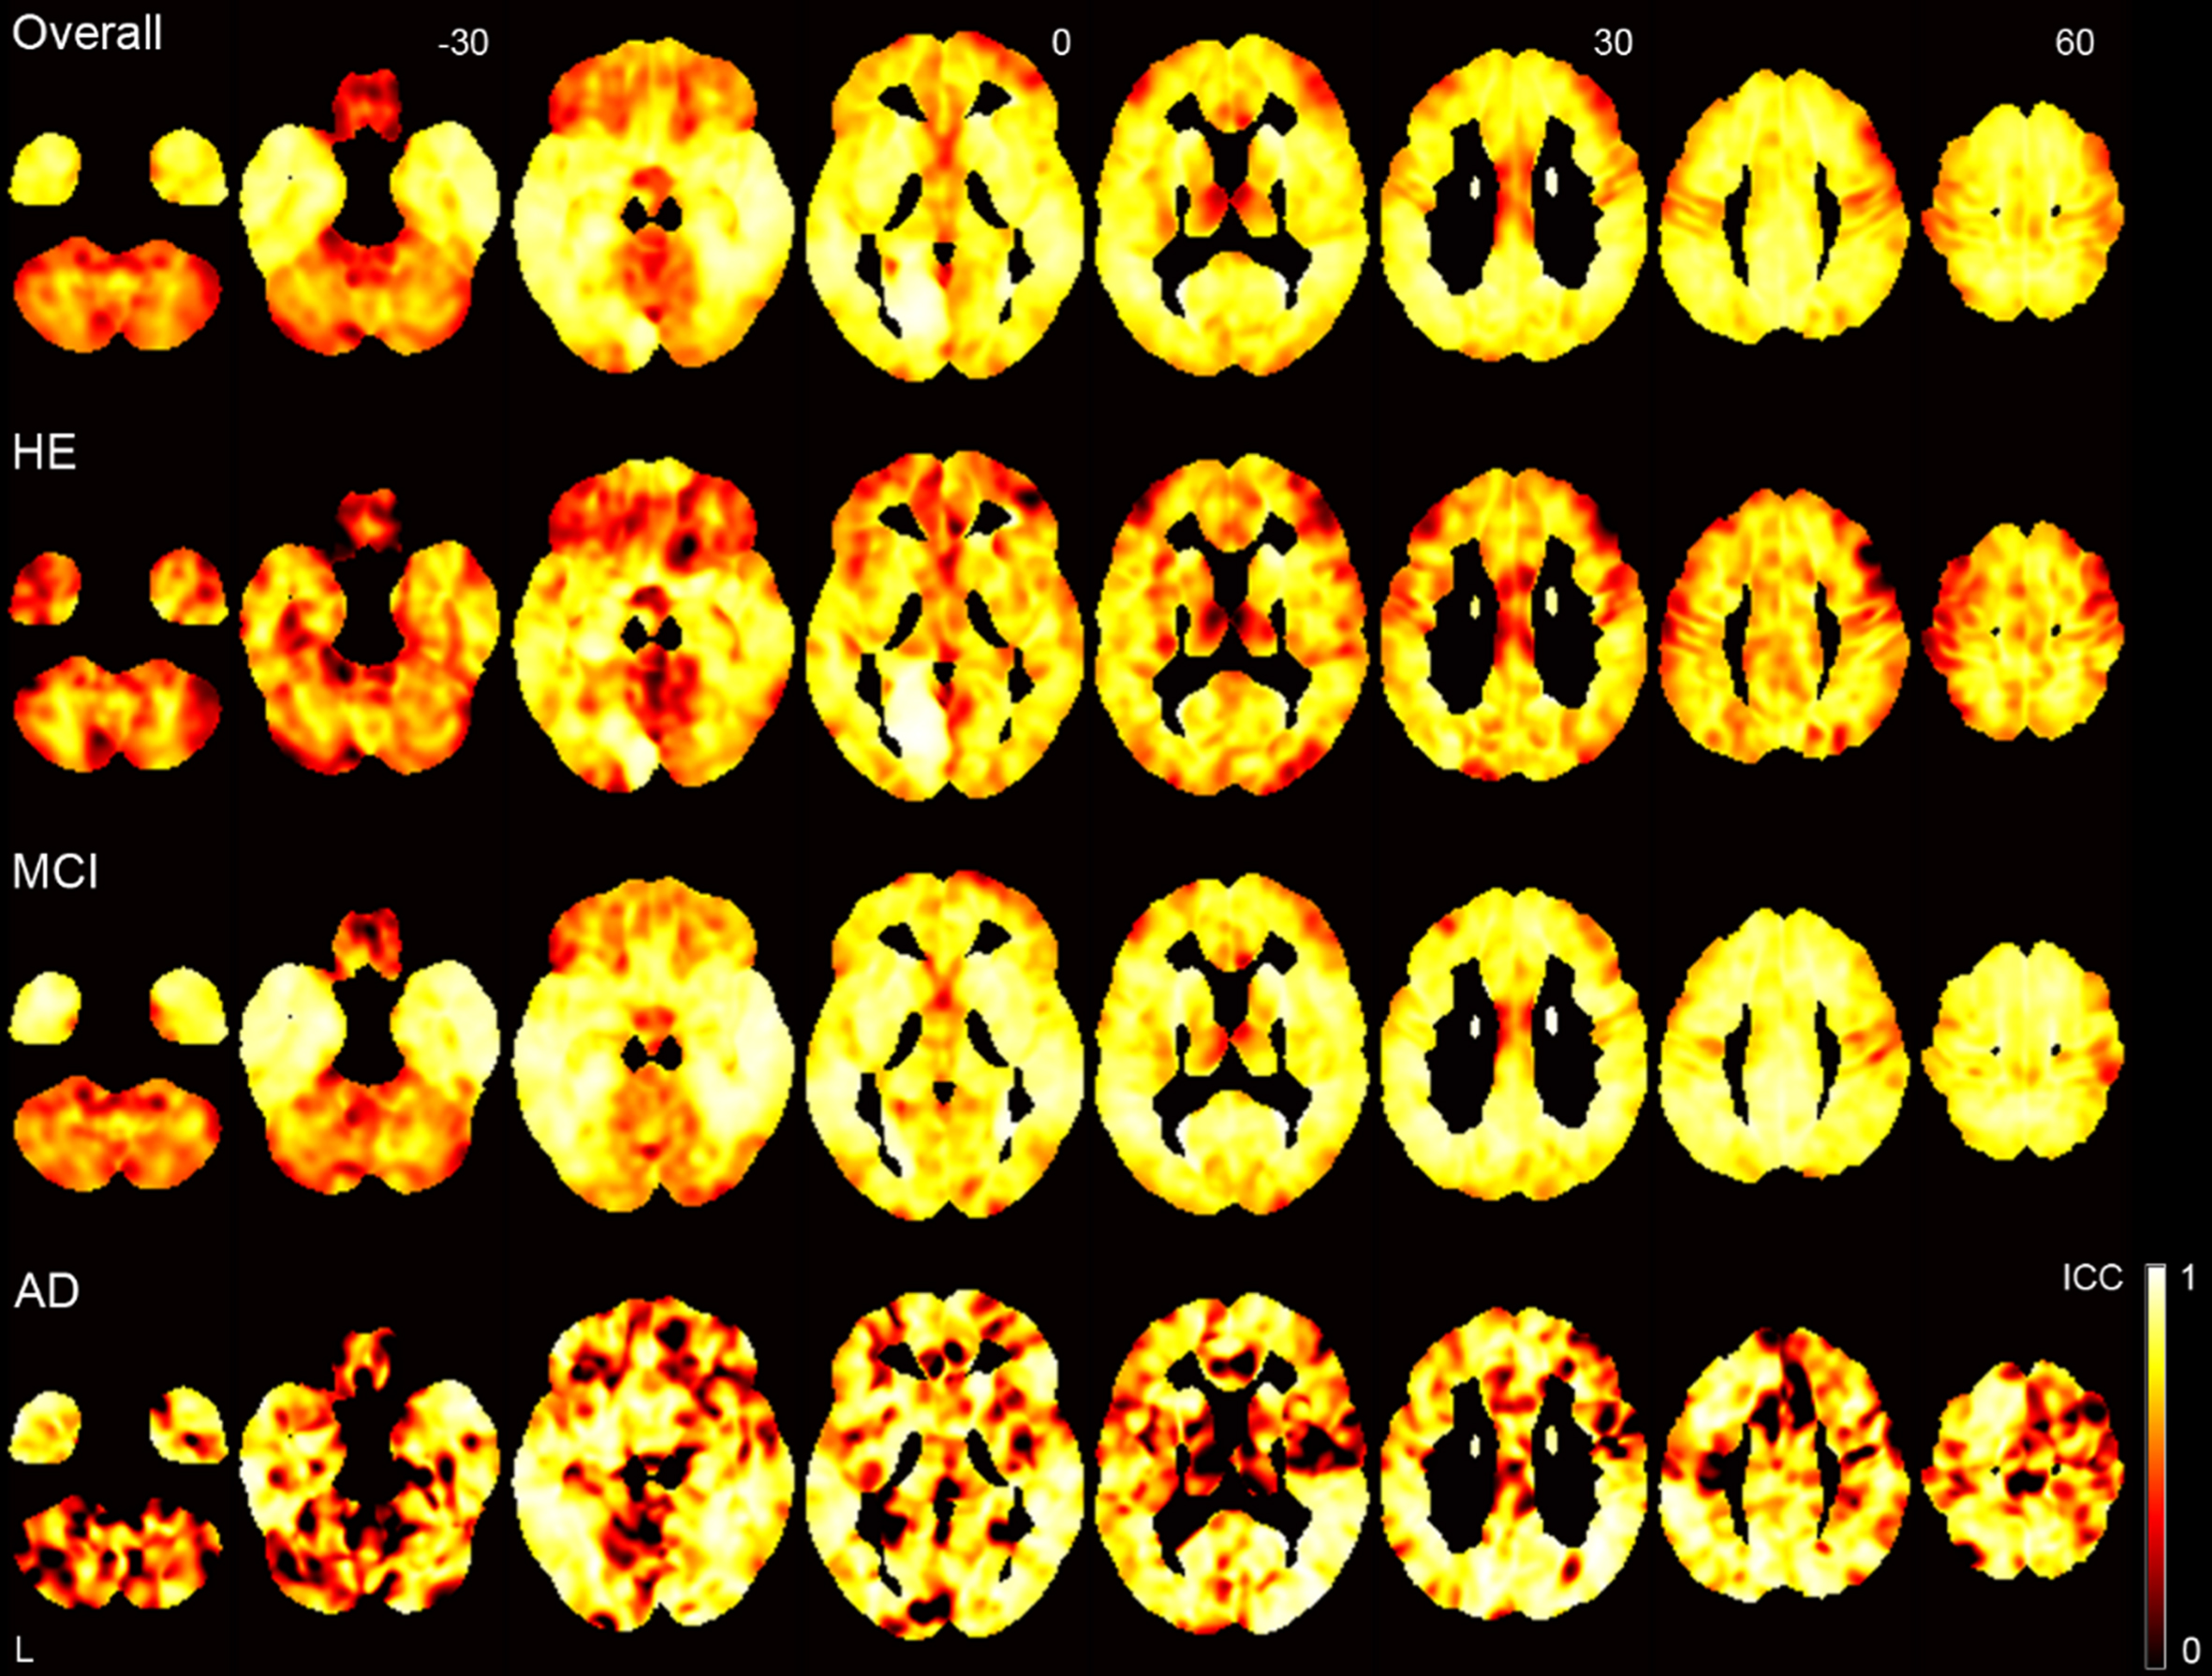
Voxel-wise ICC maps of the longitudinal changes in gray matter volume over 2 years for reproducibility between non-accelerated and accelerated imaging. ICC, intraclass correlation coefficient; HE, healthy elderly; MCI, mild cognitive impairment; AD, Alzheimer’s disease.
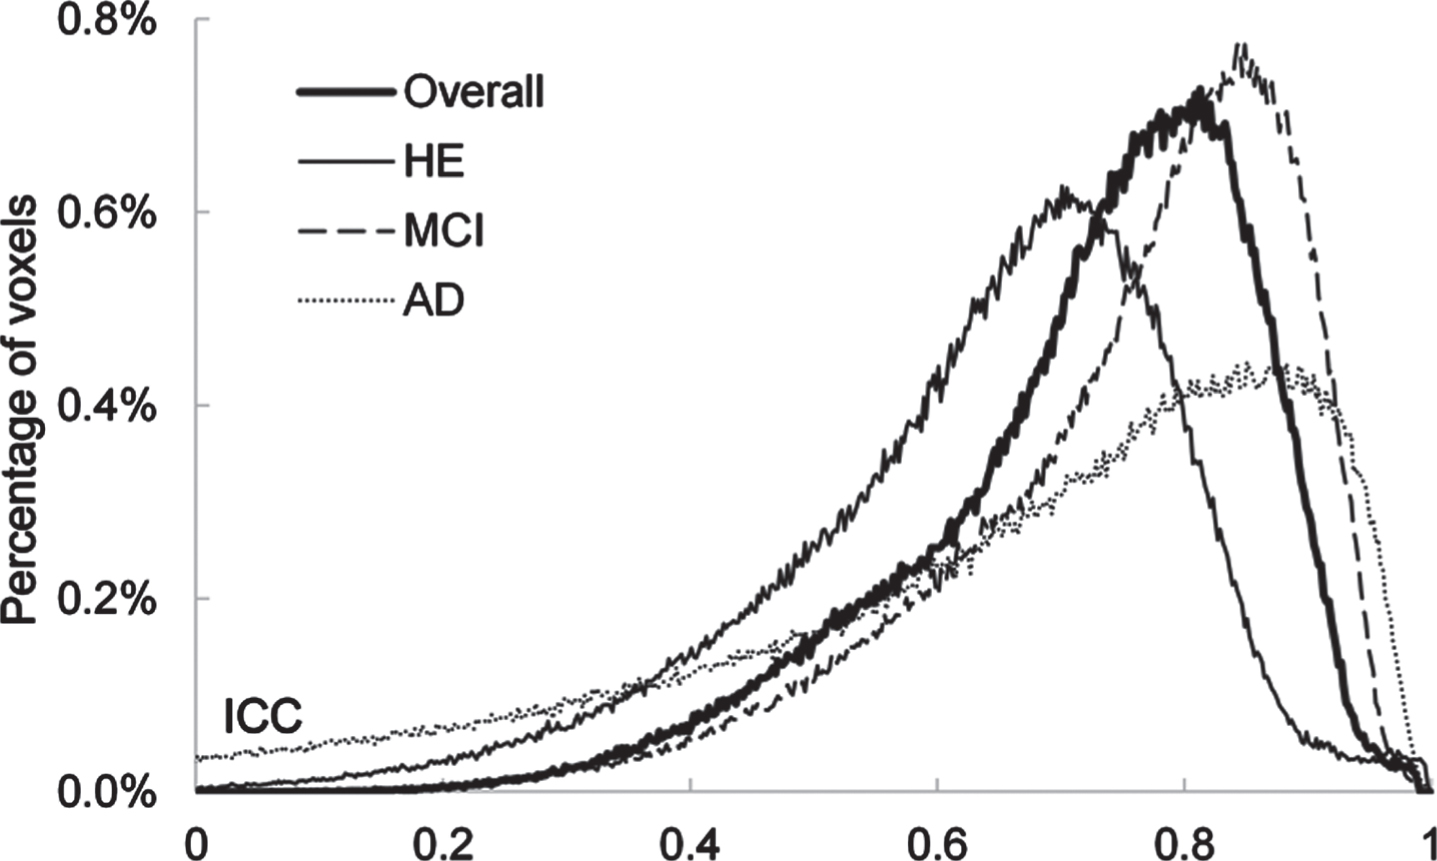
Histograms (frequency polygons) of the voxel-wise ICC maps of longitudinal changes in gray matter volume over 2 years for reproducibility between non-accelerated and accelerated imaging. ICC, intraclass correlation coefficient; HE, healthy elderly; MCI, mild cognitive impairment; AD, Alzheimer’s disease.
The distribution of voxel-wise ICC estimates of the longitudinal changes in gray matter volume at 2 years for reproducibility between non-accelerated and accelerated imaging
ICC, intraclass correlation coefficient; HE, healthy elderly; MCI, mild cognitive impairment; AD, Alzheimer’s disease.
Longitudinal changes in gray matter volume at 2 years
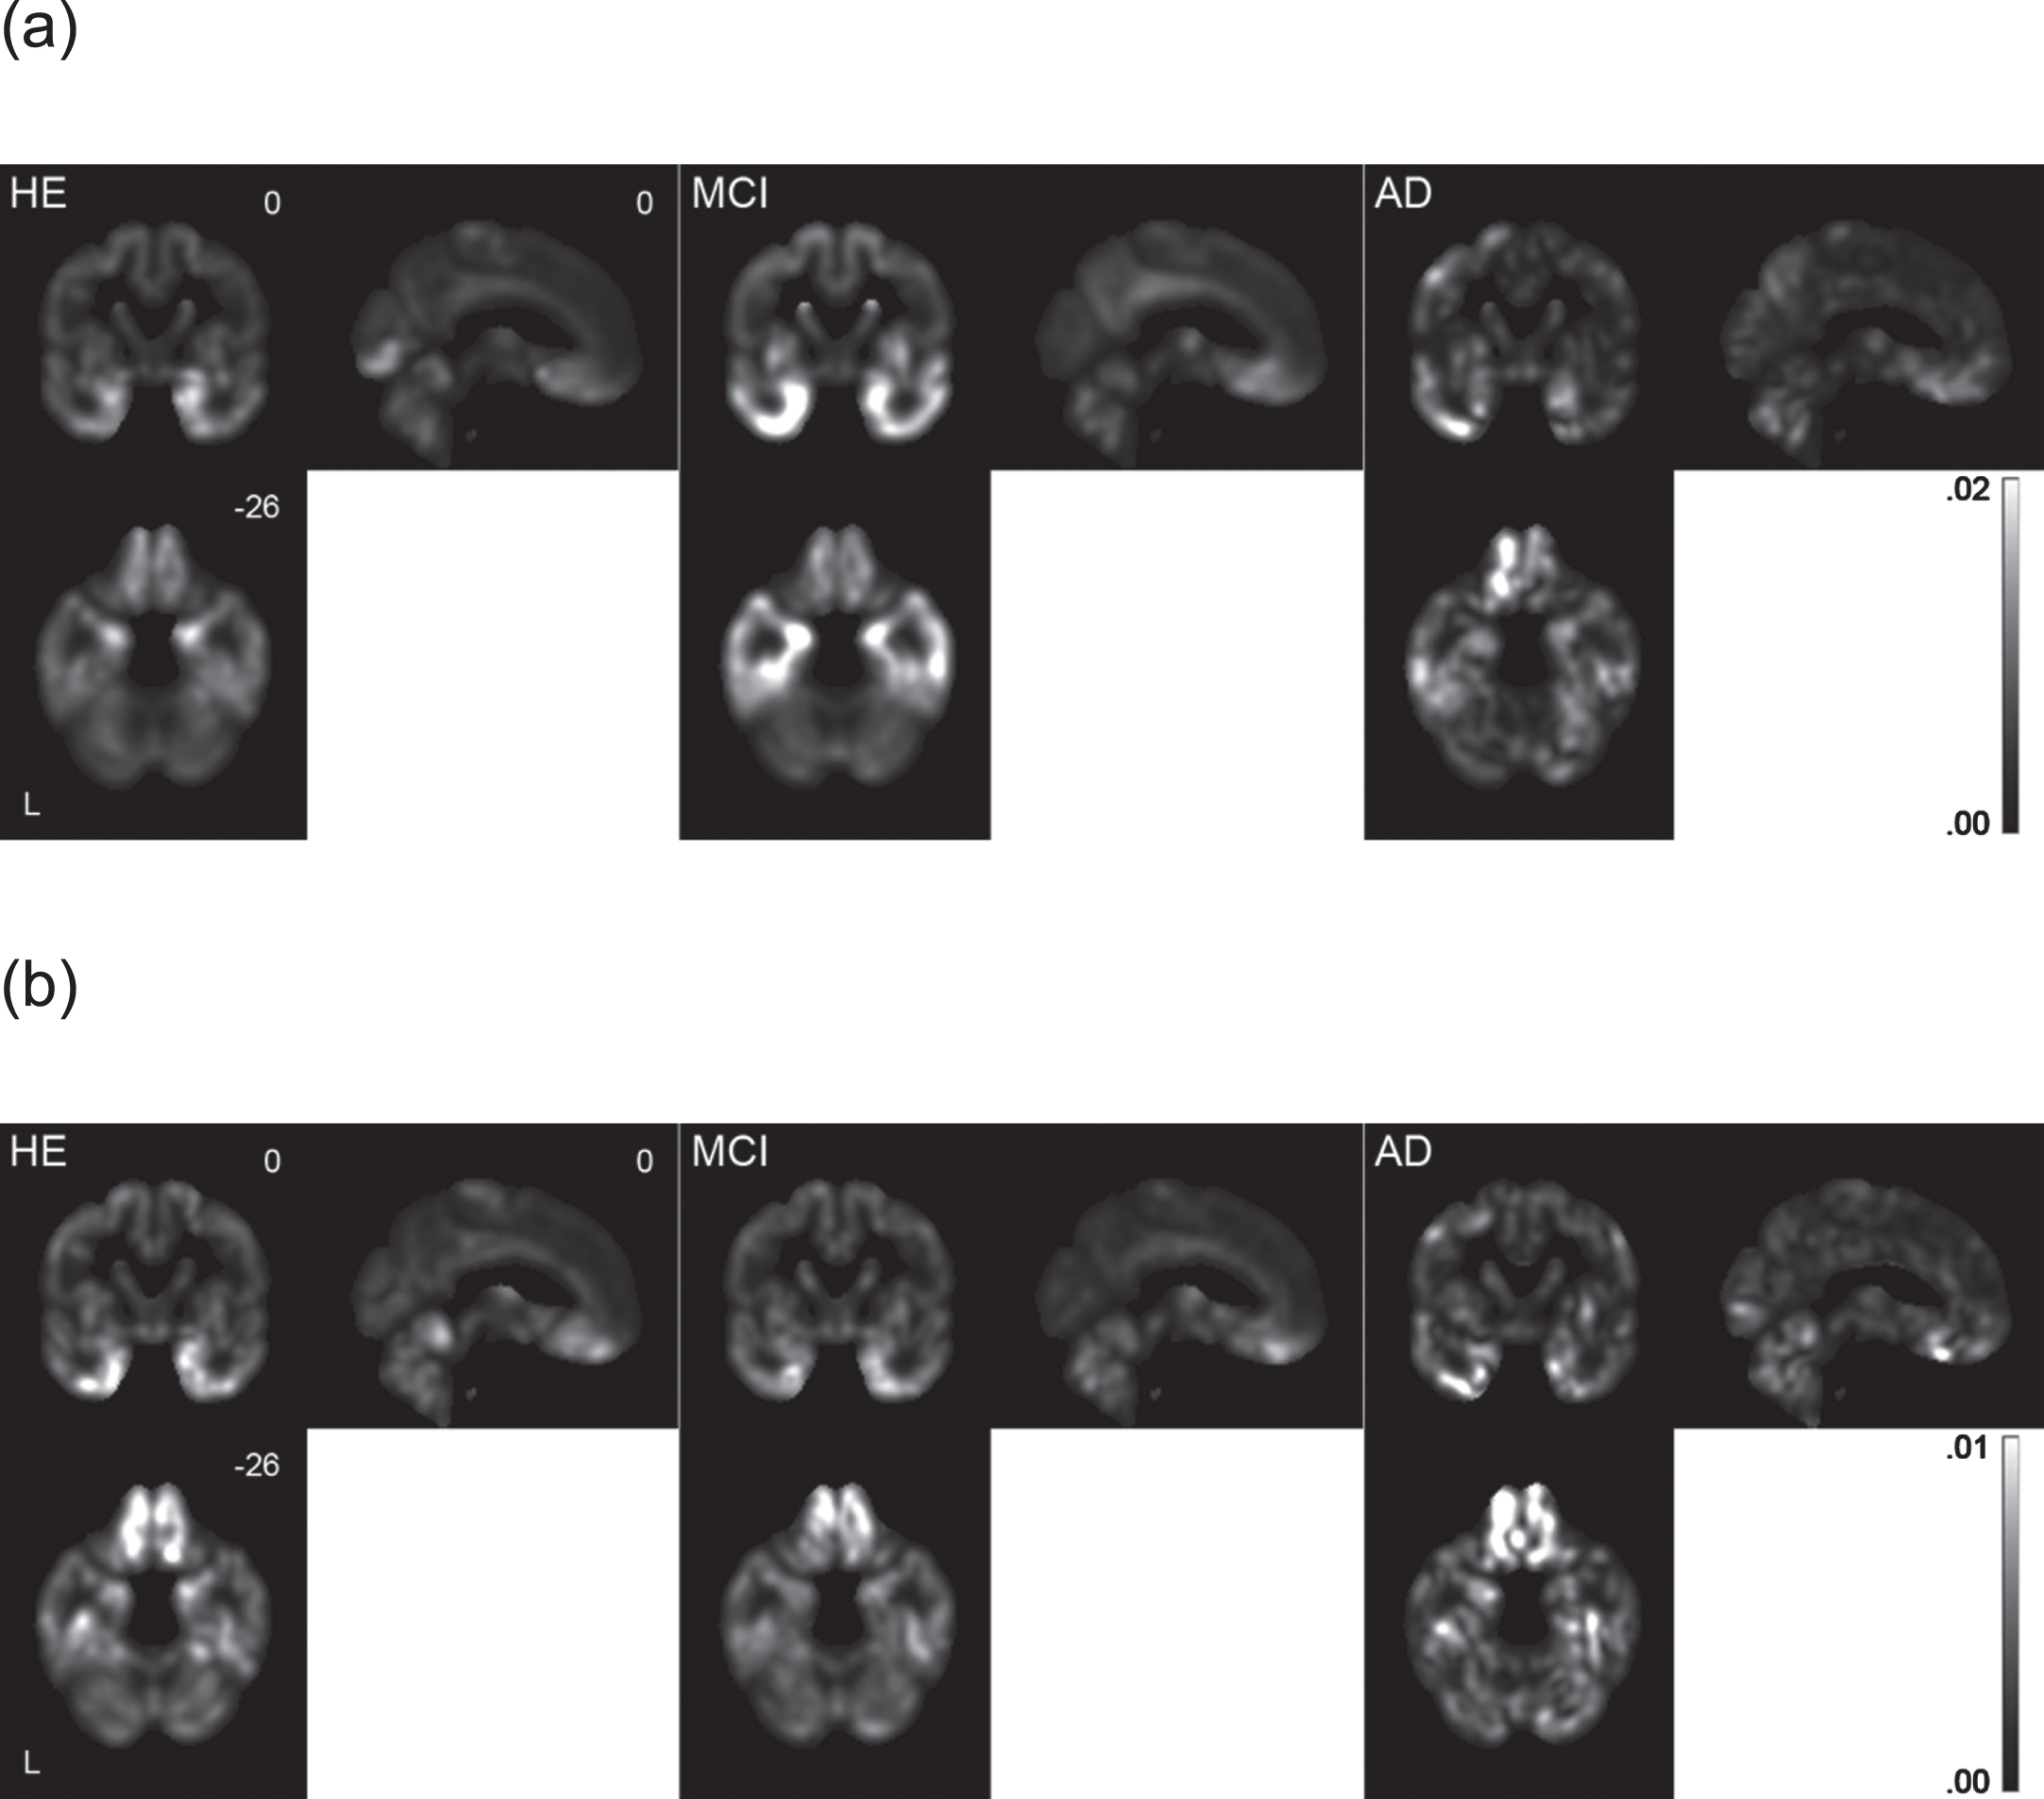
The mean longitudinal changes in gray matter volume at 2 years in the three groups of subjects are shown in Fig. 4. The results of the histogram analysis (frequency polygons; histogram bin width = 0.0002, range = –0.1 to 0.1) are shown in Fig. 5. The patterns of gray matter atrophy that were detected by accelerated imaging closely matched those detected by non-accelerated imaging. The extent of gray matter atrophy over 2 years was greater in patients with MCI than in healthy control subjects, and was also greater in patients with AD than in patients with MCI. In patients with MCI and AD, gray matter atrophy was especially prominent in the temporal lobe, including the hippocampus and parahippocampal cortex, the posterior cingulate cortex, the precuneus, and the orbitofrontal cortex.

Mean longitudinal changes in gray matter volume over 2 years derived from (a) non-accelerated and (b) accelerated imaging. HE, healthy elderly; MCI, mild cognitive impairment; AD, Alzheimer’s disease.

Histograms (frequency polygons) of the mean longitudinal changes in gray matter volume over 2 years derived from non-accelerated (black) and accelerated (red) imaging. HE, healthy elderly; MCI, mild cognitive impairment; AD, Alzheimer’s disease.
The standard deviations and within-subject standard deviations of longitudinal changes in gray matter volume over 2 years are shown for healthy control subjects, patients with MCI, and patients with AD in Fig. 6. As a whole, the variability of longitudinal volume changes was larger in patients with MCI than in healthy control subjects or patients with AD. On the other hand, the within-subject variability was almost the same among the three groups of subjects.
Standard deviations (a) and within-subject standard deviations (b) of longitudinal changes in gray matter volume over 2 years. HE, healthy elderly; MCI, mild cognitive impairment; AD, Alzheimer’s disease.
Image quality
The distribution of image quality (classified as good, adequate, or poor) in each group of subjects is shown in Fig. 7. The distribution of image quality were not significantly different among the healthy control subjects, patients with MCI, and patients with AD (Kruskal–Wallis test, p = 0.18).
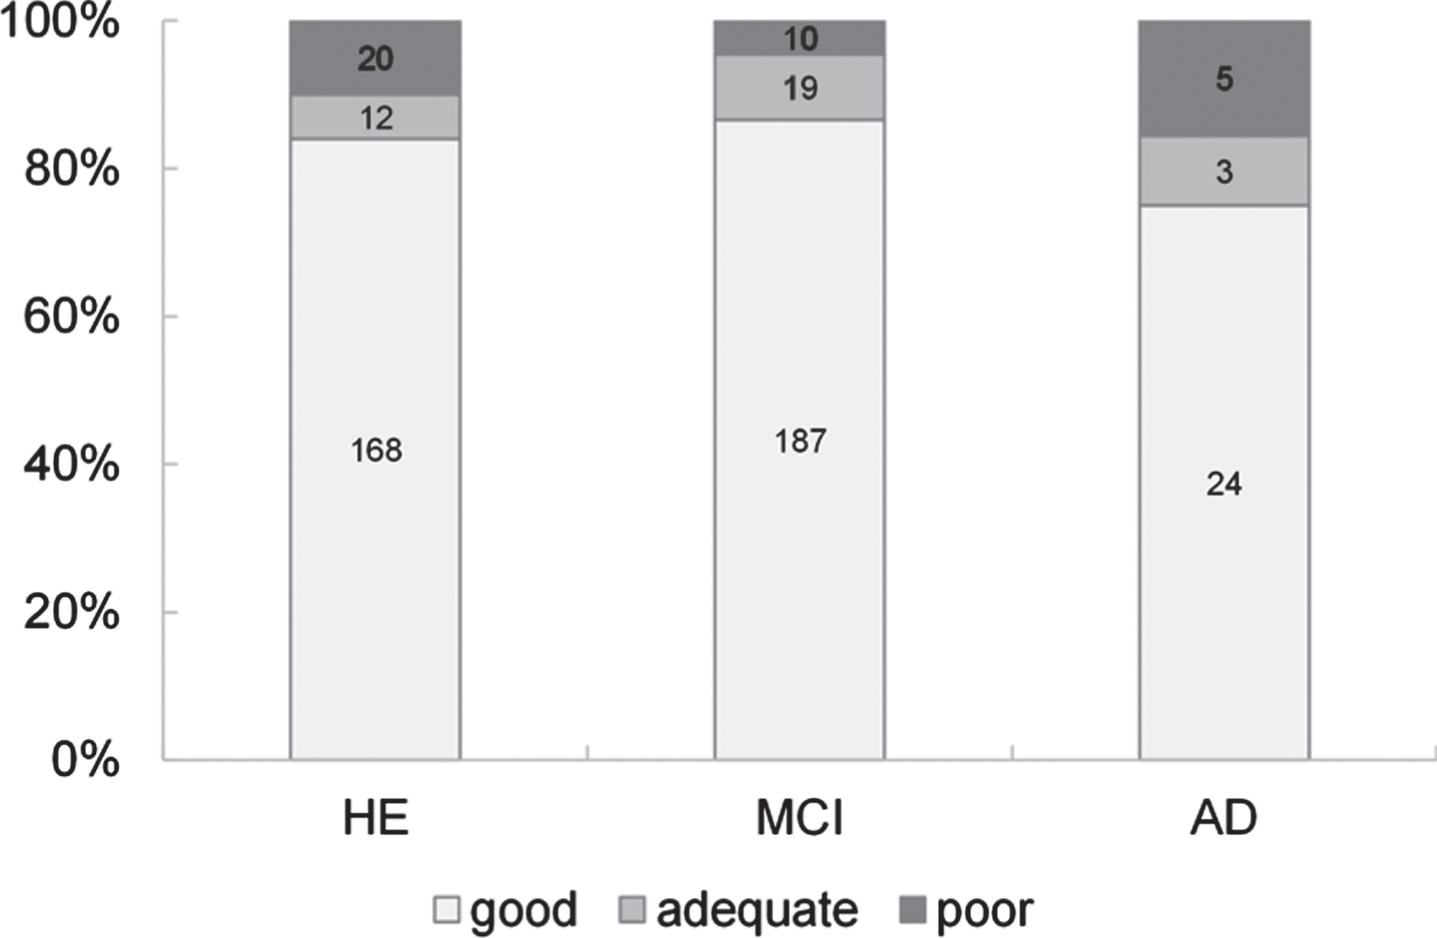
Distribution of image quality. HE, healthy elderly; MCI, mild cognitive impairment; AD, Alzheimer’s disease.
DISCUSSION
In this study, we determined the reproducibility of the longitudinal (2-year) changes in brain morphology, measured by longitudinal VBM, between non-accelerated and accelerated structural T1-weighted imaging in healthy elderly subjects, patients with MCI, and patients with AD. The reproducibility of the longitudinal changes in gray matter volume between non-accelerated and accelerated imaging was rated as good to excellent for 81.4%of voxels as a whole. The distribution of image quality was not significantly different among the three groups of subjects, which was possibly due to not much difference in head motion, and the within-subject variability of longitudinal changes in gray matter volume was almost the same among the three groups. The differences in the ICCs among healthy elderly subjects, patients with MCI, and patients with AD were largely due to the differences in the variability of longitudinal changes in gray matter volume because of no significant difference in image quality among the three groups in this study.
Some studies have investigated the effects of using acceleration during structural T1-weighted imaging on the estimated longitudinal changes in brain morphology [24–28]. Ching et al. compared the longitudinal brain changes detected by accelerated and non-accelerated scans using tensor-based morphometry and ADNI data [24]. They found no significant difference in the region-of-interest summaries of atrophy rates determined using accelerated and non-accelerated scans taken at 6- and 12-month intervals. Although voxel-wise analysis revealed some apparent regional differences in the atrophy rates at 6 months, there were no differences at 12 months. Leung et al. used ADNI data to investigate the impact of switching from non-accelerated to accelerated MRI over a 12-month interval on whole-brain atrophy measured using the k-means normalized boundary shift integral and deformation-based morphometry [25]. They found that switching from non-accelerated scans at baseline to accelerated scans at follow-up had a relatively minor effect on the computed atrophy rates, although the effect was dependent on the exact sequence details and the scanner manufacturer [25]. Vemuri et al. compared the tensor-based morphometry summary scores between accelerated and non-accelerated scan pairs for the annualized structural changes in a region characteristically affected in AD, also using ADNI data [26]. They found several systematic differences between the summary scores computed from accelerated and non-accelerated scan pairs. However, the accelerated scans showed a comparable performance to non-accelerated scans for discriminating among groups of patients. In this study, we evaluated the reproducibility of the longitudinal changes in brain morphology over 2 years between non-accelerated and accelerated structural T1-weighted imaging on a voxel-wise basis using longitudinal VBM and data from the ADNI database. The reproducibility between non-accelerated and accelerated imaging was good to excellent for 81.4%of voxels, but differed by diagnosis and by region.
Head motion contributes to the within-subject variability in various neuroimaging settings. Usually, head motion cannot be directly measured during structural T1-weighted imaging; however, it manifests as decreased image quality [38]. In this study, we could not directly measure head motion during imaging and instead evaluated head motion in terms of image quality. The distribution of image quality was not significantly different and the within-subject variability of longitudinal changes in gray matter volume was almost the same among the three groups of subjects. As long as there is no difference in head motion (image quality), the within-subject variability of longitudinal changes in gray matter volume may not be different among healthy elderly subjects, patients with MCI, and patients with AD. To the best of our knowledge, no prior study has evaluated the relationship between head motion (image quality) and the differences in the reproducibility of longitudinal changes in brain morphology between non-accelerated and accelerated imaging among diseases.
We used the longitudinal registration method [32] implemented in the SPM software to register the baseline and follow-up scans, and to calculate the longitudinal changes in brain volume. This method combines rigid alignment, diffeomorphic warping, and differential intensity non-uniformity correction with respect to a within-subject template that evolves into an average of these three aspects, and is constructed in a symmetric, transitive manner. In longitudinal studies of brain morphology, longitudinal image processing, which seeks to reduce the within-subject variability by integrating the information from scans taken at each time-point and calculating within-subject changes, is generally preferable to treating each scan at each time-point independently, an approach that is usually used in cross-sectional studies. However, longitudinal image processing can introduce bias if the scans taken at different time-points are not treated equivalently and symmetrically (i.e., the scans undergo different processing steps). To prevent bias from affecting the estimated longitudinal changes in brain morphology, it is essential to treat the sequential scans symmetrically; otherwise, longitudinal image processing can be damaging rather than useful. In this study using longitudinal VBM, we found evidence of longitudinal gray matter atrophy in regions similar to previous reports [39, 40].
In this study, the scan time was 9 minutes and 6 seconds for non-accelerated imaging and 5 minutes and 34 seconds for accelerated imaging. While scan acceleration, such as parallel imaging, can reduce scan times, shorter scan times may cause a reduced signal-to-noise ratio, which might affect the results of brain morphometry. On the other hand, longer scans may be more subject to the effect of head motion. This study showed that the reproducibility of longitudinal gray matter volume changes determined by VBM between non-accelerated and accelerated imaging was good to excellent for many regions. Accelerated imaging may be preferable to non-accelerated imaging especially in patients unable to tolerate longer scan times.
There are limitations to this study. First, the image quality was not significantly different among the three groups. However, this does not necessarily mean that the image quality was equivalent among the groups. Second, the number of patients with AD was smaller than those of healthy elderly subjects and patients with MCI, while the numbers of healthy elderly subjects and patients with MCI were almost the same. This may make the results in patients with AD somewhat noisier. Finally, various models of scanners at various sites were used in the ADNI. Although each subject underwent scans at screening and follow-up on the same scanner, the effect of site/scanner on longitudinal morphometric changes may exist, but this is somewhat beyond the scope of this study.
CONCLUSIONS
We determined the reproducibility of the longitudinal changes in brain morphology over 2 years, measured by longitudinal VBM, between non-accelerated and accelerated imaging in healthy elderly subjects, patients with MCI, and patients with AD using data from the ADNI database. Our results indicate that the reproducibility of the longitudinal changes in gray matter volume between non-accelerated and accelerated imaging is good to excellent for many regions of the brain but varies by disease and region.
Footnotes
ACKNOWLEDGMENTS
Data collection and sharing for this project was funded by the Alzheimer’s Disease Neuroimaging Initiative (ADNI) (National Institutes of Health Grant U01 AG024904) and DOD ADNI (Department of Defense award number W81XWH-12-2-0012). ADNI is funded by the National Institute on Aging, the National Institute of Biomedical Imaging and Bioengineering, and through generous contributions from the following: AbbVie, Alzheimer’s Association; Alzheimer’s Drug Discovery Foundation; Araclon Biotech; BioClinica, Inc.; Biogen; Bristol-Myers Squibb Company; CereSpir, Inc.; Cogstate; Eisai Inc.; Elan Pharmaceuticals, Inc.; Eli Lilly and Company; EuroImmun; F. Hoffmann-La Roche Ltd and its affiliated company Genentech, Inc.; Fujirebio; GE Healthcare; IXICO Ltd.; Janssen Alzheimer Immunotherapy Research & Development, LLC.; Johnson & Johnson Pharmaceutical Research & Development LLC.; Lumosity; Lundbeck; Merck & Co., Inc.; Meso Scale Diagnostics, LLC.; NeuroRx Research; Neurotrack Technologies; Novartis Pharmaceuticals Corporation; Pfizer Inc.; Piramal Imaging; Servier; Takeda Pharmaceutical Company; and Transition Therapeutics. The Canadian Institutes of Health Research is providing funds to support ADNI clinical sites in Canada. Private sector contributions are facilitated by the Foundation for the National Institutes of Health (![]() ). The grantee organization is the Northern California Institute for Research and Education, and the study is coordinated by the Alzheimer’s Therapeutic Research Institute at the University of Southern California. ADNI data are disseminated by the Laboratory for Neuro Imaging at the University of Southern California.
). The grantee organization is the Northern California Institute for Research and Education, and the study is coordinated by the Alzheimer’s Therapeutic Research Institute at the University of Southern California. ADNI data are disseminated by the Laboratory for Neuro Imaging at the University of Southern California.