



Abstract
Background:
It is desirable to achieve acceptable accuracy for computer aided diagnosis system (CADS) to disclose the dementia-related consequences on the brain. Therefore, assessing and measuring these impacts is fundamental in the diagnosis of dementia.
Objective:
This study introduces a new CADS for deep learning of magnetic resonance image (MRI) data to identify changes in the brain during Alzheimer’s disease (AD) dementia.
Methods:
The proposed algorithm employed a decision tree with genetic algorithm rule-based optimization to classify input data which were extracted from MRI. This pipeline is applied to the healthy and AD subjects of the Open Access Series of Imaging Studies (OASIS).
Results:
Final evaluation of the CADS and its comparison with other systems supported the potential of the proposed model as a novel tool for investigating the progression of AD and its great ability as an innovative computerized help to facilitate the decision-making procedure for the diagnosis of AD.
Conclusion:
The one-second time response, together with the identified high accurate performance, suggests that this system could be useful in future cognitive and computational neuroscience studies.
INTRODUCTION
One of the most progressive neurodegenerative dementia disorders is Alzheimer’s disease (AD), which induces progressive cognitive deficits, loss of autonomy/independence in everyday activities, and behavioral symptoms. AD dementia is a progressive neurodegeneration that begins to affect the brain about 50 years before full dementia demonstration in patients [1]. Different stages of AD can be identified by the amount of atrophy in the brain [2].
Biomarkers play important roles in the diagnosis of AD [3]. The latest research criteria are based on the diagnostic biomarkers such as pathophysiological markers in cerebrospinal fluid (CSF) or obtained by the positron emission tomography (PET) [4], and topographic markers, including magnetic resonance imaging (MRI) [5].
MRI of brain as a non-invasive powerful technique for human brain provides the quantitative features of the neurological statuses as biomarkers [6]. Volumetric MRI techniques can indicate the changes of volume in particular regions of the brain, as well as the overall brain volume. The differences of tissue matter are enhanced by MRI based on the ratio of bound to unbound water molecules. This ratio varies between different types of brain tissue and provides the extraction of regional volume quantification.
During recent years, in addition to many advances in the diagnosis and understanding about the AD using pathophysiological biomarkers [7], machine learning and artificial intelligent approaches based on MRI have tried to provide an accurate computer assistance. These computer-based techniques that called computer aided diagnosis system (CADS) are considered as second decisions beside the neurologists. They mostly have used patient’s clinical data and biomarkers to increase the speed and sensitivity of diagnosis. The advances in computer assistance technology always allow useful new potential in clinical investigations.
Recently, we have conducted research to review the recent proposed published systems for the classification of the healthy and AD individuals [8]. Continuing in that research line, the focus of this retrospective and exploratory study is to present a novel algorithm for image feature selection and classification to detect patients with dementia due to the AD by considering the neurocognitive process of the brain using a novel decision tree with genetic algorithm rule-based optimization.
To overcome the difficulty in AD detection from MR images, it needs to focus more on image features, their definition, extraction, and selection methods. This work attempts to present a useable clinical tool for an automatic diagnosis using a CADS for medical image classification. This proposed methodology is a decision tree (DT) with genetic algorithm (GA) rule-based optimization. This way, each splitting branch is optimized by GA. The DT method is one of the algorithms that is human interpretable [9], and its main advantage among other methods for health domain is the possibility of brain’s activity recognition [10]. Additionally, GA is a helpful method in several problems like optimization [11], image processing [12], artificial neural networks training [13], and rule-based systems [14]. Therefore, due to the advantages of these two methods, this system will have a significant effect on the image-based diagnosis of AD in the future clinical applications.
MATERIALS AND METHODS
CADS architecture and procedures
In order to specifically observe and understand the details of brain’s change during dementia over time (specially at a subconscious stage) using computational modeling, we proposed a non-parametric supervised classifier based on decision rules learning.
These extracted top ranked features were used as the inputs of the CADS which is modeled by an optimized DT with GA rule-based model. It uses the training and learning in a deep learning mode to provide efficient outputs. This architecture leads to a novel CADS that is technically helpful in treatment procedure. The modules of the proposed architecture are shown graphically in Fig. 1.

The proposed CADS architecture follows these steps: MRI data and inputs, preliminary analysis of data to calculate subcortical volumetric values as attributes, feature selection, data preparation, DT optimization using genetic algorithm (GA).
Inputs
The clinical structural MRI data of this study that are used as inputs of the system are extracted from open access series of imaging studies (OASIS) database [15]. This database consists of a cross-sectional collection of MR images of 416 subjects, both men and women (mostly women), aged between 18 to 96 years old. There are more female subjects than the males because women live longer than men on average and older age is one of the criteria for AD [16]. In this study, all images are 3D T1-weighted (T1-w) MRI scans in X-Y planes. Subjects are differentiated to several groups based on a global Clinical Dementia Rating (CDR) scale including normal with no dementia and CDR of 0, and with AD dementia including very mild AD (CDR = 0.5) and mild AD (CDR = 1). 181 subjects were without CDR and therefore were excluded. From this dataset, we have chosen a balanced group of AD and healthy control (Nold) matched for age, education levels, and gender (Table 1).
Clinical and demographical summary of dataset
Preliminary analysis of data by FSL
Generally, databases are not prepared for automatic learning algorithm analysis. The MRI scans were visually controlled to confirm that structural defects or technical artifacts were not present. Analysis of MRI data was done by the Functional Magnetic Resonance Imaging of the Brain (FMRIB) Software Library (FSL) (http://www.fmrib.ox.ac.uk/fsl) to identify and classify the probability of a gray matter (GM), white matter (WM), and cerebrospinal fluid (CSF) brain voxel. The first step towards extracting brain regions was automatic atlas-based parceling using the FSL-BET pipeline. Then, the second step was the single-channel segmentation using the FAST tool of FSL, producing a-posterior probability maps in the space of the individual subject for GM, WM, and CSF, with each voxel in the range [0–1] where 1 is the maximum probability. FAST is specifically based on Hidden Markov Random Field (HMRF) model and a related Expectation Maximization (EM) algorithm [17]. The advantages of using HMRF model is encoding MRI spatial information through nearby voxels, which results to spatial regularization and decreasing noise impact on the segmentation. The integration of HMRF model with an EM algorithm leads to precise and robust segmentation. To fit and provide a standard labeled template, non-linearly normalization (FSL-FNIRT tool) was applied for GM probability. The output of this step was an associated spatial transformation matrix from subject space to standard template space. The model was based on averaged high-resolution MRIs obtained from the subjects of this research, tissue channels (CSF probability, GM probability, WM probability, tissue labels), and two cortical parcellation maps, namely the TZO map, using the model of [18], and the LPBA40 map, based on the LONI Probabilistic Brain Atlas [19].
MRI features
Based on this parcellation of the MRI, all extracted data were the following markers: volume of the total intracranial volume (TIV; cm3), GM (cm3), WM (cm3), CSF (cm3), left hippocampus (L-Hippocampus; cm3), right hippocampus (R-Hippocampus; cm3), total hippocampus (T-Hippocampus; cm3), cortical GM (Cortex; cm3). A feature construction /transformation step was then carried out in order to take all attributes into a normalized form. Furthermore, this step eliminated the brain’s volume effect, which differed from subject to subject.
The feature transformation resulted in: GM/TIV, WM/TIV, CSF/TIV, L-hippocampus/TIV, R-hippocampus/TIV, L-hippocampus/TIV, R-hippocampus/GM, Hippocampus/TIV, Cortex/TIV, Cortex/GM. These extracted markers were considered as attributes for the system. In order to be sure that these variables can differentiate the groups, the differences of three groups in these features were checked based on the Kruskal-Wallis H test; using this test, when the p value is less than 0.005, there is a significant difference in the values of features across groups. According to the results of this statistical investigation, we extracted appropriate features that their p value approved that AD and control groups could be distinguished by these features and they could be used as predictors in classification. Irrelevant attributes can lead to decrease the accuracy because the model will be trained based on these irrelevant features [8]. Therefore, highly correlated and noisy features were ignored.
Data preparation
In order to test the final system with unknown features, data was divided into training and testing groups with a percentage of 60–40.
Design of DT
DT is a type of machine learning method that breaks up a complex decision into a union tree structure of simple binary decisions. The tree’s branching continues until leaves determine the final label [20]. A DT can be compared to a tree with a root (top node) that branches into possible outcomes. The internal nodes (non-leaf nodes) are the outcomes of the branches and each node is a feature, and each branch is made using the comparison between testing value and a threshold value of the node. Figure 2 shows a sample of DT in AD and healthy control classification.
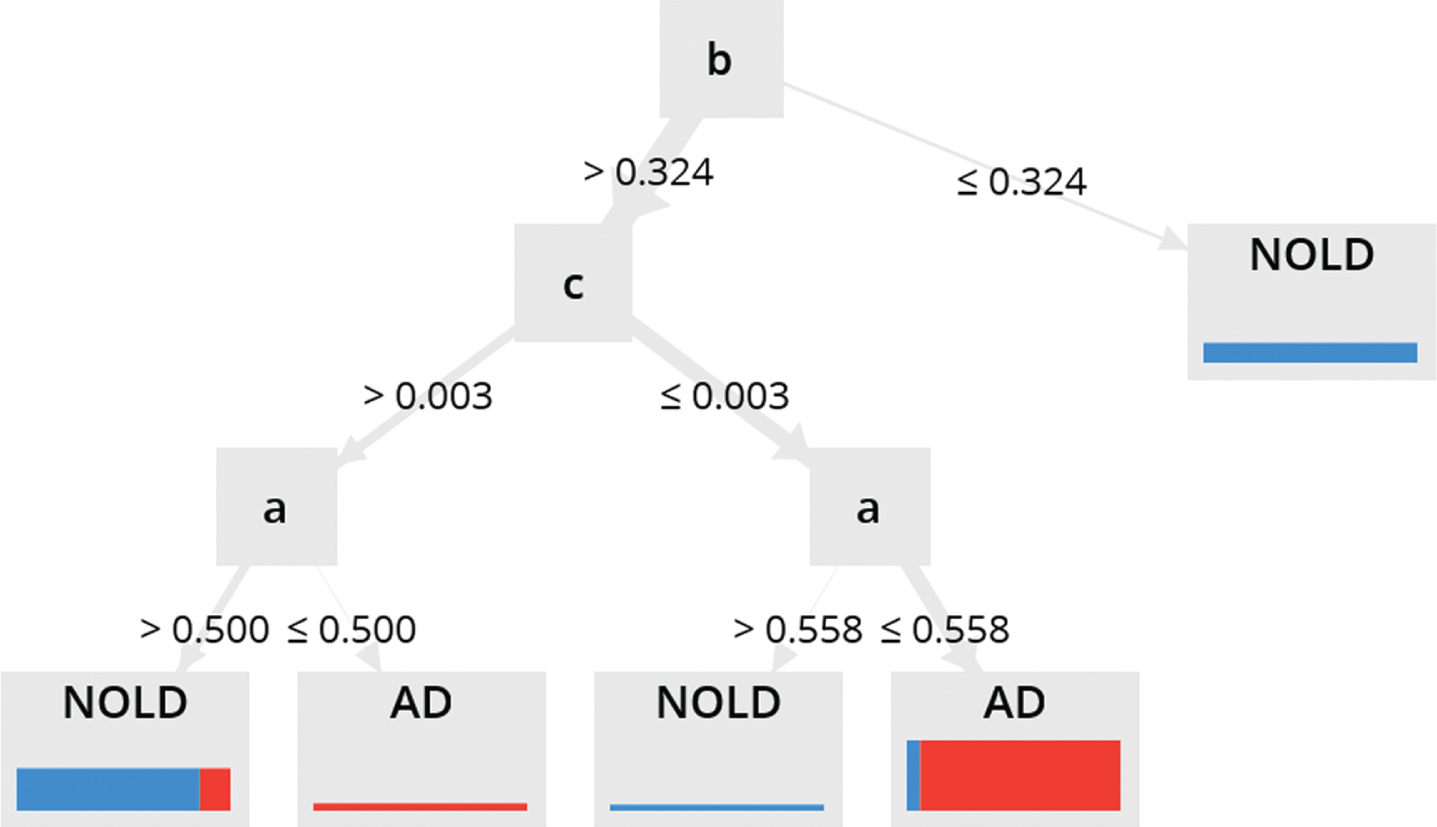
A sample of DT algorithm. b is the root (the most attribute for classifying), the first branch after root has pure blue color that it means there are no other classes in the distribution of the training cases for that branch. After root b, in the c and a, other tests are necessary to performed. Different widths in the bars indicate how many cases are covered in the training set and the distribution of the colors show class distribution.
Genetic algorithm
GA [12] is inspired by Darwinian evolutionary models to find the optimal outputs. GA is the best method to search for a subset near optimal to solve the problem of large and complex space with high-dimensional classification problems [21]. The initial population of potential solutions was randomly generated. In this study, chromosomes were binary strings that encoding the set of features. Fitter individuals in GA were extracted during several generations and each individual in the population (called chromosome) was a representative of solution. Each chromosome contained bits, with bit number equal to the number of features. One bit for each feature. A bit value of zero (0) indicated that the corresponding feature was not selected, and a value one indicated that the feature was chosen. Fitness evaluation was done with 5 nearest neighbors with Euclidian distance for all population to check how well they are fitted with the needed requirements and then we chose the best individuals. Crossover was created for reproduction of the next generation; it included two random points selection within a genome of one parent and swapping the section between these exact two points with a second parent. For each crossover, two new individuals for the next generation were created. In the mutation function step, we added a little bit randomness in our population’s genetic, therefore our new solutions would not exist in the initial population. Fitness evaluation was done with 2-fold cross validation. This helped increasing the final performance of the system. Figure 1, part GA, shows demographically how GA was designed in this study. The output of the GA was applied to the DT rules to make the results better.
Final output
The final outputs were presented as accuracy, specificity, sensitivity, and area under curve (AUC) [8].
RESULTS
For the classification of the MRI features, we observed accuracy of 86.7 %, sensitivity of 93.3%, specificity of 93.3%, and AUC of 94.2%. Table 2 depicts the overall performance of the proposed CADS for MRI dataset. Training and testing phase took place in 1 second.
The classification evaluation of the proposed CADS with optimized DT and GA rule-based in MRI samples of AD and control individuals
To show the efficiency of our proposed method and to perform a comparative analysis, we used different traditional methods: DT, generalized linear model, naive based, random forest, gradient boosted tress, and support vector machine. The classification evaluation of MRI data using these methods are reported in Table 3.
The classification evaluation of MRI data using conventional machine learning methods: decision tree, generalized linear model, naive based, random forest, gradient boosted tress, and support vector machine
DISCUSSION
In this study, we hypothesized that a well-designed CADS based on DT that is optimized by GA can be used to detect patterns of dementia due to AD in order to a better understanding of diagnosis procedure and illness progress management. Recognition of unnecessary features can prevent the performance degrade of algorithm due to the fact that features may be irrelevant, undesired, or redundant. Trambaiolli and colleagues [22] showed the importance of feature selections and classification techniques as complementary tools to find out the possible biomarkers for the clinical diagnosis of AD. Based on Table 3, system performance is in the excellent range and has the ability to fulfill the primary hypothesis. The value of AUC (94.2±8.1) confirmed the excellent discrimination between subjects with AD and Nold individuals. Final accuracy (86.7%), sensitivity (83.3%), and specificity (93.3±14.9) approved acceptable classification results for the extracted MRI features.
The current outcomes of DT are better in the case that it classifies a sequential testing of different features while neural network needs a simultaneous combination of many attributed to work well [23]. Support vector machine classifies highly precise but the results cannot be understood easily [24]. This study additionally expanded prior proof of different articles demonstrating that machine learning methods permit a gentle separation (about 80%) among Nold and AD individuals [25–28]. Most recent studies used common method of neural networks to discriminate between AD and Nold subjects [26–29]. When compared with other conventional techniques (Table 3), the proposed architecture has more advantages: 1) it does not have the limitations of the fixed rigid structures or number of inputs such as some other methods like neural networks, therefore it can be used in other dataset with any data size, 2) it allows interpretation due to the DT in his structure, 3) it is trained from MRI data through GA rules so it has the potentials of DT and GA both together in one model, 4) it has a better classification result in comparison with traditional methods reported in Table 3.
DT’s structure does not have several parameters such as neural networks (number of layers, neurons per layer, activation functions, optimizers, etc.) which are hard to determine the best configuration for each dataset. It also does not need to be cautious for overfitting. Due to the high number of parameters and longer learning time in neural networks, DT has a better quality. This proposed CADS with GA combined in DT structure improved the classification results more than a simple DT. We used the same MRI data in a normal DT and the results were accuracy of 66.7%, sensitivity of 55%, and specificity of 83.3%, and AUC of 78.3%. These evaluation with a normal DT confirmed the higher accuracy of this proposed DT architecture combined with GA (accuracy of 86.7%, sensitivity of 83.3%, and specificity of 93.3±14.9) in discrimination of AD from normal elderly.
As another finding of this study, the proposed DT with GA unveiled high sensitivity and specificity in detection of AD individuals. This significant success may make the present machine learning technique of interest for clinical applications as a way to prohibit AD subjects to undergo more complex diagnostic approaches such as the invasive lumbar puncture for the dosing of Aβ42 and phospho-tau proteins [30].
Finally, it is essential to acknowledge some significant restrictions and limitations of the current investigation, which should be recreated in other groups of patients with further developed methods. In the present study, we used the biomarkers extracted from structural MRI which were based on volume and showed valuable results for research; however, using other biomarkers such as rsEEG can be helpful. In the future study, in addition to MRI data, we can add rsEEG rhythms using non-invasive scalp exploring electrodes, which is ideal for an optimal spatial sampling aimed at estimating underlying cortical sources [31]. Cortical rsEEG rhythms may have those optimum features to enhance the performance of the CADS. In addition, blood-based biomarkers including neurofilament light protein and plasma tau along with genetics, clinical, and demographic information can be other important screening markers. Virtual reality and social robots are also other innovative techniques that can be used as digital assistances for diagnosing the dementia.
Conclusions
In the current exploratory study, we developed a CADS based on DT with GA rule-based optimization to identify changes in the brain during AD dementia, to analyze the grouping exactness between the Nold and AD individuals using the biomarkers extracted from structural MRI.
The proposed model of DT with GA indicated of 86.7%for accuracy, 83.3%for sensitivity, and 93.3%for specificity for discrimination of AD and Nold subjects. These results motivate future investments of more advanced studies and clinical establishments in this field.
In this study, the dataset only included AD and Nold subjects and other types of dementia such as dementia with Lewy bodies [32] were not considered while in the clinical application this will happen. Considering different types of dementia to train and test the system is necessary to increase the functionality of the model for using in real clinical area. In clinical application there are patients with different dementias that are misdiagnosed as AD and a system that was trained with all these varieties can perform accurately. In addition, the present model could not be converted directly into the clinical applications. Firstly, it needs to prepare a plan for clinical interpretations by giving them a detailed guideline including how to work with this system in a way that they take data in the same condition for all patients. Secondly, a pilot study while the system is installed in the clinic or hospital is also needed to evaluate the system’s performance in the real clinical data.
DISCLOSURE STATEMENT
Authors’ disclosures available online (https://www.j-alz.com/manuscript-disclosures/21-0626r1).