
Abstract
Background:
Superficial white matter (SWM) alterations correlated with cognitive decline have been described in Alzheimer’s disease (AD).
Objective:
The study aims to extend the investigation of the SWM alterations to AD and non-AD neurodegenerative dementia (ND) and explore the relationship with cerebrospinal fluid (CSF) biomarkers and clinical data.
Methods:
From a database of 323 suspected dementia cases, we retrospectively recruited 55 ND with abnormal amyloid-β42 (AD) and 38 ND with normal amyloid-β42 (non-AD) and collected clinical data, CSF biomarkers, and magnetic resonance images. Ten healthy controls (HC) were recruited for imaging and Mini-Mental State Examination (MMSE). Diffusion tensor imaging (DTI) measurements were performed in the lobar SWM regions and Kruskal Wallis tests were used for among-group comparison. Spearman’s correlation tests were performed between DTI measures, CSF biomarkers, and clinical data.
Results:
AD and non-AD showed significant differences in the DTI measures across the SWM compared to HC. Significant differences between AD and non-AD were detected in the left parietal lobe. DTI measures correlated with amyloid-β42 and MMSE diffusely in the SWM, less extensively with total-tau and phosphorylated tau, and with disease duration in the parietal lobe bilaterally.
Conclusion:
Widespread SWM alterations occur in both AD and non-AD ND and AD shows appreciably more severe alterations in the parietal SWM. Notably, the alterations in the SWM are strongly linked not only to the cognitive decline but also to the diagnostic CSF biomarkers. Further studies are encouraged to evaluate the DTI measures in the SWM as in vivo non-invasive biomarkers in the preclinical phase.
Keywords
INTRODUCTION
Neurodegenerative dementia (ND) is characterized by the loss of cognitive function and by the impairment of behavioral abilities associated with progressive neuronal loss, gliosis, and abnormal protein deposition [1]. Alzheimer’s disease (AD) is the most common form of ND [1].
The diagnosis of AD has recently shifted from a syndromal to a biological construct [2]. The clinical and neuropsychological examinations are indeed integrated together with cerebrospinal fluid (CSF) biomarkers and imaging tools such as positron emission tomography (PET) and magnetic resonance imaging (MRI) to detect atrophy [2, 3]. The CSF amyloid-β (Aβ) plays a key role in AD as its decline might begin 25 years before the onset of observable symptoms [4] and might be the first detectable biomarker [5]. Aβ is also under discussion as a therapeutic target [6, 7].
White matter (WM) changes observed independently to gray matter (GM) atrophy in AD [8] encouraged several in vivo diffusion tensor imaging (DTI)-based studies in the deep white matter (DWM) and only a few in the superficial white matter (SWM) [9–14]. However, the SWM, located below the cortical ribbon, is rich in late-myelinated axons and characterized by high plasticity and high vulnerability. According to the retrogenesis model, the white matter (WM) tracts that are the last to myelinate are the first to degenerate in AD and other dementia [15]. SWM alterations that correlate with the cognitive decline were demonstrated in AD [12–14]. The lack of data in non-AD ND did not allow to define whether the SWM alterations are specific to AD or represent a key feature also in non-AD ND. Moreover, the relationship with the diagnostic CSF biomarkers is still unknown.
The aim of this study was to investigate the SWM alterations in AD and non-AD ND. A fully automatic MRI analysis framework was adopted to evaluate the DTI parameters in the SWM in the different lobes. Then, the relationships between the lobar DTI measures in the SWM, the CSF biomarkers, and the clinical data were investigated.
METHODS
Study groups
We retrospectively reviewed a database of 323 subjects referred to the Neurodegenerative Disease Unit of Fondazione Ca’ Granda Ospedale Maggiore Policlinico (Milan, Italy) between October 2014 and August 2018 in the clinical suspicion of dementia who have undergone lumbar puncture for the determination of levels of Aβ42, total-tau (t-tau), and phosphorylated tau (p-tau).
Ninety-nine patients were eligible for the study according to the following inclusion criteria: 1) diagnosis of ND according to the established diagnostic criteria at the end of the diagnostic work-up with a follow up of at least 2 years; 2) availability of a 3 Tesla (T) MRI, including the three-dimensional (3D) volumetric T1-weighted images, 2D or 3D FLAIR images, and the DTI sequence with 32 directions.
Six patients were excluded from the study for the following criteria: images with severe motion artifacts (N = 4); relevant WM lesions according to the Fazekas scale (N = 2). A total of 93 patients were finally enrolled in the study.
All the subjects underwent neurological and neu-ropsychological examinations, including the Mini-Mental State Examination (MMSE). Assessments were performed within a 365-day interval from the subject’s first visit. The subjects were clinically followed up for at least 2 years. After the diagnostic work-up, subjects were diagnosed by expert neurologists at the end of the follow-up with ND, according to the specific criteria of each syndrome [3, 16–19].
All patients underwent lumbar puncture with CSF collection, and levels of Aβ42, t-tau, and p-tau were measured using Innotest ELISAs following the manufacturer’s instructions (Fujirebio, Ghent, Belgium). Then, ND patients were classified into two groups according to normal (N = 38) or abnormal (N = 55) levels of Aβ42 with the threshold set to 640 pg/mL (598–674, 95%CI). Hereinafter, the two groups of ND patients with normal and abnormal Aβ42 levels will be referred to as non-AD and AD, respectively. Non-AD group includes patients with the following diagnosis: 7 mild cognitive impairment; 23 fronto-temporal dementia; 8 Lewy body dementia.
The flowchart of the patients’ enrollment and classification is shown in Fig. 1.
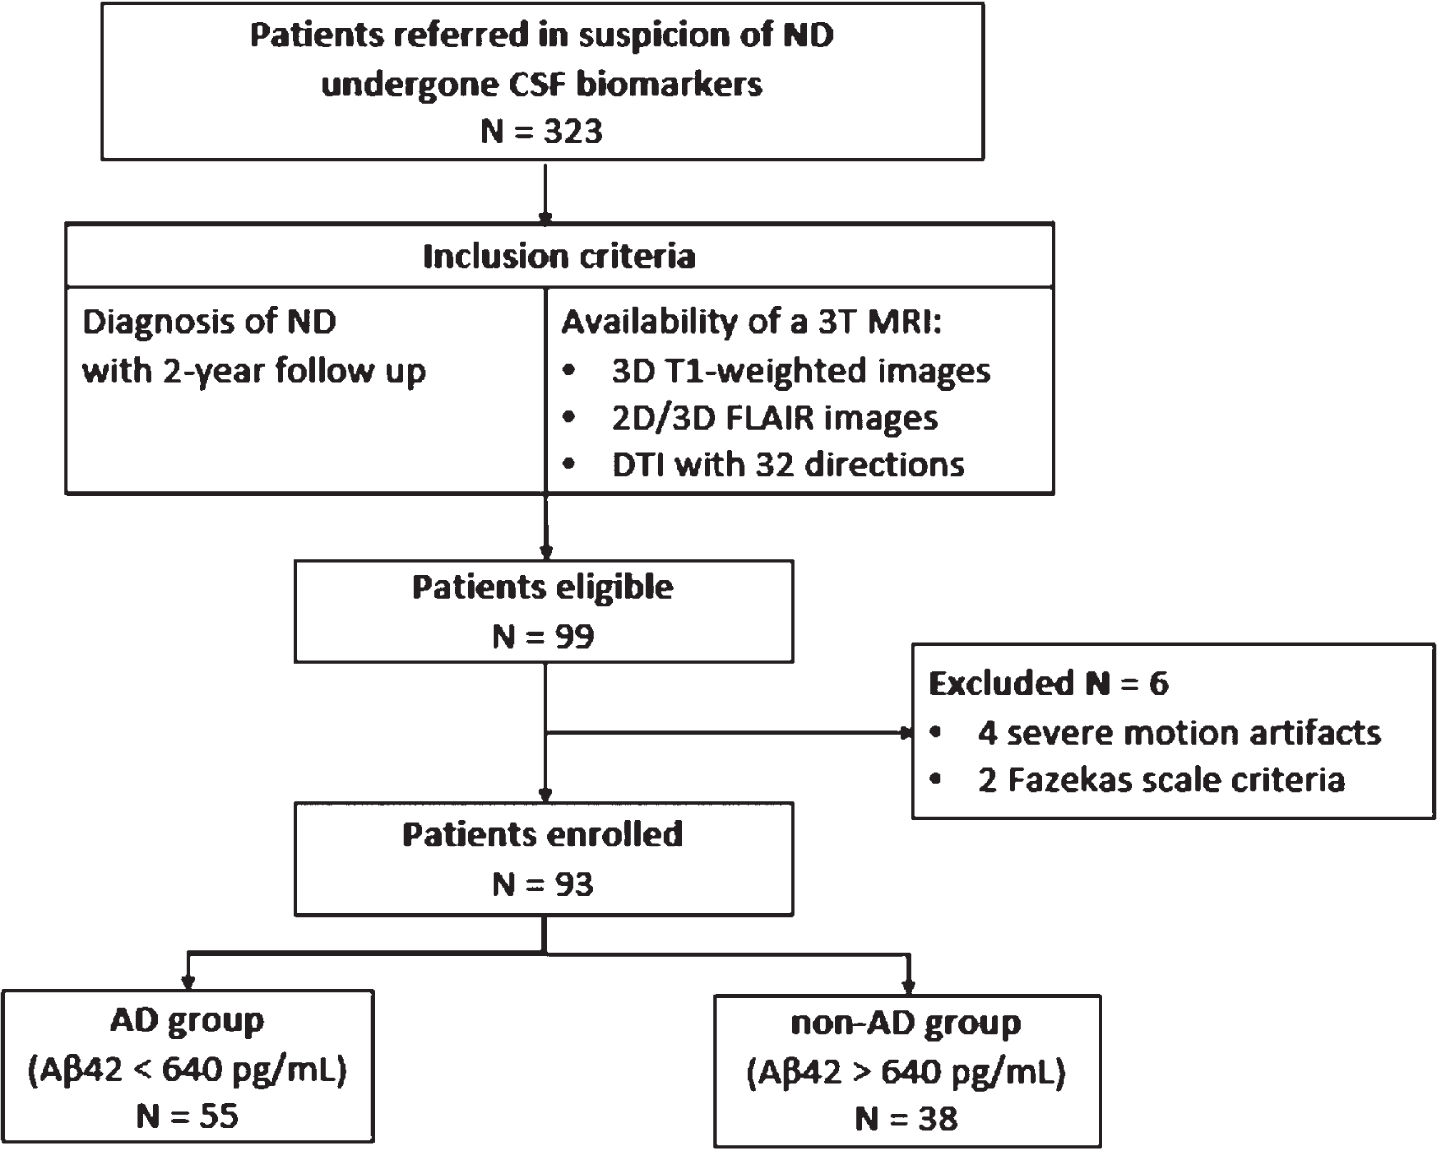
Patients’ enrollment and classification. ND, neurodege-nerative dementia; CSF, cerebrospinal fluid; N, number of patients; DTI, diffusion tensor imaging; Aβ, amyloid-β; AD, neurodegenerative dementia with abnormal Aβ value; non-AD, neurodegenerative dementia with normal Aβ value.
A group of healthy control (HC) subjects was also recruited among volunteers and non-blood relatives of the patients between January 2018 and August 2018. HC enrollment was performed according to the following criteria: 1) age included in the age range of ND patients; 2) MMSE higher than 27; 3) absence of auditory and visual impairment, psychiatric conditions, or any systemic disease that could impair cognitive functions. The exclusion criteria of the HC group were severe motion artifacts or cerebral vasculopathy according to the Fazekas scale.
This retrospective study was approved by the Institutional Review Board of the Fondazione IRCCS Ca’ Granda Ospedale Maggiore Policlinico. All subjects (or their caregivers) gave their written informed consent. The work has been carried out in accordance with the Declaration of Helsinki for experiments involving humans.
MR image acquisition and processing
Whole brain images were acquired in a 3T scan-ner (Philips Achieva, Philips Healthcare, Best, The Netherlands). The MRI protocol included 3D T1-weighted, 2D or 3D FLAIR and DTI sequences with parameters as follows. 3DT1: TR = 9.8 ms, TE = 4.6 ms, flip angle = 8°, voxel = 0.94×0.94×1 mm, matrix = 256×256, 2D FLAIR: TR = 11000 ms, TE = 125 ms, voxel = 0.4×0.4×5 mm, matrix 512×512; 3D FLAIR: TR = 4800 ms, TE = 307.8 ms, voxel = 0.6×1.1×0.6 mm, matrix = 448×448; DTI with 32 gradient directions: TR = 9963.4 ms; TE = 55 ms; voxel = 2×2×2 mm; matrix = 112×112; b-value = 1000 s/mm2.
MR images were clinically evaluated and processed at Fondazione IRCCS Ca’ Granda Ospedale Maggiore Policlinico. The amount of WM T2-hyperintense lesions in periventricular WM and DWM was rated in consensus by two neuroradiologists according to the Fazekas scale [20]. Participants rated 3 in periventricular WM or DWM were excluded from the study.
Lobar SWM segmentation
Fully automatic segmentation was performed on the 3DT1-weighted images using the open-source software FreeSurfer (Laboratory for Computational Neuroimaging, Athinoula A. Martinos Center for Biomedical Imaging). A WM segmentation was performed according to the cortical parcellation [21]. The segmented WM regions of interest (ROIs) were grouped into frontal, parietal, temporal, and occipital lobes in each hemisphere.
We derived the transformation matrix that moved the images from the native space to the Montreal Neurological Institute (MNI) space. Each T1-weighted image was non-linearly transformed to MNI space using the Advanced Normalization Tools algorithm (Penn Image Computing & Science Lab, University of Pennsylvania). The WM segmentation was transported from the native space (defined by the T1-weighted image) to the MNI space, applying the same transformation.
According to Oishi et al. [22], the SWM was defined in MNI space as a part of the WM that is both adjacent to the cortex and is not included in any of the DWM regions of the ICBM-DTI-81 WM atlas [23]. Thus, the lobar SWM ROIs were defined as removing from the WM mask the voxels in correspondence of the tracts belonging to the ICBM-DTI-81 WM atlas. The resulting lobar SWM ROIs are shown overlapped on the 3DT1-weighted images in Fig. 2A.

A) Lobar SWM ROIs on 3DT1-weighted images: frontal (red), parietal (green), temporal (yellow), and occipital (blue); B) FA color map on 3DT1-weighted images in correspondence of the lobar SWM ROIs.
DTI processing
First, diffusion data were inspected with FSLeyes [Wellcome Centre for Integrative Neuroimaging (FMRIB), University of Oxford] to remove volu-mes with severe artifacts. Then, diffusion-weighted images were processed with the software ExploreDTI [24]. Images were corrected for subject motion, eddy current, and echo-planar imaging (EPI) induced geometric distortions in a single interpolation step to minimize the blurring effects.
The four DTI-derived maps of fractional aniso-tropy (FA), mean diffusivity (MD), axial diffusivity (L1), and radial diffusivity (RD) were calculated from the corrected DTI images in ExploreDTI. The EPI correction resulted in diffusion-weighted images non-rigidly transformed to the T1-weighted images. The transformation matrix computed in the previous paragraph was also applied to each DTI-derived map to move them to the MNI space.
In Fig. 2B, the FA color map is shown overlapped on the 3DT1-weighted image in correspondence with the lobar SWM ROIs.
DTI measurements in the SWM
A ROI-based extraction was performed in MATLAB (The Mathworks, Inc.) R2018b. The mean value of the 4 DTI parameters (FA, MD, L1, RD) was computed into the frontal, parietal, temporal, and occipital lobar ROIs of the SWM in the two hemispheres.
Statistical analysis
The statistical analysis of the data was performed in IBM SPSS Statistics v. 25. The significance level was set to 0.05. Non-normality of data (as assessed by Shapiro-Wilk tests) suggested to apply non-parametric statistical tests.
The Kruskal-Wallis test was used to compare quan-titative variables among groups (age, disease duration, Aβ42, t-tau, p-tau, MMSE, and the mean value of the DTI-derived parameter FA, MD, L1, RD). A Chi-square test was used to compare qualitative variables (gender). When the Kruskal-Wallis test reached statistical significance, between-group post hoc tests were performed with Dunn-Bonferroni correction for multiple comparisons.
Spearman’s correlation tests were performed bet-ween Aβ42 and t-tau, p-tau, disease duration, and MMSE. Then, the Spearman’s correlations were tested between each DTI measure and Aβ42, t-tau, p-tau, disease duration, and MMSE (HC were also included in the latter). According to the results of the previous group-based analysis, we considered the cases as a continuum in the correlation analysis.
RESULTS
Demographic and clinical data analysis
A total of 103 subjects were included in the study: 55 AD patients, 38 non-AD patients, and 10 HCs. The demographics of the study participants are presented in Table 1. No statistically significant differences were found among the groups in terms of age (H(2) = 2.153, p = 0.341), gender (χ2(2) = 0.719, p = 0.698), and disease duration (U = 1091.5, p = 0.713). Statistically significant differences were evidenced in Aβ42 (U = 2090, p < 0.001), t-tau (U = 701.5, p = 0.007), and p-tau (U = 688, p = 0.009). We found a statistically significant difference among groups in terms of MMSE (H(2) = 17.122, p < 0.001): both AD and non-AD showed lower MMSE compared to HC (p < 0.005), while no differences were demonstrated between AD and non-AD.
Demographic and clinical data of the study participants
Aβ, amyloid-β; AD, neurodegenerative dementia with abnormal Aβ value; non-AD, neurodegenerative dementia with normal Aβ value; HC, healthy controls; IQR, interquartile range; MMSE, Mini-Mental State Examination; t-tau, total-tau; p-tau, phosphorylated tau.
Statistically significant correlations were observed between CSF levels of Aβ42 and t-tau (ρ= –0.298, p = 0.004) and p-tau (ρ= –0.251, p = 0.016). No significant correlations were found between CSF Aβ42 and disease duration (ρ= 0.013, p = 0.905) and MMSE (ρ= 0.163, p = 0.118).
SWM alterations in AD and non-AD
The Kruskal-Wallis tests showed large statistically significant among-group differences in the DTI measures in each lobar SWM ROI, and post-hoc tests highlighted the specific between-group differences as summarized in Table 2. The DTI measures in the SWM in the study groups are reported in Supplementary Table 1.
DTI measures in the lobar SWM ROIs group comparison: A) Kruskal-Wallis tests. p-values < 0.05 are represented in bold; B) Between-group comparison. Dark grey and light grey represent significant increase and decrease of the first group with respect to the second group, respectively. FA, fractional anisotropy; MD, mean diffusivity; L1, axial diffusivity; RD, radial diffusivity; SWM, superficial white matter; lh, left hemisphere; rh, right hemisphere; Aβ, amyloid-β; AD, neurodegenerative dementia with abnormal Aβ value; non-AD, neurodegenerative dementia with normal Aβ value; HC, healthy controls
In the group comparison between AD and HC, all DTI parameters differed significantly across all lobar SWM ROIs. AD showed a significant decrease in FA and an increase in MD, L1, and RD.
In the group comparison between non-AD and HC, statistically significant differences in FA, MD, and RD were detected bilaterally in the frontal, parietal, and temporal SWM and in L1 in the right frontal SWM. Specifically, non-AD showed significant decreases in FA and increases in MD and RD compared to HC.
No significant difference in terms of FA and RD was found between AD and non-AD groups. AD showed a statistically significant increase in MD and L1 in the left parietal SWM compared to non-AD.
Figure 3 shows the DTI measures FA, MD, L1, and RD in the parietal SWM in the study groups.

DTI measures in the parietal SWM in the study groups: A) FA, B) MD, C) L1, and D) RD. MD, L1, and RD are expressed in m2s–1x10⁻⁴. AD group is represented in red, non-AD in blue and HC in green. Significance levels p < 0.05, p < 0.01, and p < 0.001 are respectively represented as *, **, ***. FA, fractional anisotropy; MD, mean diffusivity; L1, axial diffusivity; RD, radial diffusivity; SWM, superficial white matter; Aβ, amyloid-β; AD, neurodegenerative dementia with abnormal Aβ value; non-AD, neurodegenerative dementia with normal Aβ value; HC, healthy controls; lh, left hemisphere; rh, right hemisphere.
Correlations between DTI in SWM and CSF biomarkers
The results of Spearman’s correlations tests computed between the DTI measures and the CSF biomarkers (Aβ42, t-tau, p-tau) are shown in statistical maps in Fig. 4.

Statistical maps showing the correlation between the DTI measures in the SWM and the CSF biomarkers. Correlation p-values are represented in logarithmic scale within statistically significant lobar SWM ROIs. Positive and negative correlation coefficients are highlighted with warm and cold colorbars, respectively. FA, fractional anisotropy; MD, mean diffusivity; L1, axial diffusivity; RD, radial diffusivity; Aβ, amyloid-β; t-tau, total-tau; p-tau, phosphorylated-tau; L, left; R, right; ρ, correlation coefficient.
Aβ42
CSF Aβ42 showed significant positive correlations with FA in all the lobar SWM ROIs. CSF Aβ42 showed significant negative correlations with L1, MD, and RD in the parietal SWM bilaterally, with MD in left temporal and right occipital SWM, and with RD in left temporal and occipital SWM.
The MD measured in the left parietal SWM is plotted along with the CSF Aβ42 in Fig. 5A.
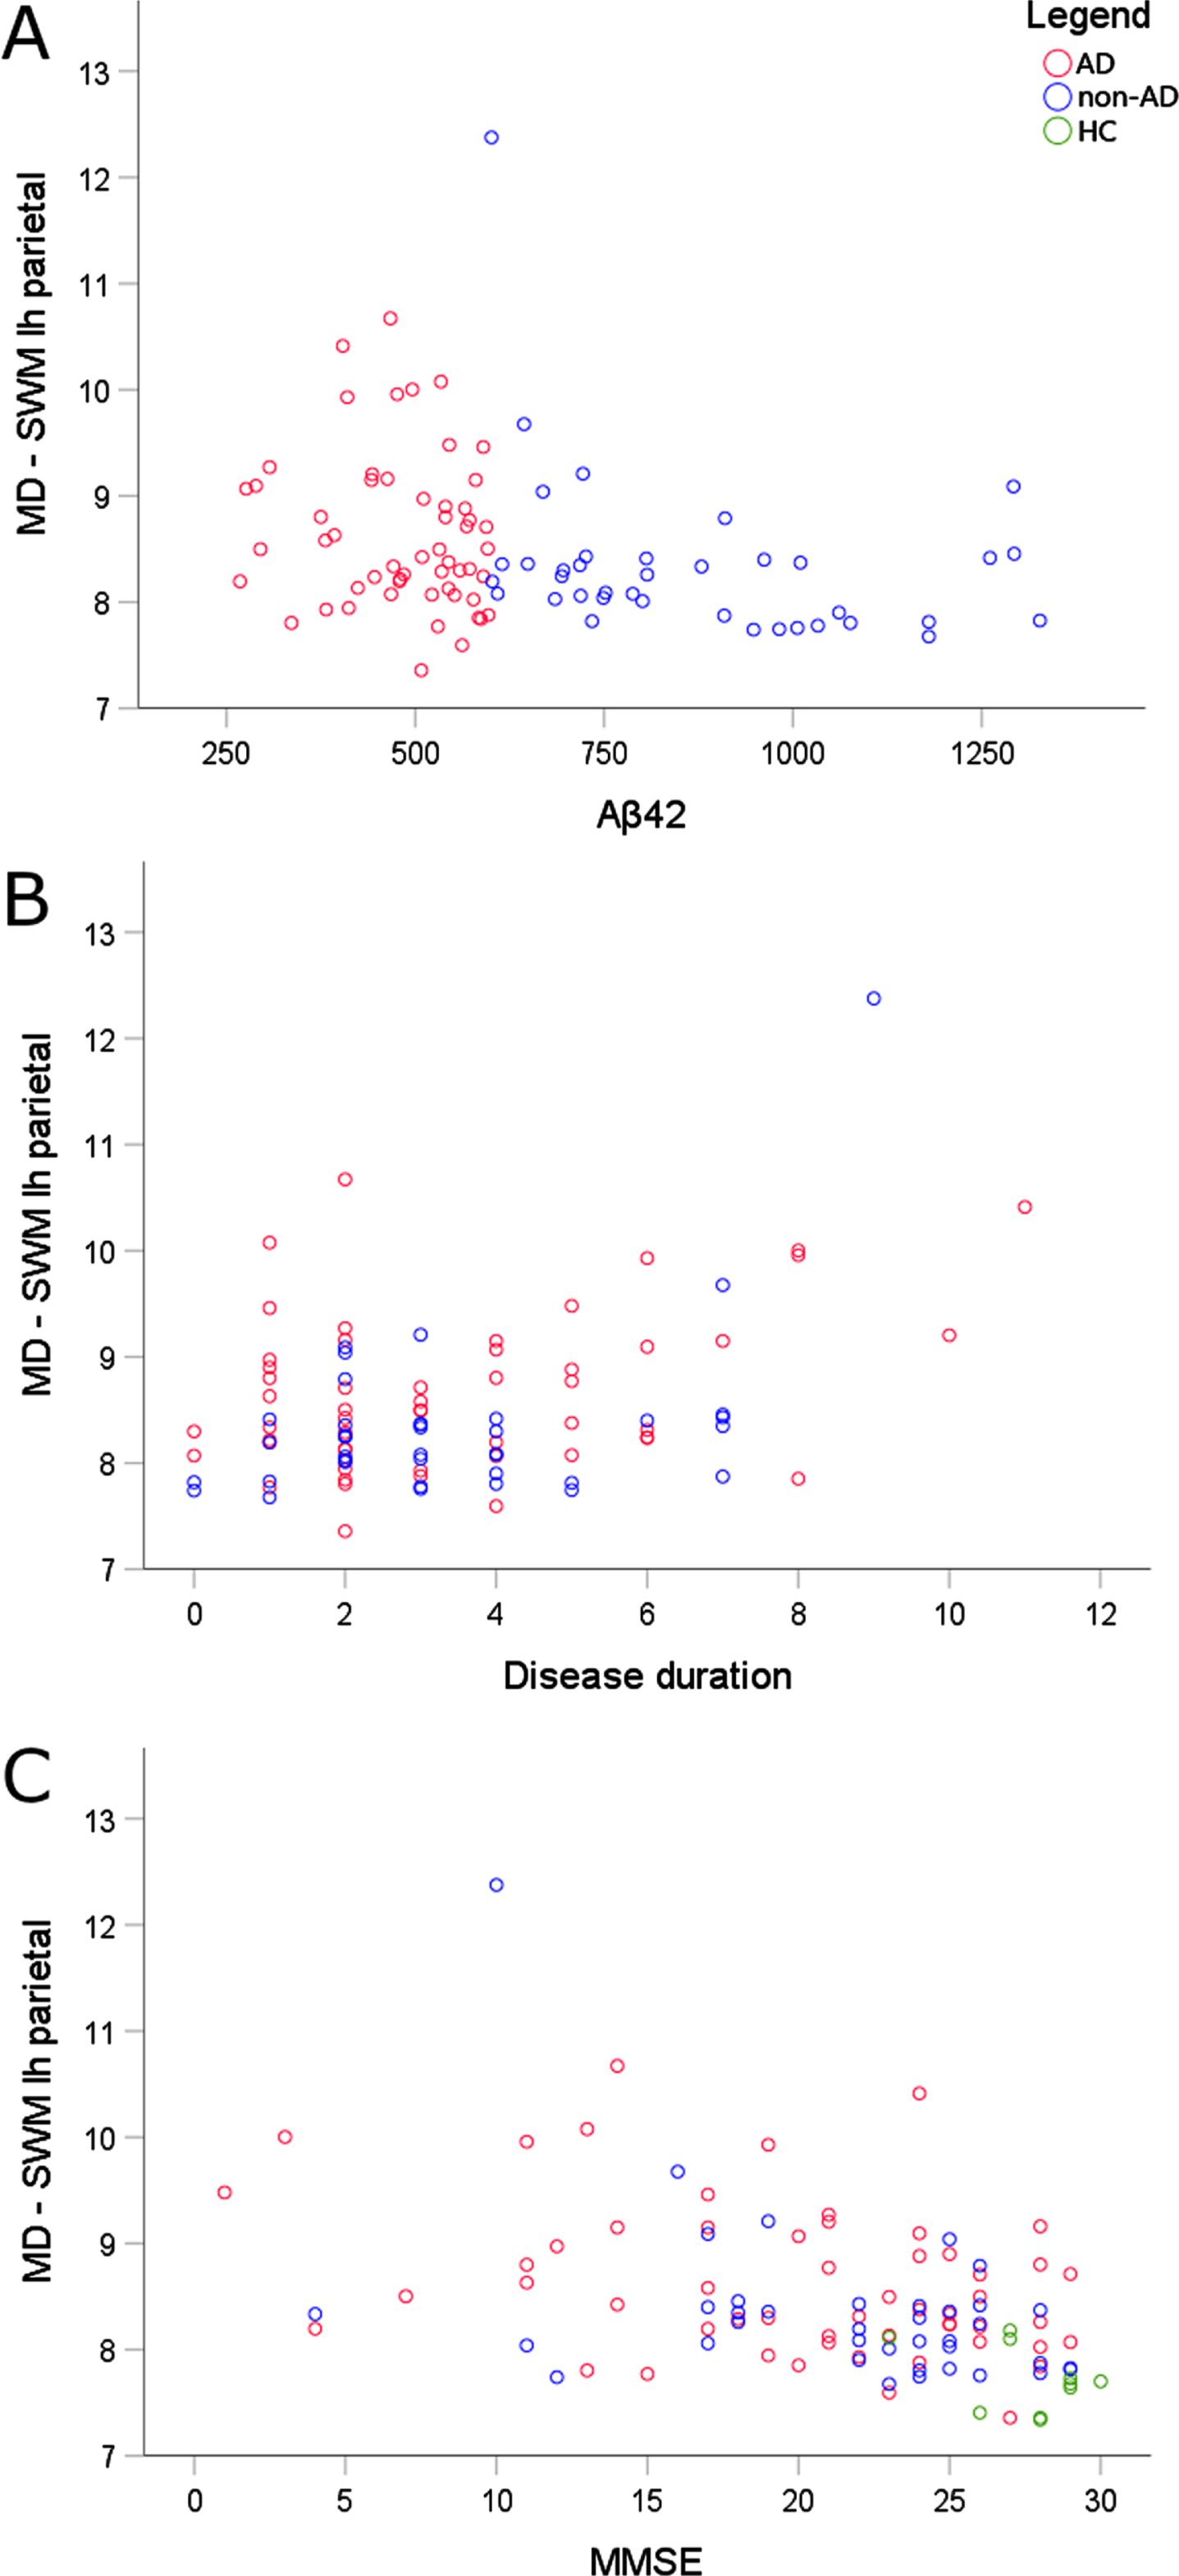
Relationships between the MD measured in the SWM of the left parietal lobe and A) Aβ42, B) disease duration, and C) MMSE. Scatterplots are colored according to the study group: AD in red, non-AD in blue, HC in green. MD is expressed in m2s–1x10⁻⁴. Aβ42 is expressed in pg/mL. Disease duration is expressed in years. MD, mean diffusivity; SWM, superficial white matter; lh, left hemisphere; Aβ, amyloid-β; MMSE, Mini-Mental State Examination; AD, neurodegenerative dementia with abnormal Aβ value; non-AD, neurodegenerative dementia with normal Aβ value; HC, healthy controls.
t-tau
CSF t-tau showed significant positive correlations with L1, MD, and RD bilaterally in frontal, parietal, and right temporal SWM and with L1 in the right occipital SWM. No significant correlations between CSF t-tau and FA were detected.
p-tau
CSF p-tau showed positive correlations with L1, MD, and RD in the right frontal, parietal, and temporal SWM. No significant correlations between CSF p-tau and FA were detected.
Correlation between DTI in SWM and clinical data
The results of Spearman’s correlations tests between DTI measures and disease duration and MMSE are shown in statistical maps in Fig. 6.
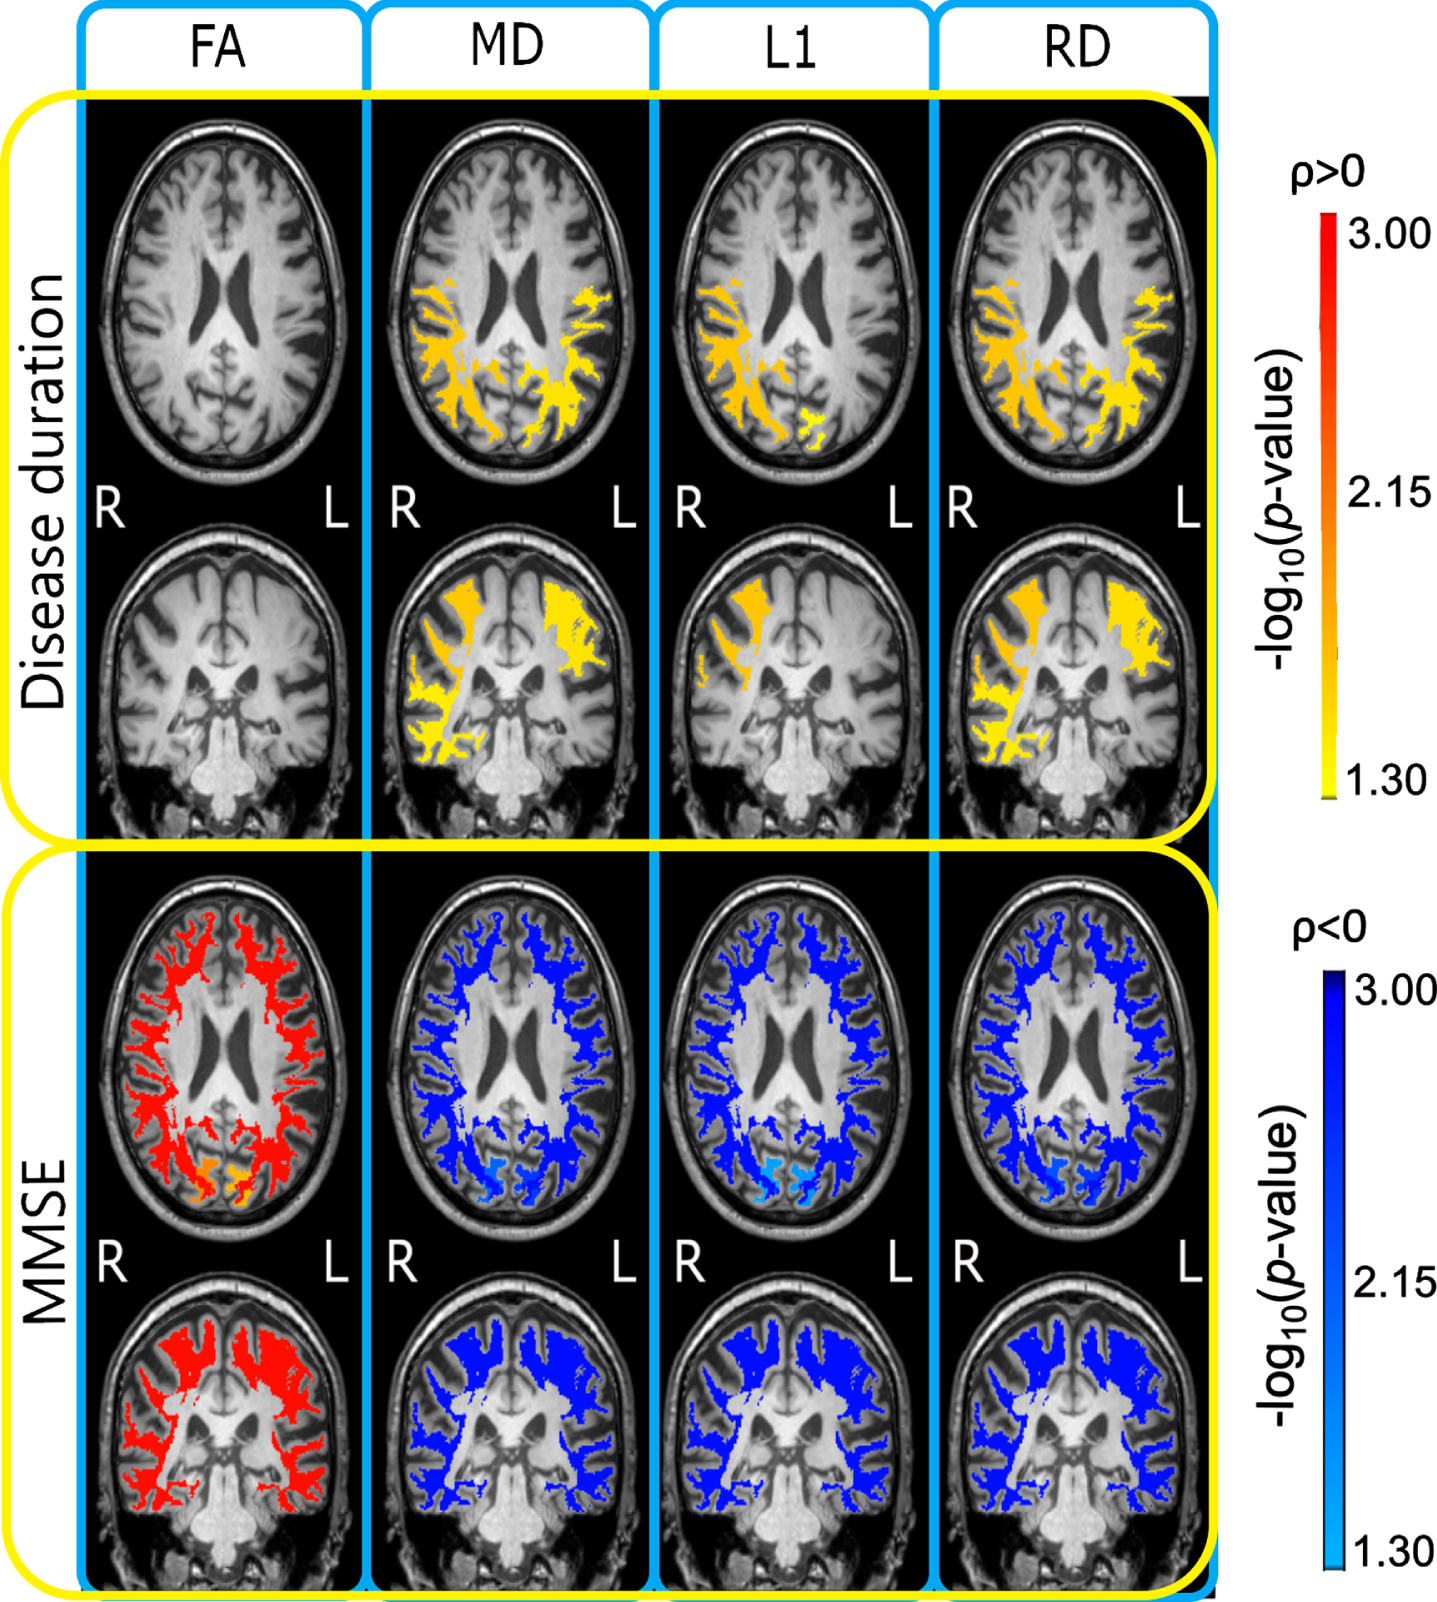
Statistical maps showing the correlations between DTI measures and disease duration and MMSE. Correlation p-values are represented in logarithmic scale within statistically significant ROIs. Positive and negative correlation coefficients are highlighted respectively with warm and cold color bars. FA, fractional anisotropy; MD, mean diffusivity; L1, axial diffusivity; RD, radial diffusivity; MMSE, Mini-Mental State Examination; L, left; R, right; ρ, correlation coefficient.
Disease duration
A significant positive correlation between disease duration and MD and RD was shown bilaterally in the parietal lobe and in the right temporal lobe. A significant positive correlation between disease duration and L1 was shown in the right parietal and left occipital lobes. No significant correlations between disease duration and FA were detected.
The MD measured in the left parietal SWM is plotted along with the disease duration in Fig. 5B.
MMSE
All the tested DTI measures showed a statistically significant correlation with MMSE. FA showed a correlation with MMSE with positive correlation coefficients while MD, L1, and RD with negative correlation coefficients.
The MD measured in the left parietal SWM is plotted along with the MMSE in Fig. 5C.
DISCUSSION
Large alterations were detected throughout the SWM in the AD group. The lower FA and higher MD, L1, and RD suggest damage in the SWM microstructure with fiber injury, degeneration, and myelin breakdown [25]. The findings are a coherent extension and strengthening of the evidence of SWM alterations detected by DTI in clinically-defined AD patients [12–14].
Widespread abnormalities across the SWM regions were also found in the non-AD group. FA, MD, and RD were altered bilaterally in the frontal, parietal, and temporal SWM, while L1 was impaired exclusively in the right frontal lobe suggesting a prominent myelin disruption with more spared axonal integrity. To our knowledge, this is the first study that investigates the SWM alterations in non-AD patients. However, previous DTI studies reported WM changes in Lewy body dementia [26] and frontotemporal dementia [27].
Interestingly, AD exhibited more altered MD and L1 than non-AD in the left parietal lobe (Table 2, Fig. 3). A similar trend was also observed in MD and L1 in the right parietal lobe as well as in RD in the parietal lobe bilaterally. Previous neuroimaging studies already highlighted the relevance of the parietal lobe involvement in the early stages of AD and its role as an AD biomarker [28, 29]. The vulnerability of the parietal lobe to neurodegeneration may be the consequence of its specific vascularization, metabolism, and anatomical organization [30].
The clinical data showed correlations with the DTI measure in the SWM. The MMSE correlated with the DTI measures diffusely across the SWM. Lower FA and higher MD, L1, and RD were associated with lower MMSE scores. Our results suggest that the damage of the SWM microstructure could contribute to the cognitive decline due to the progressive disconnection between the cerebral regions, enforcing previous evidence [13, 14]. In addition, the disease duration showed a positive correlation with MD, L1, and RD, mostly in the parietal lobe. This might indicate that the SWM in the parietal lobe is particularly vulnerable to neurodegeneration and that the damage increases with time.
Notably, the present study also revealed strong relationships between the SWM alterations measured in vivo non-invasively by DTI and the CSF biomarkers. CSF Aβ showed strong correlations widespread throughout the SWM lobar regions (especially with FA). Among them, the parietal SWM showed the most evident impairment as suggested by changes in all the DTI measures. CSF t-tau and p-tau showed similar correlations with the DTI measures in the SWM, restricted to MD, L1, and RD and less diffusely across the lobes than CSF Aβ. None of the previous studies investigated the association between DTI measures in the SWM and the CSF biomarkers. However, our findings are in line with previous investigations showing that WM damage correlates with CSF Aβ42 levels in AD patients [31] and with t-tau levels in the temporal lobe in adults at risk of developing AD [32, 33].
We may argue that in vivo measures of the SWM alterations based on user-independent DTI contribute to filling the gap of knowledge between the abnormal protein deposition, that occurs very early in the preclinical phase, and the cognitive decline that may come decades later. Indeed, the decline in CSF Aβ level begins before the clinical phase in AD and approaches a plateau when symptoms are observable [5]. Aβ is toxic to oligodendrocytes [34] and its increase triggers a cascade of neuropathological events, including inflammation [35], demyelination, death of oligodendroglial cells, and mild glial reaction, as well as neuronal dysfunction and alterations in the neurotransmission [36]. All these interconnected processes concur to the establishment of a disruptive self-maintaining mechanism of WM damage progression that ultimately leads to neurodegeneration [37]. In line with this hypothesis, SWM late-myelinating oligodendrocytes seem to be especially vulnerable to neuroinflammatory and neurodegenerative processes [38]. While no direct correlation was found between CSF Aβ42 and clinical variables, the DTI measures in the SWM correlated with both CSF Aβ42 and clinical variables. Figure 5 shows that the DTI measures in the SWM are linked to the CSF Aβ42 levels by a non-linear decreasing monotonic association (Fig. 5A), while more linear-like associations are observed with both disease duration (Fig. 5B) and MMSE (Fig. 5C).
Interestingly, the present study demonstrates that diffuse SWM alterations also occur in non-amyloid pathology, thus suggesting that different, maybe synergical, pathogenic factors might participate in the degenerative phenomena leading to SWM changes that worsen along with time and cognitive decline.
Other techniques involving the SWM might be beneficial to differential diagnosis, such as non Invasive Brain Stimulation (NIBS) that was demonstrated to be very accurate to discriminate different NDs [39]. However, no correlations were demonstrated with CSF biomarkers [40]. Hence, the study of the SWM in NDs might benefit from the complementarities of NIBS and DTI, since the parameters of the latter showed instead very strong correlations, opening up opportunities for preclinical biomarker investigations.
Despite the relevance of SWM in the degenerative processes [38], only a few DTI investigations have focused on SWM [10–14]. While those studies provided the first in vivo evidence of SWM alterations, they focused on AD only, defined according to the syndromal diagnostic construct. In line with recent works [2, 41], we instead built an investigation based on the biological construct through the CSF Aβ levels. In addition, the DTI-based approach employed in this work might overcome the technical limitations of the previous studies based on tractography [10–12, 14]. The tractography reconstruction algorithms are susceptible to artifacts that might lead to false positive and false negative fibers [9]. Furthermore, the tractography-based methods are limited for extracting pathways with certainty in SWM regions characterized by a high degree of crossing and kissing fibers [22]. Atlas-based ROIs methods might overcome the limitations on reproducibility and time consumption of tractography methods based on hand-drawn ROIs/seeds. To our knowledge, only the Phillips et al. [13] and Bigham et al. [14] studies adopted tractography-free approaches. Regarding the ROI-based analysis of Bigham et al. [14], the present work shares a common definition of SWM [22]. Nevertheless, a more anatomical T1-based reference was used to obtain the WM under the cortical gyri instead of an empirical threshold of FA images.
Some limitations of the present study have to be acknowledged. First, a postmortem identification of the neurofibrillary tangles and abnormal plaque deposits in the brain would be necessary for diagnostic confirmation. Although CSF Aβ42 is a robust biomarker of AD pathology, none of the CSF/PET biomarkers are as sensitive as a direct examination of tissue at autopsy [2]. Second, the ROI-based analysis did not allow to define the contribution of the different types of fibers that are present in the SWM. Indeed, the SWM comprises both U-shaped association fibers (arching through the cortical sulci to connect neighboring gyri) and the termination fibers from DWM pathways. Postmortem combined MRI-clinicopathological investigations would allow a more in-depth investigation into the complex pathological phenomena occurring in the SWM and validate the degenerative processes suggested by the present study in AD and non-AD ND.
While those issues might benefit from post-mortem investigations, we believe that higher priority should be given to in vivo investigation in the SWM in very early ND or, more challenging, presymptomatic mutation carriers and individuals at higher risk of developing ND. Those investigations would allow to define whether the SWM alterations are detectable before the cortical atrophy and the DWM degeneration. That was already suggested by WM changes observed independently to GM atrophy in AD [8] and by the larger vulnerability to degeneration in the SWM than DWM [15, 38]. Here, this hypothesis is further strengthened by the strong relationships evidenced between the SWM alterations and the CSF biomarkers that are already sensitive in the very early preclinical phase.
In conclusion, the study shows that the SWM is diffusely affected in both AD and non-AD ND while differences between the two lies in the severity of the alterations, especially in the parietal SWM. DTI might serve as an in vivo user-independent tool to detect and localize the SWM alterations occurring in ND. Moreover, the study provides the first evidence that the SWM alterations are linked to both cognitive decline and diagnostic CSF biomarkers. In light of the strong relationship with the CSF biomarkers, further efforts should be made to evaluate the DTI in the SWM as an in vivo non-invasive biomarker in the preclinical phase of the disease.