



Abstract
Background:
A long-term follow-up study in patients with amnestic mild cognitive impairment (aMCI) is needed to elucidate the association between regional brain volume and psychopathological mechanisms of Alzheimer’s disease with psychosis (AD + P).
Objective:
The purpose of this study was to investigate the effect of the thickness of the angular cingulate cortex (ACC) on the risk of AD + P conversion in patients with aMCI.
Methods:
This was a hospital-based prospective longitudinal study including 174 patients with aMCI. The main outcome measure was time-to-progression from aMCI to AD + P. Subregions of the ACC (rostral ACC, rACC; caudal ACC, cACC) and hippocampus (HC) were measured as regions of interest with magnetic resonance imaging and the Freesurfer analysis at baseline. Survival analysis with time to incident AD + P as an event variable was calculated with Cox proportional hazards models using the subregions of the ACC and HC as a continuous variable.
Results:
Cox proportional hazard analyses showed that the risk of AD + P was associated with sub-regional ACC thickness but not HC volume: reduced cortical thickness of the left cACC (HR [95%CI], 0.224 [0.087–0.575], p = 0.002), right cACC (HR [95%CI], 0.318 [0.132–0.768], p = 0.011). This association of the cACC with the risk of AD also remained significant when adjusted for HC volume.
Conclusion:
We found that reduced cortical thickness of the cACC is a predictor of aMCI conversion to AD + P, independent of HC, suggesting that the ACC plays a vital role in the underlying pathogenesis of AD + P.
Keywords
INTRODUCTION
Many efforts have been made to identify the underlying mechanisms of psychosis in Alzheimer’s disease (AD). Early epidemiological [1] and neuroimaging [2, 3] studies have suggested that psychosis is a psychological response to cognitive decline. AD with psychosis (AD + P) has significantly worse cognitive function [1] and greater medial temporal atrophy [2, 3] compared to AD without psychosis (AD-P). These results imply that severe cognitive decline due to exacerbation of AD may be the cause of psychosis [4]. However, evidence from genetics [5, 6], neuropathology [7, 8], and neuroimaging [9–12] studies suggest that AD + P may have a neurobiology that is distinct from that of AD-P. Genetic studies have indicated that the risk for AD + P is transmitted in families [5]. Some neuropathological studies have shown that AD + P is associated with decreased soluble amyloid-β (Aβ) 1–40 levels [7] and increased neurofibrillary tangle density in neocortical regions, including the prefrontal cortex, but not the hippocampus or entorhinal cortex [8]. Recent neuroimaging studies have reported that AD + P is associated with exaggerated reductions in gray matter volume [9], blood flow [10, 11], and glucose metabolism [12] in the frontal lobe rather than in the medial temporal lobe. These findings suggest that cortical alterations in the frontal regions may be a key pathophysiological mechanism for the development of AD + P [5].
However, most previous structural neuroimaging studies in this area have measured AD + P and regional brain volume concurrently. Consequently, they are limited in establishing a temporal relationship between AD + PAD + P and regional brain volume. It remains unclear whether frontal atrophies underlying psychosis develop before or after the onset of AD + P. Another limitation is that to date, most previous studies on the relationship between regional brain volume and AD + P have typically focused on patients with AD. However, given that the most rapid increase in the rates of psychosis occurs during the transition from mild cognitive impairment (MCI) to the early and middle stages of dementia [1, 13], neuroimaging studies in individuals with MCI are clearly needed before research findings can be interpreted as having a potential causative role in psychosis. Therefore, a long-term follow-up study in patients with amnestic MCI (aMCI) is necessary to address these limitations.
The purpose of this study was to investigate the effect of sub-regional thickness in the frontal lobe on the risk of AD + P conversion in patients with aMCI. In particular, we determined that its association with the risk of incident AD + P was independent of hippocampal atrophy, a core neuroimaging feature of AD. We chose the anterior cingulate cortex (ACC) as a region of interest among the frontal sub-regions, as abnormalities in this region are frequently implicated in the pathophysiology of psychotic disorders [5, 15]. Based on previous studies [5–12], we hypothesized that the ACC is a predictor of AD + P conversion in patients with aMCI, independent of HC volume. To test this hypothesis, a longitudinal follow-up study was performed in subjects with aMCI at regular intervals to investigate time-to-progression from aMCI to AD + P.
METHOD
Participants
In this study, participants with aMCI were recruited from a memory impairment clinic at Pusan National University Hospital in South Korea between June 2015 and March 2019. A diagnosis of aMCI was made using the following Petersen’s criteria [16]: 1) subjective memory complaints by patients or caregivers; 2) objective memory impairment based on the word list delayed recall test (Seoul Verbal Learning Test-delayed recall, SVLT-delayed recall) [17] with a cut-off score of 1.5 SD under population mean standardized for age and sex; 3) normal activities of daily living (ADL), based on clinical findings and the Seoul Instrumental Activities of Daily Living (S-IADL) [18]; and 4) the absence of dementia. The exclusion criteria for all participants were as follows: 1) significant psychiatric conditions (e.g., delirium, bipolar disorder, major depressive disorder, schizophrenia and other psychotic disorders, substance abuse); 2) significant cerebrovascular conditions (e.g., severe white matter hyperintensities with Fazekas scale 3, multiple (more than five) lacunes, hemorrhages, or tumors); 3) AD or other neurodegenerative diseases (e.g., dementia with Lewy bodies, frontotemporal dementia, Parkinson’s disease); 4) significant medical conditions (e.g., severe organ failure, metabolic or hematologic disorders, clinically significant abnormal laboratory findings); and 5) history of taking antipsychotic drugs within the past 1 year. This study was approved by the Institutional Review Board of the Pusan National University Hospital, and both the subjects and their caregivers were asked to sign a consent form after being informed of the purpose and procedures of this study. All methods were performed following the relevant guidelines and regulations.
Study design
This is a prospective observational study on the association between the ACC and HC with conversion from aMCI to AD + P. At baseline, all participants underwent a standardized dementia screening consisting of the following: a patient history from either the patient or an informant, medical and neurological examinations, the Korean version of the Neuropsychiatric Inventory (K-NPI) [19], the clinical dementia rating score-sum of box (CDR-SOB) [20] for evaluation of dementia severity, the Seoul Neuropsychological Screening Battery (SNSB) [17] for comprehensive neuropsychological assessment, S-IADL [18] for complex activities of daily living, and brain magnetic resonance imaging (MRI) for cortical thickness or volume.
In this study, the primary outcome was time-to-progression from aMCI to incident AD + P. The diagnosis of AD + P consisted of two stages: AD was first diagnosed, and then the presence or absence of psychosis was evaluated. First, to determine the presence of AD, follow-ups were conducted by annual visits to our memory clinic, in which a full patient history taking, a neurologic examination, CDR-SOB, SNSB, and S-IADL were repeated. All patients diagnosed with AD routinely visited our memory clinic every 3 months to determine the presence of incident psychosis. AD subjects were censored when AD + P was diagnosed. Patients without AD + P (MCI stable or AD-P) were censored at the time of their most recent follow-up. To determine the presence of psychosis, clinical interviews with psychiatrists were conducted and scales such as the K-NPI [19] were used at baseline and at every 3-month follow-up. Two psychiatrists with expertise in dementia research made the clinical diagnosis of AD + P after reviewing all available raw data, such as clinical interviews and K-NPI. The K-NPI is a valid and reliable tool for assessing the severity and frequency of behavioral and psychiatric symptoms of dementia, including delusions, hallucinations, agitation, dysphoria, anxiety, euphoria, apathy, disinhibition, irritability, aberrant motor behavior, and neurovegetative changes, including nighttime behavior (e.g., sleep disorders) and eating changes (e.g., appetite disorders).
Diagnosis of AD with psychosis
AD was diagnosed using the National Institute of Neurological and Communication Disorders and Stroke and the Alzheimer’s Disease and Related Disorders Association criteria for probable AD [21]. A diagnosis of psychosis was made according to the diagnostic criteria for psychosis of AD proposed by Jeste and Finkel [22]: 1) diagnosis of AD dementia; 2) occurrence of psychosis after diagnosis of dementia; 3) persistent or intermittent delusions, hallucinations, or both for at least 1 month; 4) severe psychotic symptoms are enough to disrupt functioning; and 5) exclusion of schizophrenia and related psychotic disorders (e.g., schizoaffective disorder, delusional disorder, psychotic mood disorder), delirium, and other causes of psychotic symptoms (e.g., substance use and other general medical conditions).
MRI data acquisition and image analysis through Freesurfer
Each participant underwent a structural T1-weighted MRI scan at the baseline evaluation. All images were acquired at the Pusan National University Hospital Imaging Center on a Siemens 3T Trio TIM scanner (Erlangen, Germany). For each participant’s cortical thickness or volume estimations, 3D magnetization-prepared rapid gradient echo sequence was acquired using the following parameters: repetition time = 1800 ms, echo time = 2.07 ms, flip angle = 12°, acquisition matrix = 256×256, field of view (FOV) = 250×250 mm2, slice thickness = 1 mm, and total number of slices = 256. All image acquisitions had the same slice orientation, parallel to the anterior and posterior commissure lines. The movement was restricted to expandable foam cushions. Scans with movement or any other image (reconstruction) artifacts were excluded. The Freesurfer version 5.1 software package (http://surfer.nmr.mgh.harvard.edu/) was used to analyze the cortical thickness or volume on 3-D T1-weighted images [23]. The regions of interest were the subregions of the ACC (rostral ACC, rACC; caudal ACC, cACC) and HC included in the Desikan-Killiany Atlas [24]. We visually examined all images to ensure segmentation accuracy.
Statistical analysis
During the follow-up period, aMCI patients were classified into three groups according to the onset of AD or AD + P: 1) aMCI stable (non-conversion to AD or AD + P), 2) AD converters (conversion to AD), and 3) AD + P converters (conversion to AD + P). Comparisons among the three groups in baseline demographic and clinical characteristics were analyzed using analysis of variance with Bonferroni correction for multiple comparisons for continuous variables and chi-square test for discrete variables. Analysis of covariance (ANCOVA) was used to investigate the differences in the thickness (or volume) of the ACC or HC among the three groups with Bonferroni adjustment for multiple comparisons after controlling for demographic or clinical variables. Bivariate survival analyses were conducted with baseline demographic and clinical characteristics to determine predictors associated with the risk of incident AD + P in patients with aMCI. Significant predictors from bivariate analyses were included as covariates in the multivariate Cox regression analysis. Survival analysis with time to incident AD + P as an event variable was calculated with the multivariable Cox proportional hazards models using each sub-regional ACC thickness or HC volume as a continuous variable with the enter method with an adjustment for other covariates. Separate Cox proportional hazard models were used for each brain area as a predictor. Statistical analyses were performed using the SPSS software (version 20.0, IBM, Inc., Armonk, NY, USA). Statistical significance was defined as p < 0.05.
RESULTS
Demographic and clinical characteristics
A total of 194 patients with aMCI were recruited for the study at baseline. During the longitudinal follow-up, 10 aMCI patients were excluded because they did not complete at least one follow-up. Five MCI patients progressed to other types of dementia (two vascular dementia, two Lewy body dementia, and one frontotemporal lobar degeneration) and were excluded because they were more likely to have pathophysiological mechanisms different from AD + P. Three aMCI patients progressed to aMCI with psychosis and were also excluded to clearly distinguish AD from schizophrenia, delusional disorders, and psychotic mood disorders. One patient with AD who developed psychotic symptoms after steroid use was excluded. One patient with aMCI was excluded because the magnetic resonance imaging (MRI) data contained too much noise to be analyzed using the Freesurfer pipeline. Two patients with AD had psychotic symptoms but their symptoms did not affect their quality of life, thus they were excluded from the analysis. This left the final group of 172 MCI patients (mean age = 72.83±7.93 years; females = 86 (50.0%); mean education = 5.85±4.72 years; CDR-SOB = 1.67±1.48; total brain volume = 1342.82±145.89 cm3). After an average follow-up period of 3.72 (±2.66) years, of all aMCI patients, 94 patients (54.6%) progressed to AD (AD converters) and 18 patients (10.4%) progressed to AD + P converters. See Fig. 1 for the flow diagram.
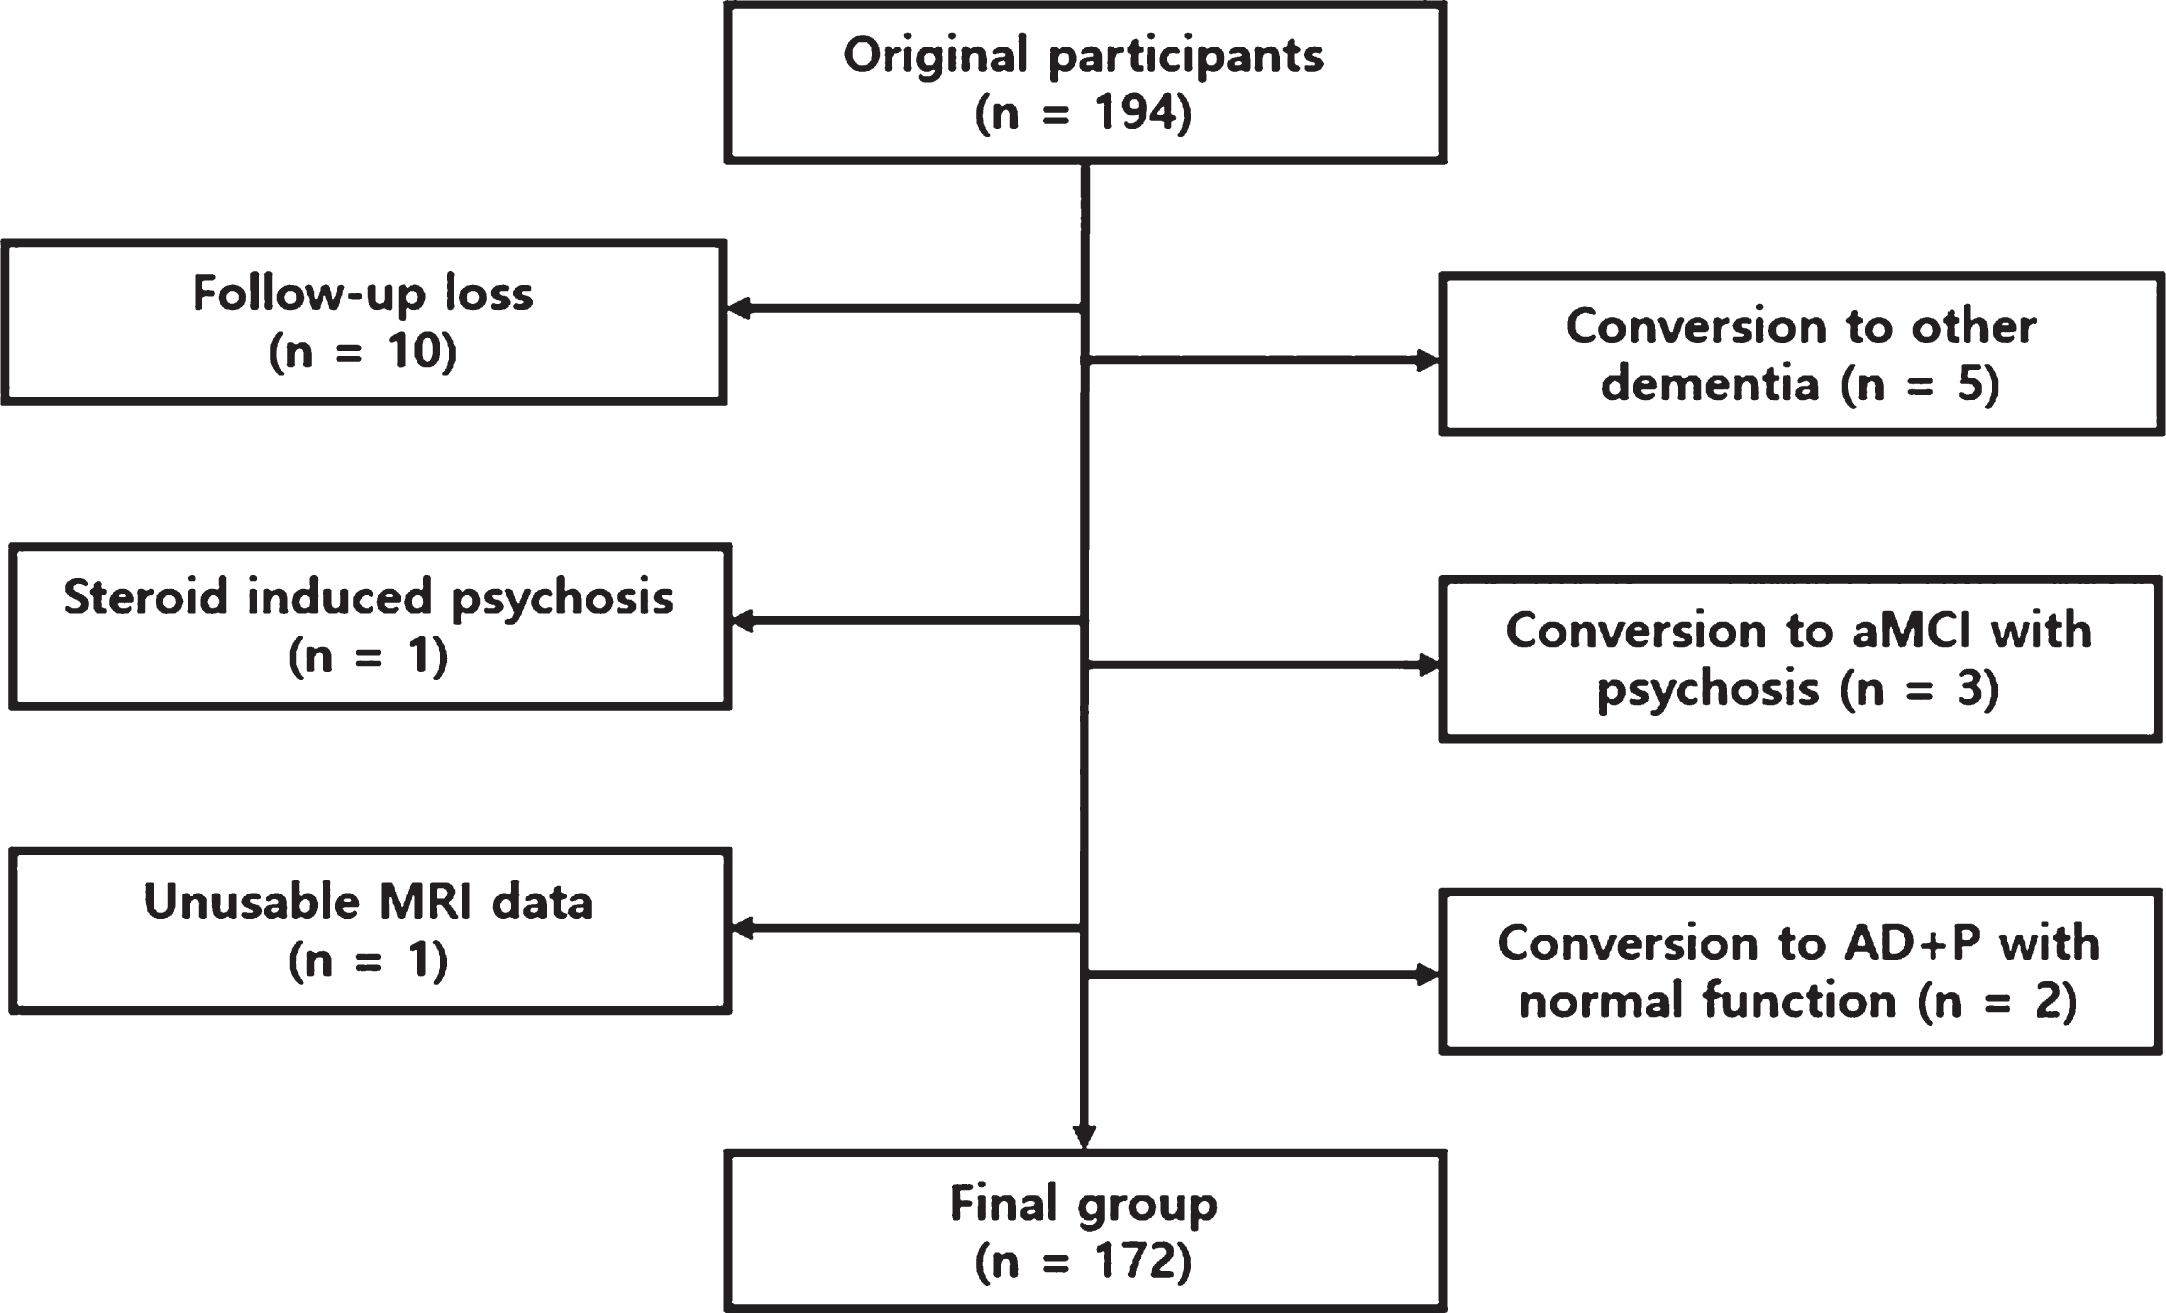
Flow diagram used to exclude participants from study and reach final sample size.
Table 1 describes the demographic and clinical differences among the three groups (MCI stable, AD converters, and AD + P converters). Significant differences in CDR-SOB were detected among the groups (p < 0.05). Patients with AD converters had significantly higher CDR-SOB scores than those in the MCI stable group. There were no significant differences in age, sex, education level, follow-up period, and total brain volume among the groups.
Demographic and clinical characteristics of patients with aMCI
Data are presented as percentage or the mean±standard deviation. p-values are based on analysis of variance (ANOVA) for continuous variables and Chi-square test for discrete variables. The level of significance was set at p < 0.05. A Bonferroni post-hoc test was performed to determine differences between pairs of means. The significant differences among 3 groups were indicated as follow: aMCI stable versus AD converters (Bonferroni test, p < 0.05). aMCI, amnestic-mild cognitive impairment; AD + P, Alzheimer’s disease with psychosis; CDR-SOB, clinical dementia rating-sum of box.
Cingulate subregional thickness and HC volume among three MCI groups
The differences in the cingulate sub-regional thickness and HC volume among the three aMCI groups (aMCI stable, AD converters, and AD + P converters) are shown in Table 2. As there were significant differences among the groups on CDR-SOB, the following ANCOVA models were conducted with the addition of the covariate. A significant difference in the left cACC and both left and right HC volumes across the three groups were detected (p < 0.05). Using post hoc tests (Bonferroni correction), it was found that AD + P converters had thinner left cACC compared to aMCI stable or AD converters (1.91±0.49 versus 2.33±0.47 or 2.19±0.48, p < 0.05). Compared to the aMCI stable group, AD converters showed smaller HC volume on both sides (left HC, 2.70±0.48 versus 2.94±0.47, p < 0.05; right HC, 2.78±0.47 versus 3.03±0.43, p < 0.05). In other cingulate areas, the differences among groups were not statistically significant, but AD + P converters showed a decreasing trend in both rACC (left rACC, p = 0.073; right rACC, p = 0.097) and right cACC (p = 0.083).
The differences on thickness (or volume) of anterior cingulate cortex and hippocampus in patients with aMCI
Data are presented as percentage or the mean±standard deviation. Comparisons between groups were made with analysis of covariance (ANCOVA) with Bonferroni correction after controlling CDR-SOB. The level of significance was set at p < 0.05. The significant differences among 3 groups were indicated as follow: aMCI stable versus AD converters, bMCI stable versus AD + P converters, cAD converters versus AD + P converters. aMCI, amnestic-mild cognitive impairment; AD + P, Alzheimer’s disease with psychosis; L, left; R, right; rACC, rostral anterior cingulate cortex; cACC, caudal anterior cingulate cortex; HC, hippocampus; CDR-SOB, clinical dementia rating-sum of box.
Association of subregional ACC thickness and HC volume with risk of incident AD + P
Bivariate Cox regression analyses were conducted to determine which clinical characteristics were associated with an increased risk of incident AD. As there were no clinical characteristics associated with the risk of AD + P in bivariate analysis, the following Cox proportional hazard models examining the association of sub-regional ACC thickness and HC volume with the risk of incident AD + P were conducted without the addition of covariates.
Cox proportional hazard analyses showed that the risk of AD + P was associated with sub-regional ACC thickness but not HC volume (Tables 3 4). Univariate analyses showed that reduced cortical thickness in the left cACC (HR [95%CI], 0.224 [0.087–0.575], p = 0.002) and right cACC (HR [95%CI], 0.318 [0.132–0.768], p = 0.011) were associated with a higher risk of incident AD + P. This association remained significant when adjusted for both HC volume (left cACC, HR [95%CI], 0.242 [0.093–0.627], p = 0.004; right cACC, HR [95%CI], 0.338 [0.139–0.823], p = 0.017), suggesting that the effect of subregional cACC thickness on the risk of incident AD was independent of HC volume. In the HC, however, no association with the risk of incident AD was found in the univariate analysis (Table 4).
Cox regression analysis for AD + P conversion from aMCI for each anterior cingulate sub-region as a predictor
AD + P, Alzheimer’s disease with psychosis; aMCI, amnestic-mild cognitive impairment; HR, hazard ratio; CI, confidence interval; rACC, rostral anterior cingulate cortex; cACC, caudal anterior cingulate cortex; HC, hippocampus.
Cox regression analysis for AD + P conversion from aMCI for hippocampus as a predictor
AD + P, Alzheimer’s disease with psychosis; aMCI, amnestic-mild cognitive impairment; HR, hazard ratio; CI, confidence interval; HC, hippocampus
DISCUSSION
To the best of our knowledge, this is the first longitudinal MRI study of aMCI to investigate the association between regional brain volume and the conversion from aMCI to AD + P. The strengths of this study include a relatively large sample of aMCI participants, follow-ups over a long period of time, and a sensitive cortical thickness measure of MRI, which may allow us to better identify the psychopathological mechanisms of AD + P. Reduced cortical thickness of the ACC was associated with a higher risk of incident AD + P, and the effect of ACC thickness on the risk of incident AD + P was independent of hippocampal volume. However, no correlations were found between HC volume and the risk of incident AD + P. Taken together, our results suggest that ACC thickness may be more involved than HC volume in the underlying pathophysiological mechanism of developing AD + P in aMCI.
Our findings agree with the results of previous cross-sectional neuroimaging studies demonstrating a robust association between frontal alteration and AD + P. Several positron emission tomography studies of AD + P have consistently shown hypometabolism in the frontal cortex, particularly in the prefrontal cortex [12, 26], orbitofrontal cortex [12, 27], medial frontal cortex [26], and ACC [12, 27]. Single-photon emission computed tomography studies also reported that patients with AD + P had significant hypoperfusion in the prefrontal cortex [10, 11] and ACC [10, 11]. Similar to the results of functional neuroimaging studies, structural neuroimaging studies have also revealed a reduced gray matter volume in the frontal cortex [9], orbitofrontal cortex [28], medial frontal cortex [9], and ACC [9, 29] in patients with AD + P. However, these previous neuroimaging studies could not relate frontal atrophies to incident psychosis, as they were all cross-sectional in nature. Our longitudinal study has shown that reduced thickness of the ACC precedes and predicts AD + P conversion in patients with aMCI, independent of HC volume.
The ACC is the frontal part of the cingulate cortex and is involved in error detection and monitoring. Functional and structural alterations in this area are frequently implicated in the pathophysiology of psychotic disorders [5, 15]. Consistent with these results, we found that reduced thickness of the ACC, not HC, is an independent predictor of AD + P conversion from aMCI. However, this is not to say that AD + P does not have pathologic changes or cortical atrophy in HC. Indeed, they share these changes with the AD-P [5]. A similar pattern was observed in our study. We found that AD + P had HC atrophy similar to AD-P. One potential explanation for these findings is that HC atrophy does not directly cause psychosis but may increase susceptibility to developing psychosis [5]. This idea is consistent with the hypothesis that the role of frontal and temporal dysfunction in the development of psychotic symptoms is mediated by a collaborative network [30]. Damage to HC leads to unusual perceptual and emotional experiences and/or abnormal reactions to such experiences. However, if frontal regions, including the ACC, that facilitate the monitoring of reality function well, a person may cope with these experiences without expressing overt psychotic symptoms. However, if alterations of frontal regions lead to an impaired function of multimodal executive neural structures, the person may no longer be able to cope with the abnormal perceptual and emotional experiences and may develop overt psychotic symptoms.
In addition to psychosis, the ACC is involved in the development of other neuropsychiatric symptoms such as apathy [31], depression [32], and anxiety [33]. The ACC may play an important role in the pathogenesis of various neuropsychiatric symptoms through symptom-specific brain lesion networks [34]. For example, apathy is related to the ACC-subcortical circuit [31], depression to the ACC-limbic circuit [32], and anxiety in the ACC-amygdala circuit [33]. Further studies of symptom-specific brain lesion networks will help elucidate the pathophysiology of neuropsychiatric symptoms for the development of therapeutics for AD. It will also help to elucidate the pathogenesis of neuropsychiatric symptoms in other types of dementia as well as other psychotic disorders.
The results of this study have several limitations. First, as this was a hospital-based study, the findings of this study may not be generalizable to the general population. Second, we classified delusions and hallucinations into the same psychotic symptom, which may decrease the risk estimate of the association between the baseline cortical thickness and progression to AD + P. Although delusions and hallucinations are often present, they are likely to have a discrete pathophysiology [35, 36]. Delusions are mainly caused by frontotemporal lesions [37], and hallucinations are mainly related to brain lesions in the anterior-posterior neural networks and insula [38]. To improve the phenotypic or biomarker classification of psychosis, new criteria are being proposed by the Alzheimer’s Association International Society to Advance Alzheimer’s Research and Treatment (ISTAART) [39]. Third, the diagnosis of AD was not confirmed using pathological biomarkers such as amyloid PET. Therefore, it is possible that the participants in this study had overlapping pathologies. Finally, some potential confounders (e.g., apolipoprotein E genotype, amyloid deposition, hyperphosphorylated tau, vascular risk factor, psychoactive medication, etc.) that were not controlled in this study may have caused bias in the results.
In conclusion, we found that reduced cortical thickness of the ACC, not HC volume, is a predictor of aMCI conversion to AD + P. In addition, our findings that the effect of ACC thickness on the risk of incident AD + P is independent of HC volume, suggesting that ACC can play a very important role in the underlying pathogenesis of AD + P. Thus, careful assessment of ACC thickness in aMCI can improve early detection and intervention of AD + P, ultimately reducing the risk of dementia progression and improving the quality of life of patients and caregivers.
Footnotes
ACKNOWLEDGMENTS
This study was supported by grants from the National Research Foundation (NRF) funded by the Korean government (NRF-2018R1C1B5045898), the Ministry of Trade, Industry and Energy (MOTIE), and the Korea Institute for Advancement of Technology (KIAT) through the International Cooperative R&D program (Project No. P0006849) and the Korea Health Technology R&D Project through the Korea Health Industry Development Institute (KHIDI), funded by the Ministry of Health & Welfare, Republic of Korea (grant number: HI18C2383).
