
Abstract
Background:
Differential abundance of gut microbiota has found to be associated with Alzheimer’s disease (AD). However, the relative abundance of gut microbiota between dementia and mild cognitive impairment (MCI) in AD is not well studied.
Objective:
We attempted to identify differentially enriched gut microbes and their metabolic pathways in AD patients with dementia comparing to AD patients with MCI.
Methods:
Fecal samples were collected at Shuang Ho Hospital, Taipei Medical University, Taiwan and analyzed by whole metagenomic sequencing technique. For normal controls without AD (NC), 16S rRNA sequencing was obtained from the Taiwan Microbiome Database. A total of 48 AD (38 dementia and 10 MCI defined by cognitive function scores) and 50 NC were included. Microbiome alpha and beta diversities were estimated. Differentially enriched microbes were identified with HAllA, MaAsLin, DESeq2, and LEfSe statistical modeling approaches.
Results:
We found significantly increased abundance of Firmicutes but decreased abundance of Bacteroidetes at phylum level in AD compared to NC. In AD patients, cognitive function scores were negatively associated with abundance of Blautia hydrogenotrophica (Firmicutes), Anaerotruncus colihominis (Firmicutes), and Gordonibacter pamelaeae (Actinobacteria). In addition, microbial abundance in the sucrose and S-Adenosyl-L-methionine (SAMe) metabolic pathways was more enriched in AD with MCI than AD with dementia and significantly associated with higher cognitive function scores.
Conclusion:
Gut microbe community diversity was similar in AD patients regardless of MCI or dementia status. However, differential analyses probed in lower-level taxa and metabolic pathways suggested that specific gut microbes in Firmicutes and Actinobacteria might involve in cognitive decline.
Keywords
INTRODUCTION
The hypothesis, “Gut-Brain Axis” has been proposed that gut microbiome plays a pivotal role in the modulation of gut and brain function [1]. The CNS regulates the permeability, secretion, motility, and immunity of the digestive tract through the efferent autonomic nervous pathways [2]. In turn, the intestinal microbiome is able to influence brain functions through afferent signaling pathways and the secretion of biologically active substances [3]. There is a number of published data showing the effects of intestinal dysbiosis on cognitive functions of the brain, caused by changes in diet, the use of antibiotics, non-steroidal anti-inflammatory drugs as well as the presence of pathogenic microorganisms [4] such as HSV, spirochetal bacteria or Chlamydophila pneumoniae (Cpn) [5], Porphyromonas gingivalis [6], and Tuberculosis related pathogens [7].
The findings for the role of microbiome in the onset and progression of Alzheimer’s disease (AD) compared to healthy controls have been emerging in recent years as well [5–10]. Since AD pathology begins up to two decades before the onset of clinical symptoms [11], utilizing the microbiome for novel non-invasive diagnostics and therapeutic biomarkers is a highly interesting area. Enterococcus f aecium and Lactobacillus r hamnosus reduced TNF-α production in vitro and supplementation of these probiotic strains induced antioxidant enzymes in the brain and consequently reduced oxidative stress markers in animals [12]. Similarly, the contribution of gut microbiome in human health and diseases is assumed via the enzymatic metabolism of multiple nutrients containing polysaccharides, polyphenols, and synthesis of vitamins [13]. Another recent study proved that a marine-derived oligosaccharide decreased amyloid-β related pathologies by reconditioning the gut microbiome in the mice model [14]. In addition, supplementation with Lactobacilli and Bifidobacteria-genus based probiotics significantly improved Mini-Mental State Examination scores (MMSE) in AD patients [15].
Mild cognitive impairment (MCI) occurs in up to 20% of people older than 65 years of age [16] and is a high-risk group to progress to dementia [17]. Several epidemiological studies suggest the progression of MCI to dementia may be preventable [18], but few studies examined the utility of microbiome to distinguish MCI from dementia. A study with 97 Chinese subjects reported fecal microbiome could discriminate AD from aMCI (amnestic) and normal controls (NC) using 16S rRNA sequencing [6]. However, another recent study with 90 Chinese subjects concluded the opposite that MCI and AD had similar microbiome alteration examining down to genera level taxa using 16S rRNA sequencing [19]. Most studies conducted by the 16s rRNA sequencing technique cannot effectively identify the information of downstream sub-categorical taxa and the genetic information is less precise at the species level [20]. In addition, specific genes are not directly sequenced, but rather predicted based on the Operational Taxonomic Unit (OTUs), which limits a total understanding of a microbiome. Thus, it is imperative to analyze both the rare and the abundant microbiome with high genome sequencing coverage [21]. Next generation sequencing (NGS) of fecal samples produced tens of millions of reads per sample. At this depth of sequencing, the genomes of minor constituents such as Escherichia coli (with an abundance of about 1% or lower) are sampled almost completely, and organisms with an even lower abundance have some of their genome represented [22, 23]. De novo prediction of genes from metagenomic data is also possible [22], which provides motifs for functional inference even if the sequence does not find a match in a database. Finally, these methods convert metagenomic sequence data into catalogues of genes that can be further analyzed and sorted into metabolic pathways and processes. The functional properties of microbial communities are thought to be more important than their taxonomic composition [24]. Therefore, we performed whole metagenome shotgun sequencing (WMGS) analysis to enhance detection of bacterial species, increase genome sequence coverage, and analyze rare and abundant microbiome encompassing species as well as strains and employed multiple bioinformatics modeling approaches. The aims are as follows: 1) detect distinct microbiome features between MCI and dementia in AD down to species and strain level taxa, 2) evaluate microbiome metabolic pathways to provide some knowledge describing the interplay between the microbiome and fecal metabolic environments, and 3) conduct comparative analyses on microbiome features between AD and NC.
METHODS AND MATERIALS
Study setting and samples
We recruited all AD patients at Dementia Center and Department of Neurology, Shuang Ho Hospital (SHH), School of Medicine, College of Medicine, Taipei Medical University, New Taipei City, Taiwan. AD patients were diagnosed using the NINDS/ADRDA criteria [25] and confirmed by neurologists in SHH. Fecal samples obtained from AD patients were processed by WMGS. For cognitively healthy NC samples, only 16S rRNA sequencing data were available from the Taiwan Microbiome Database (Twnbiome: http://twnbiome.cgm.ntu.edu.tw/), which was accessed via Development Center of Biotechnology (DCB) in Taiwan.
Exclusion criteria for this study were subjects with any significant infectious disease that requires intensive antibiotic treatments in 6 months before providing the fecal sample; history of alcohol/substance dependence; any disease which requires immunosuppressant therapy; any active cancers; active uncontrolled gastrointestinal disorders including inflammatory bowel disease, indeterminate colitis, irritable bowel syndrome, persistent and infectious gastroenteritis, colitis or gastritis, persistent or chronic diarrhea of unknown etiology, and recurrent Clostridium difficile infection.
This study was approved by SHH Institutional Review Board (IRB No. N202003039) and HebrewSenior Life (IRB No. 2019-50) in Boston, MA, USA. All participants provided informed consent either directly by the patients or indirectly from the authorized caregivers of the patients patients who were not able to give consent. We acquired the delinked data through a form that individual identities were deleted and only received the items appropriate to this research purpose. All procedures performed in this study were conducted in accordance with the ethical standards of the institutional and/or national research committee and with the 1964 Helsinki declaration (The Code of Ethics of the World Medical Association) and its later amendments or comparable ethical standards.
Fecal sample collection and DNA extraction
Each fecal sample of AD patients was collected at home except one patient who was in the hospital inpatient ward. Approximately 1 g of the stool samples were collected in LIBO Feces collection container (http://www.iwbt.com.tw/productdetail.php?id=160). The fecal sample was packaged within insulated containers with frozen gel packs keeping it cool condition (4°C) [26]. Upon delivery, chilled samples were stored in a –80°C refrigerator immediately after transferring to 2 cc Eppendorf tubes. The stool samples were kept frozen before DNA extraction. Samples were subsampled (∼100 mg) into prepared sterile bead beating tubes (PowerBead Pro Tube) and went through several steps to extract DNA (QIAamp PowerFecal Pro DNA Kit (Qiagen Inc., USA, Cat. No.: 51804) [27]. All lysis, separation of impurities and purification procedures followed the manufacturer protocol of QIAamp PowerFecal DNA Kit. The DNA samples were evaluated for quality via NanoDrop Microvolume Spectrophotometers. The qualified DNA was used for library preparation by using the Nextera XT library preparation kit (Illumina, Cat. No.: FC-131-1096) according to the manufacturer’s instructions. The metagenome shotgun sequencing was performed on the Illumina NovaSeq 6000 platform, targeting > 8 Gb sequence per sample with 150 bp pair-end mode.
Whole metagenome shotgun sequencing (WMGS)
Next generation sequencing (NGS) library construction
The fecal metagenomic DNA libraries were prepared by TruSeq DNA PCR-Free Library Prep (96 samples, catalog # 20015963) for Illumina NovaSeq 6000 sequencers. Approximately 5μg metagenomic DNA was mechanically sheared to 300–600 bp fragments using Covaris S220 instrument (Covaris, Inc) with the following parameters: temperature 7–9°C, peak incident power 140 W, duty factor 10%, cycles per burst 200, time 80 s, sample volume 130μL, and shearing tubes Crimp-cap microTubes with AFA fiber. The fragmented DNA was then analyzed with an Agilent DNA 12000 Kit on the 2100 Bioanalyzer Instrument (Agilent Technologies, part # G2940CA). The sheared DNA was processed with a QIAquick PCR purification kit (Qiagen) and was eluted in nuclease-free water. One microgram fragmented metagenomic DNA was end-repaired and 3′-adenylated, ligated with Illumina adapters, and PCR enriched with Illumina sequencing indexes (barcodes) using the NEBNext Ultra DNA library prep kit (NEB #E7645, E7103) for Illumina [27].
Metagenome shotgun sequencing and quality control
The DNA libraries were sequenced using the Illumina NovaSeq 6000 sequencers. The DNA libraries were diluted and pooled with an equimolar concentration of each library. The pooled libraries were sequenced following the manufacturer’s protocol by multiplexing on a NovaSeq 6000 sequencer using the TruSeq SBS v3 reagent (FC-401-3001) for pair-end 150 bp sequencing with average raw reads 9 Gb (trimmed reads, 4 Gb) of sequencing reads per sample. All of the raw metagenome shotgun sequencing files were under quality control with multiQC [28] to filter out the adapters and the reads with low-quality scores. FastQ Screen [29] was used to filter the reads that mapped on the host genomes and focused on the relevant reads that belonged to bacterial genomes.
16S rRNA sequencing
Library preparation for 16S rRNA sequencing
The 16S rRNA sequencing libraries were constructed according to the manufacturer’s instruction provided by Illumina (Illumina, USA). Briefly, 12.5 ng of DNA is used for PCR amplification of the V3 and V4 regions of the 16S rRNA gene. The PCR products are purified with AMPure XP beads (Beckman Coulter, USA) and subjected to a secondary PCR reaction with primers from Nextera XT Index kit (Illumina, USA) by adding dual indices and Illumina sequencing adapters. After PCR reaction, the final libraries (∼630 bp) were purified with AMPure XP beads and ready for next-generation sequencing.
Hiseq-based high throughput sequencing
The concentrations of 16S rRNA sequencing libraries were determined by real-time quantitative PCR with Illumina adapter-specific primers provided by the KAPA library quantification kit (KAPA Biosystems, USA, Cat No: KK4835). Libraries were denatured and sequenced by Illumina Hiseq platform with reagent v3 for pair-end sequencing (2*300 bp). Instrument control, cluster generation, image capture and base calling were processed by Real-Time Analysis software (RTA), HiSeq Control software (MCS) and Hiseq Report software on Hiseq platform. FASTQ files generated by Hiseq Report were used for further analysis. Taxonomic analysis of stool microbiome by the V3 and V4 regions of 16S rRNA sequence was performed by 16S Metagenomics v1.0 on Hiseq platform and the classification is based on the Greengenes database (http://greengenes.lbl.gov/).
Covariate information
Clinical information of AD patients was retrieved from SHH health records. The information included age, sex, BMI, comorbidities (hypertension, dyslipidemia, and diabetes), lab data, the age of AD onset (late-onset, > 65-year; early-onset, ≤65-year), MMSE and Clinical Dementia Rating (CDR) scores and education attainment years [30], and duration of disease. AD patients were grouped into subgroups of dementia and MCI by cognitive function status by MMSE and CDR scores based on Alzheimer’s Association criteria [34] and KnightADRC [35]. Dementia was defined as MMSE≤24 and CDR≥0.5, and MCI was MMSE > 24 and CDR≤0.5. The cognitive function assessments were first conducted by qualified psychologists using the Chinese version of Cognitive Abilities Screening Instrument (CASI C-2.0) [31]. Then scores of CASI were converted to the MMSE scores according to the prior studies [32]. The information for NC is only available for age, sex, and BMI from Taiwan Microbiome Database. Food Frequency Questionnaire (FFQ) for recent diet information was collected at the time of fecal sample collection from AD patients or designated caregivers. The survey questionnaire included 31 checklists asking recent and regular dietary habits about food types (fish, meat, vegetables, dairy product, etc.), food intake frequency, prebiotic, and probiotic use (Supplementary Table 1).
Statistical analyses
Baseline characteristics of subjects
Baseline characteristics of subjects were expressed as mean±standard deviation (SD), and frequency or proportion (percentage) and compared using the unpaired Student t-test, and Fisher’s exact test, respectively. Thirty-one items of FFQ obtained from 48 AD patients were ranked by frequency and assigned to 4-level scoring: high, moderate, low, and never. Then the ranks were translated into the numbers 4, 3, 2, and 1, respectively. Their differences between dementia and MCI were tested by Mann-Whitney U (Wilcoxon rank-sum) test (Supplementary Table 2).
Microbiome taxonomic and functional profiles
We used all of the biobakery pipelines [33] in the Whole Metagenome Shotgun (wmgx) workflow (https://github.com/biobakery/biobakery_workflows#whole-metagenome-shotgun-wmgx) to process the paired-end raw metagenome shotgun sequencing FASTQ files. In brief, the reads mappings were first filtered out using KneadData v0.70. Taxonomic profiles of shotgun metagenomes were generated using MetaPhIAn2 v2.7.8, which uses a library of clade-specific markers to provide bacterial, archaeal, eukaryotic, and viral profiling. Functional profiling was performed by HUMAnN2. HUMAnN2 constructs a sample-specific reference database based on the pan-genome of a subset of the species detected by MetaPhlAn2 in the sample. The results are abundance profiles of gene families (UniRef90s), which are stratified by each species contributing those genes by StrainPhIAn and then can be summarized into higher-level gene groupings.
We used 16S rRNA UPARSE workflow (https://github.com/biobakery/biobakery_workflows#16s-rrna-16s) to process the paired-end raw 16S rRNA sequencing FASTQ files, which had 4 steps of the processing; demultiplex, merging samples and renaming, quality control, and taxonomic profiling.
Normalization process
Normalization plays a crucial role in differential abundance analysis because variation in sequencing depth can make read counts incomparable across samples. We used the total sum scaling [34] method that aims to address the heteroscedasticity of the samples by variance stabilization and robustification or filtering [35] after removing archaeal and viral taxonomies in the samples.
Microbiome community diversity
We measured richness (Chao1) [36], α-diversity (Shannon Index) [37], and β-diversity metrics to define the microbial community composition and diversities. To detect differences in richness and alpha diversity between groups, we used an independent two-sample t-test or ANOVA test. β-diversity was computed using Bray-Curtis dissimilarity and summarized using weighted and un-weighted principal coordinates analysis [38]. Statistical differences in beta diversity metrics between groups were tested by permutation multivariate analysis of variance (PERMANOVA). All analyses were performed in Microbiomeanalyst [39] platform.
Differentially abundant microbiome features
As many standard approaches can be prone to false positive or negative rates [20], we thus incorporated multiple computational and statistical methods; 1) Univariate association analysis: t-test/ANOVA (parametric) was conducted. 2) RNASeq (DESeq2): a statistical method developed to detect differential expression in RNA-seq count data while accounting for library size differences and biological variability [40]. 3) LEfSe (Linear discriminant analysis effect size): a test that determines the features most explain the differences between groups by coupling standard statistical test with additional tests encoding biological consistency and effect relevance [41]. 4) MaAsLin (Multivariate Association with Linear Models): a multivariate statistical framework that finds associations between clinical metadata and high-dimensional experimental data. Backward stepwise multivariable generalized linear regression analyses were performed adjusting for age and sex along with microbiome profiles. The beta coefficients were presented with 95% confidence intervals [42]. 5) To identify specific clusters of features, we implemented Hierarchical All-against-All significance Testing (HAllA). HAllA performs hierarchical clustering and applies dimensionality reduction of microbial features and iteratively tests associations between blocks of related features [43]. We used HAllA to identify pairs of features such as microbiome taxonomy profiles, patient metadata, metabolic pathways and FFQ by their association and produced statistically significant information. We selected significantly different microbiome features between groups primarily from MaAsLin modeling after adjusting for age and sex and confirmed the MaAsLin results in other multiple statistical models. All the comparisons were two-tailed and the False Discovery Rate (FDR) method was used for multiple testing corrections with adjusted p-values (q values) in all approaches. All analyses used q value < 0.05 as statistical significance except MaAsLin (q < 0.25) and HAllA (q < 0.1). All analyses were performed using biobakery pipeline [33], Galaxy platform [44], and R (version 4.0.0).
Metabolic pathway analyses
We used HUMAnN2 to generate microbiome pathway abundance data. HUMAnN2 implements a ‘tiered search’ strategy to quickly and accurately profile the functional content of a metagenome at species-level resolution, the results of which can also be used for strain profiling. HUMAnN2 identifies a community’s known species, aligns reads to their pangenomes, performs translated search on unclassified reads, and finally quantifies gene families and pathways. HUMAnN2 maps microbiome sequence reads to corresponding genes and metabolic potential of a microbial community using UniRef90 annotations (https://www.uniprot.org/help/uniref) and MetaCyc database [45]. HUMAnN2 generates pathway abundances of each microbiome community in RPK (Reads Per Kilobase) units. RPKs can be normalized to copies per million or relative abundances by summing either 1) UNMAPPED reads, UNINTEGRATED organism-specific features, and organism-specific pathways, or 2) UNMAPPED reads, total UNINTEGRATED features, and pathways that are not broken down per organism and annotated to any pathway in the corresponding database MetaCyc [41].
RESULTS
Baseline characteristics of included subjects
A total of 98 samples (48 AD and 50 NC) were included for final analysis. Initially, fifty fecal samples of AD were collected. However, two AD samples were removed at the screening step. One sample dominantly showed Klebsiella Pneumonia and the other sample showed a very low number of microbiome features caused by antibiotic use at the fecal sampling.
NC subjects (61.9±9.13 years old) were significantly younger than AD patients (76.1±9.2 years old) but sex and BMI were comparable between the two groups. Among 48 AD patients, 38 patients with 15 mild (MMSE: 20–24), 10 moderate (MMSE 13–19), and 13 severe (MMSE≤12) patients (all with CDR ≥0.5) were grouped to dementia. Whereas 10 AD patients with MMSE score > 24 and CDR ≤0.5 were grouped to MCI (Supplementary Figure 1). As shown in Table 1, distributions of age, sex, BMI, and onset age were not significantly different between dementia and MCI. Education year is a known protective factor of cognitive function, but the mean education year was not statistically different (dementia; 7.37 (3.88) versus MCI; 9.60 (3.77), p = 0.13) as well. Whereas, dementia patients had a longer duration of disease than MCI patients, 4.19 (2.71) years versus 1.90 (1.37) years (p = 0.02), respectively. Among the comorbid conditions, dyslipidemia was higher in MCI subjects, but other comorbidities and blood chemistry were comparable between the two groups. None of the FFQ scores were significantly different between the two groups (Supplementary Table 3).
Baseline characteristics of normal controls (NC) and AD patients with either dementia or mild cognitive impairment (MCI)
FBG, fasting blood glucose; GFR, glomerular filtration rate; NS, not significant. *3 data were missing and assigned as normal or high according to their diabetes or dyslipidemia profile. *Fisher’s exact test for categorical data and t-test for continuous data were used.
Microbiome abundance, richness, diversity, and metabolic pathways
We compared 48 WMGS data for AD and 50 16S rRNA sequence data for NC. NC 16S rRNA data decreased the accuracy to distinguish genus and species level taxa compared to WMGS data, so the analyses including NC were conducted only in phylum, class, order, and family level. However, in comparison of dementia to MCI in AD patients, analyses were performed in all levels of taxonomy resolution down to species and strain.
Comparisons in AD and NC in phylum, class, order, and family level taxa
Differential abundances
Firmicutes in the phylum, Clostridia in the class, and Clostridiales in the order were the highest abundant microbiome commonly found in AD and NC groups. In the family level taxon, Lachnospiraceae was the highest in AD patients, whereas Bacteroidaceae was the highest in NC (Table 2). Acidobacteria was only found in NC but Actinobacteria was only found in AD patients. When we calculated the relative abundance comparing each phylum between AD and NC, Bacteroidetes was more abundant in NC (NC; 59.8% versus AD with MCI; 22.2% versus AD with dementia; 18.0%) but Firmicutes was more abundant in AD (NC; 25.6% versus AD with MCI; 39.2% versus AD with dementia; 35.2%) (Supplementary Figure 2). The total microbiome features in each taxon were compared in Supplementary Table 4.
Top 3 abundant microbiome among the groups (abundance in %)**
*Microbiome abundance < 0.01% were uncounted. **Taxonomy abundances in each group were averaged based on their sample numbers.
Richness and diversity
Chao1 for richness was not significantly different between AD and NC. Alpha-diversity by Shannon index showed significant results in class and order, which were decreased in NC (p < 0.001). Beta-diversities in AD versus NC were significantly different in all taxa levels. In three- group comparisons (dementia, MCI, NC), Shannon indices were significantly different in class and order taxa. Beta-diversities in three-group comparisons were significantly different across all taxa (Supplementary Table 5). Beta diversities in phylum in two-group (AD versus NC, p < 0.001) and three-group comparison (MCI versus dementia versus NC, p < 0.001) are presented in Fig. 1.

Beta diversity in two-group and three-group comparisons.
Significant microbiome features
The significantly different microbiome features between AD and NC were selected based on the common findings in MaAsLin (adjusted for age and sex), univariate analysis, RNASeq (DESeq), and HAllA clustering. In phylum, subjects with a higher abundance of Actinobacteria and Firmicutes were 1.16 and 1.12 times more likely to have AD; whereas subjects with a higher abundance of Acidobacteria and Bacteriodetes were 7% and 27% less likely to have AD, respectively. In the lower-level taxa, the microbiomes belong to phylum Bacteroidetes (c_Bacteroidia, o_Bacteroidales) decreased the risk of AD. On the other hand, the microbiomes belong to phylum Firmicutes (c_Negativicutes, o_Selenomonadales, f_Eubacteriaceae) increased the risk of AD (Figs. 2 and 3, Supplementary Table 6).
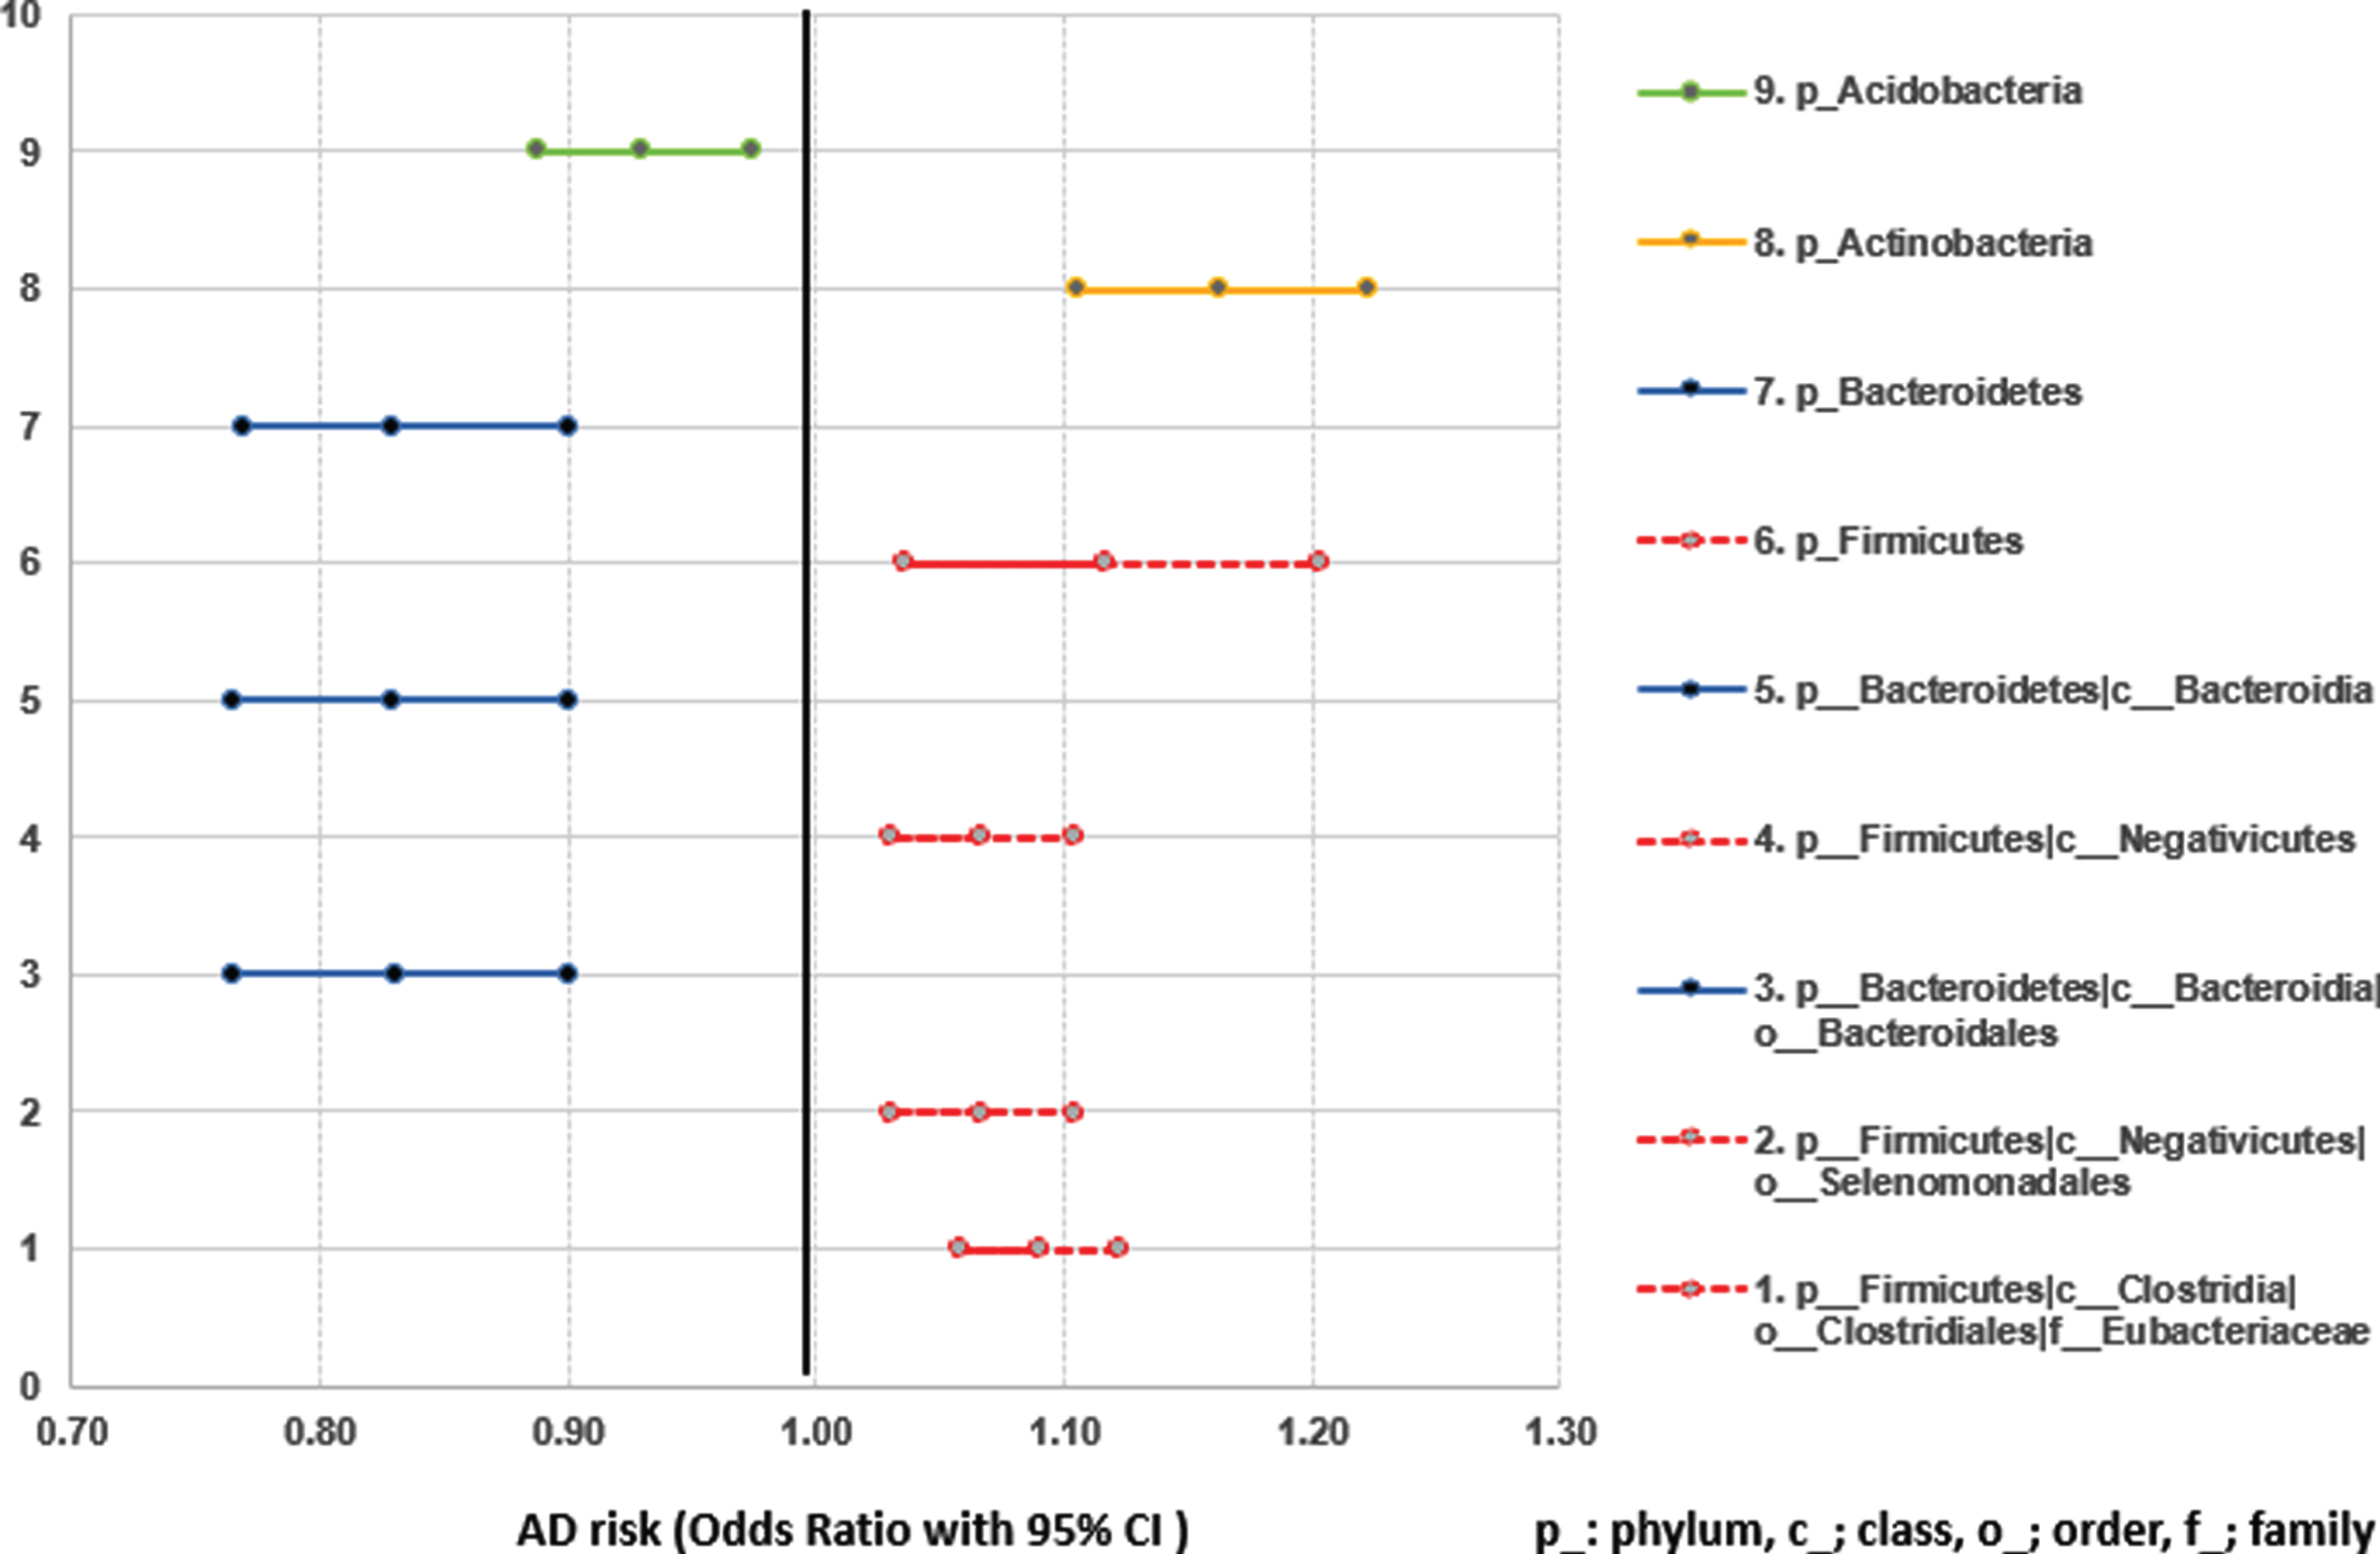
Microbiome features significantly associated with AD risk confirmed by multiple models (MaAsLin, HAllA, DESeq2, and univariate analysis).
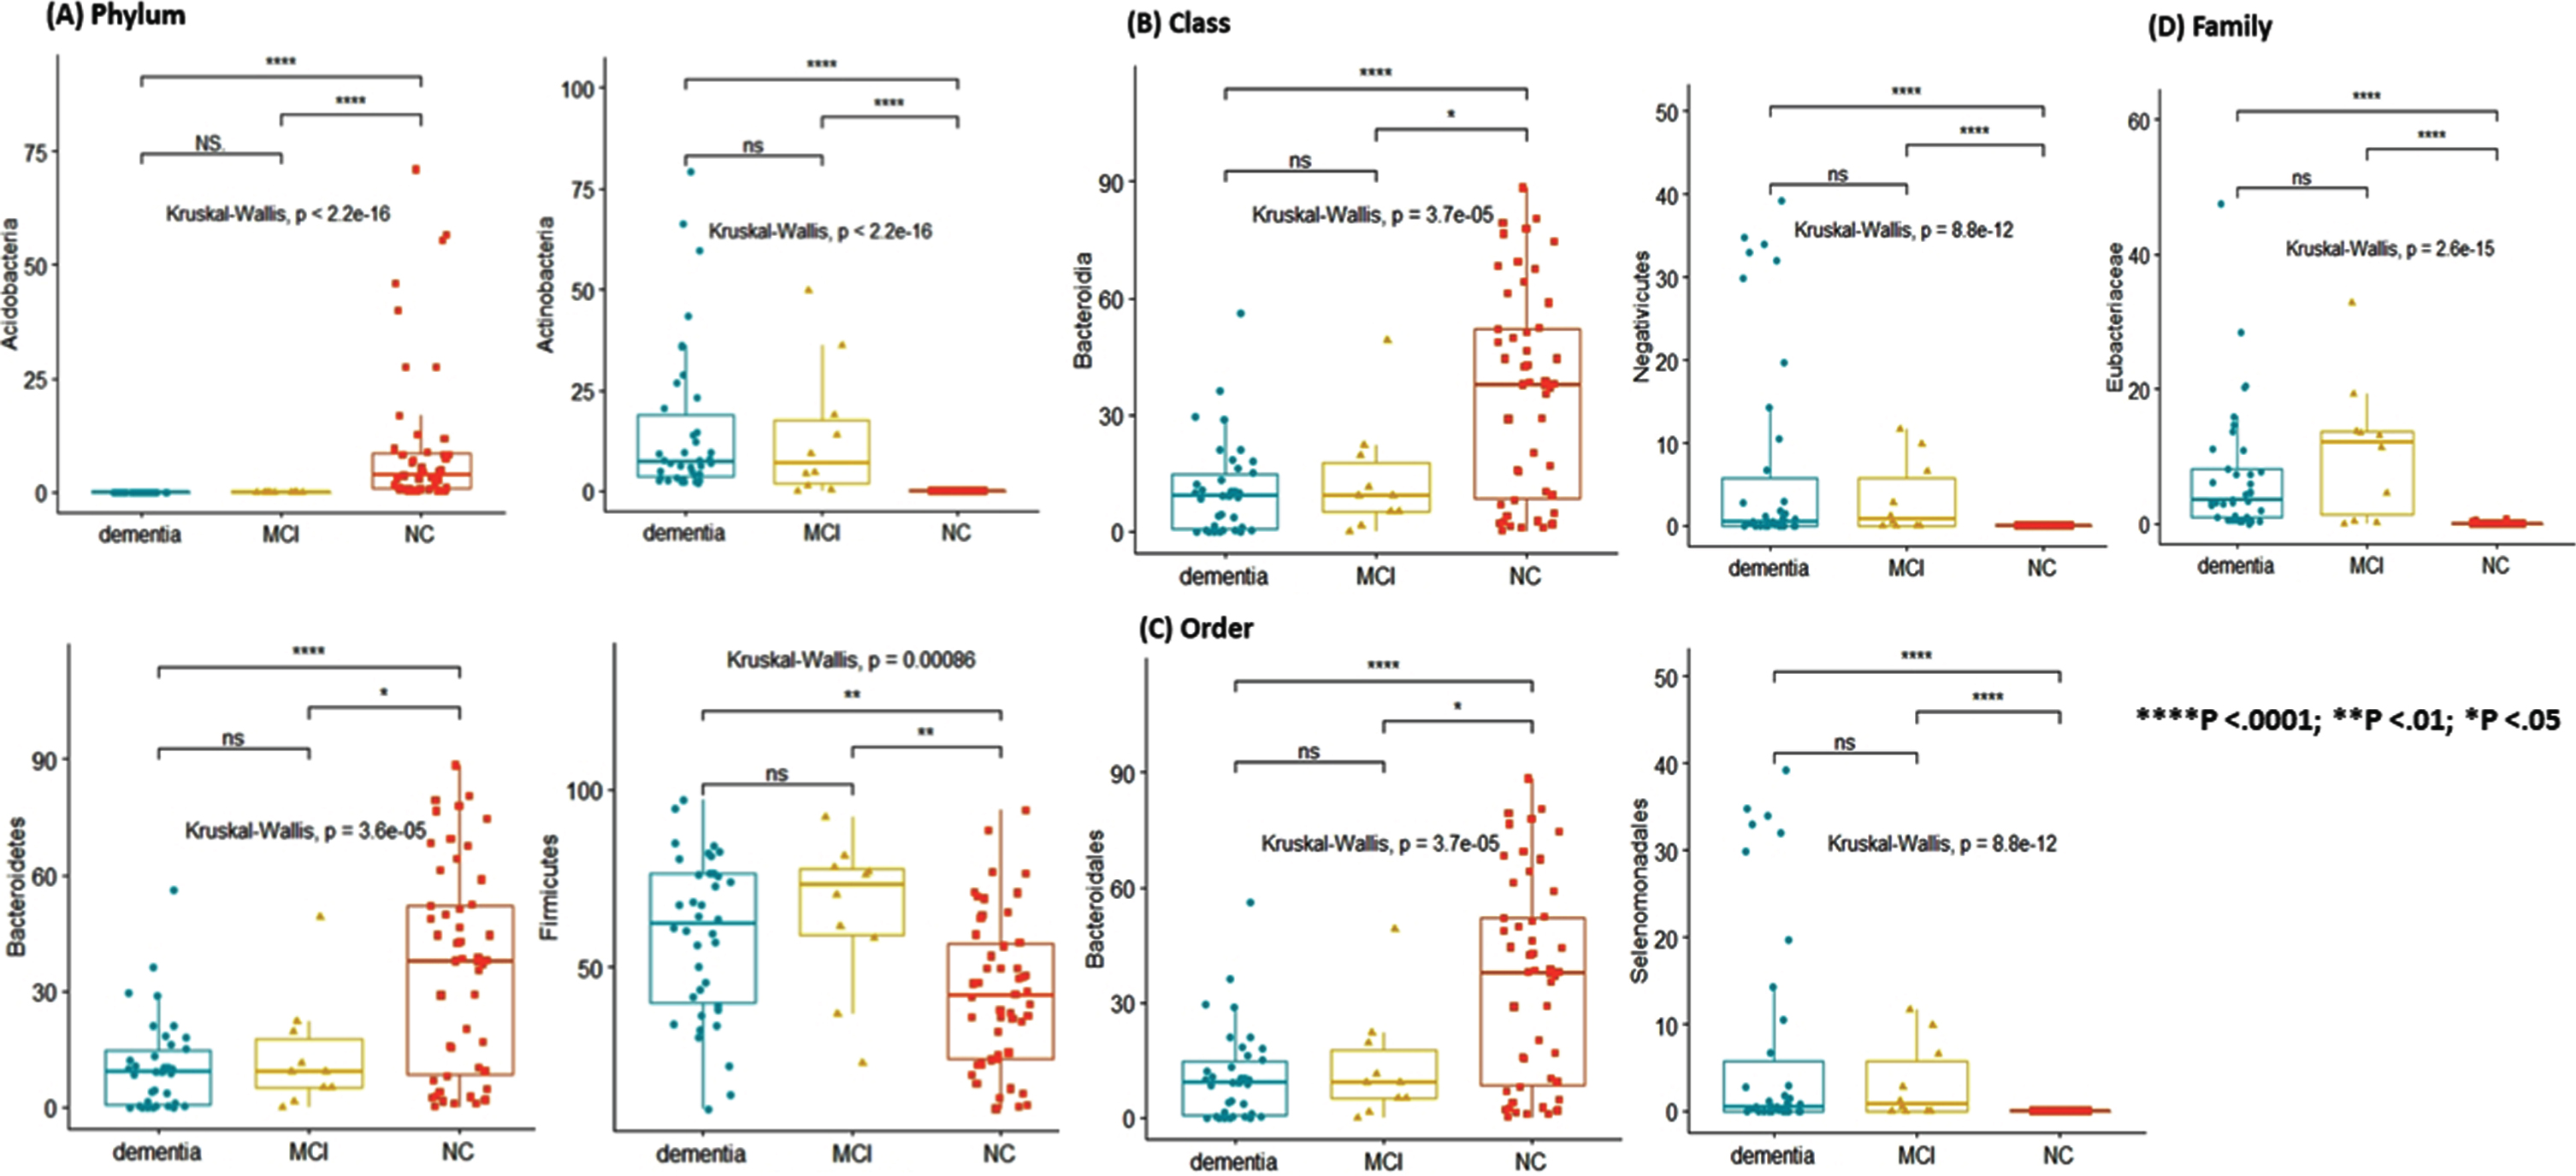
Different abundances in each taxon among the three groups: (A) Phylum, (B) Class, (C) Order, (D) Family.
Comparison between dementia and MCI in AD patients in whole taxa levels
Until the family level taxa, the highest abundant microbiome was the same in dementia and MCI. However, it was different from the genus level. Blautia (13.31%) in MCI and Bifidobacterium (10.98%) in dementia were the highest abundant features. In species and strain taxa, Faecalibacterium prausnitzii (8.98%) and its strain were the highest in MCI. Contrarily, E. coli (10.39%) and its strain were the highest in dementia (Table 2, Supplementary Table 7).
Richness and diversity
Although Chao1 and Shannon indices were higher in MCI than dementia in family, genus, and species, they were not significant. For all other comparisons between the two groups, Chao1, Shannon index, and beta diversities were not significantly different. Beta diversity between MCI and dementia in the phylum shows almost complete overlap (p < 0.811) (Fig. 1B, Supplementary Table 8).
Significant microbiome features
No microbiome features were significantly different between the two groups in all taxa levels. However, in HAllA and MaAsLin (adjusted for age and sex) analyses, cognitive function test scores (MMSE and CDR) presented significant associations with a few microbiome features in genus, species, and strain taxa. HAllA clustering presented species Coprobacillus unclassified (q = 2.48e-2) were associated with CDR score. They were higher in dementia than in MCI but the differences were not significant (Supplementary Figure 3). MaAsLin analyses yielded genus Gordonibacter and Anaerotruncus were significantly associated with decreased cognitive function in both MMSE and CDR scores. Strains GCF_000157975 (B. hydrogenotrophica), GCF_000154565 (A. colihominis), and GCF_000210055 (G. pamelaeae) were significantly associated with decreased MMSE and increased CDR scores (Table 3, Supplementary Figures 4 and 5, Supplementary Table 9).
Microbiome features associated with both cognitive function scores (MMSE and CDR) in AD patients assessed by MaAsLin adjusting for age and sex
*multi-testing correction by Benjamini Hochberg; significance cut-off value FDR < 0.25. Significant results with q value < 0.05 made in bold type.
Metabolic pathways analysis
HAllA analysis demonstrated a few significant associations between microbiome metabolic pathways and patient metadata. PWY-6151:S-adenosyl-L-methionine cycle I (SAMe) by Eubacterium hallii was associated with a binary variable (dementia versus MCI grouping) and its abundance was high in MCI. MMSE scores were associated with PWY-5384: sucrose degradation IV and GLYCOGENSYNTH-PWY: glycogen biosynthesis I by Roseburia intestinalis and PWY-621: sucrose degradation III (sucrose invertase) by F. prausnitzii and their abundance was high in MCI. CDR score was associated with PWY-6277: superpathway of 5-aminoimidazole ribonucleotide biosynthesis by B. hydrogenotrophica. The abundance of B. hydrogenotrophica was high in the dementia group (Table 4, Fig. 4, Supplementary Figure 6).
Microbiome metabolic pathways associated with cognitive function by HAllA clustering
*Metadata: continuous variables (Age, CDR, MMSE, disease duration, BMI, Years of education, total cholesterol, fasting blood glucose, glomerular filtration rate, hemoglobin), binary variables (sex, onset of AD (early/late), cognitive function (dementia/MCI), diabetes, dyslipidemia, hypertension). **microbiome metabolic pathways generated by HUMANN2. §multi-testing correction by Benjamini Hochberg; significance cut-off value FDR < 0.1. ¶Did not achieve statistical significance between MCI and dementia.
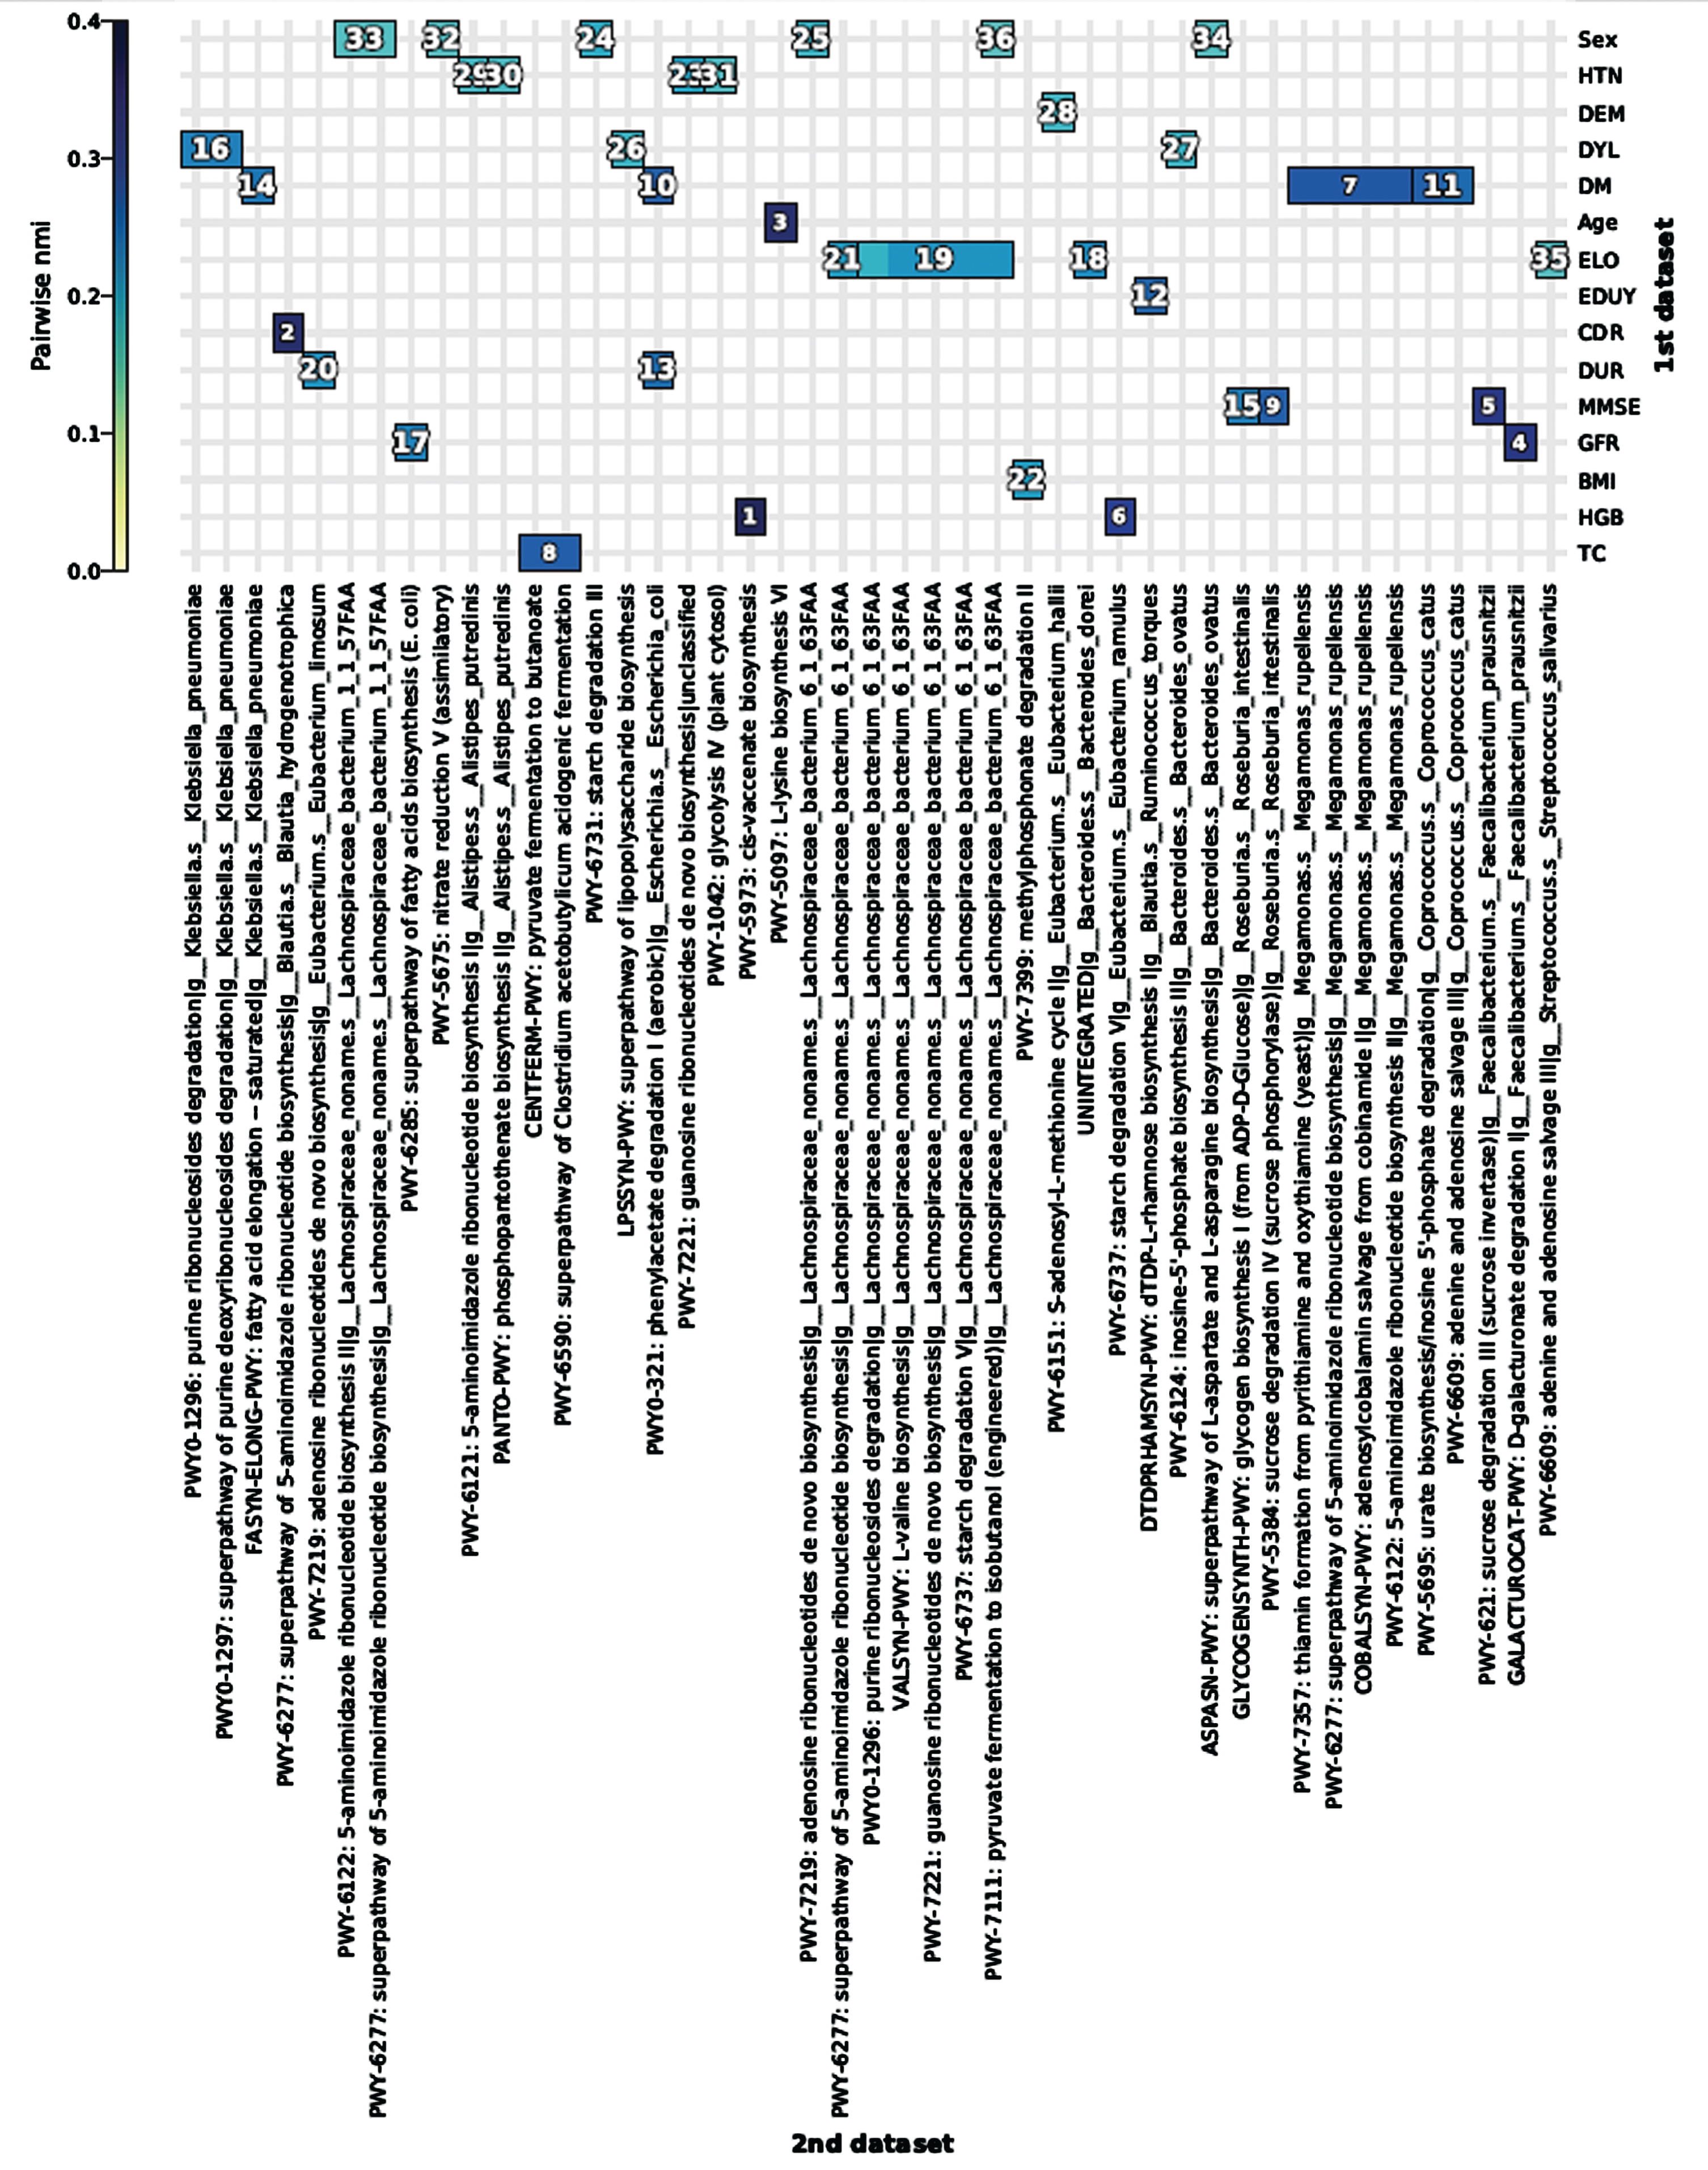
HAllA association plot (hallagram) between microbiome metabolic pathways and patient metadata (1st dataset: metadata, 2nd dataset: microbiome metabolic pathways. The numbers shown in the hallagram are similarity score rank). HTN, hypertension; DEM, dementia versus mild cognitive impairment grouping; DYL, dyslipidemia; DM, diabetes; ELO, onset of age (early or late onset); EDUY, years of education; CDR, Clinical Dementia Rating; MMSE, Mini-Mental State Examination; GFR, glomerular filtration rate; HGB, hemoglobin; TC, total cholesterol.
DISCUSSION
We identified differential distributed gut microbes between AD (MCI and dementia) and NC in East Asian populations (Taiwanese). In addition, our findings also confirmed confirmed previously published results in Caucasian subjects. Higher abundance of the Bacteroidetes microbes have found to be associated with a decreased AD risk, whereas higher abundance of the Firmicutes was associated with an increased AD risk (Fig. 2), which are in line with the results of a recent study by Li et al. in Chinese subjects with AD. In their report, genera Parabacteroides, and Paraprevotella (belong to Bacteroidetes) showed decreased risk but Blautia (belongs to Firmicutes) showed an increased risk of AD [19]. Another Chinese study also showed phyla Bacteroidetes was decreased but Actinobacteria and Firmicutes were increased in AD [5]. Whereas the opposite results were presented with a study held in the USA that decreased abundances of Firmicutes and Actinobacteria along with increased abundances of Bacteroidetes and Proteobacteria phyla in AD patients were observed [7]. These differences may be related to a number of factors, especially including ethnicity, lifestyle, and dietary preferences [46], and highlights the importance of microbiome study differentiated by ethnicity and geographical regions.
Our study also presented MCI and dementia in AD have similar microbiome profiles and abundances with no difference in alpha and beta diversities, which was also in parallel with the study by Li et al. [19] where they used 16s rRNA sequencing and examined the difference at the genus level. However, in the lower-level taxa such as genus, species and strain in AD patients using WMGS technique, we found some distinctive microbiome features which influenced on cognitive function scores. In MaAsLin results, genus Gordonibacter and Anaerotruncus were negatively associated with cognitive function levels. In strain level taxa, GCF_000157975 belonging to B. hydrogenotrophica, GCF_000154565 belonging to A. colihominis and GCF_000210055 belonging to G. pamelaeae were negatively associated with cognitive function scores as well. All of their effects conform to the effect-direction of their upper lineage taxa, such as B. hydrogenotrophica and A. colihominis belong to phylum Firmicutes and G. pamelaeae belongs to phylum Actinobacteria, which showed an increased risk of AD. However, their effect sizes (beta coefficient) are quite small, which requires further confirmation. In species, E. coli (10.39%) was the most abundant in dementia but F. prausnitzii (8.79%) was the most in MCI. Also, strain E. coli unclassified (11.11%) was the highest in dementia whereas F. prausnitzii unclassified (10.34%) was the highest in MCI. Li et al. [19] described genus Escherichia was increased in AD compared to NC in their study. In our study, although we could not compare the abundance of genus Escherichia between AD and NC, genus Escherichia was found higher in dementia (10.39%) than in MCI (5.91%) in the AD patients without significance in any statistical approaches.
A higher abundance of Escherichia was reported in amyloid-β positive patients, and these gut microbiome differences were correlated with the systemic inflammatory profile [47]. Especially, genera Escherichia is reported massively increased in tubercular infection [48]. As E. coli produce extracellular amyloids known as curli fibers [9], Mycobacterium tuberculosis produces curli-like outer fringelike bacterial amyloid structures which shows fibers that are quite similar to amyloid curli fibers of E. coli, known to be structurally very similar to the amyloid-β of AD [49]. More list of bacterial amyloid systems includes those associated with Gram-negative species of Streptomyces, Bacillus, Pseudomonas, Staphylococcus, and others, suggesting that functional amyloids are a widespread phenomenon utilized by a wide variety of microbiomes [9, 50]. In addition, microbiome associated with inflammatory pathways such as E. coli [51] and M. tuberculosis might be involved in the activation of inflammatory cells (microglia and astrocytes) and inflammatory proteins (e.g., cytokines and complement) which are the main etiology of AD and dementia [53]. Studies on animals showed that modifications of gut microbiome induced by oral bacteriotherapy reflect changes in genes involved in inflammatory and neural plasticity processes with a positive impact on neural functions [54]. A higher abundance of microbiome features belonging to Escherichia in dementia might explain its role in cognitive function decline. Whereas, F. prausnitzii was known to be related to higher MMSE [19]. F. prausnitzii is one of the most common gut bacteria representing more than 5% of the intestinal microbiome and produces butyrate and other short-chain fatty acids through the fermentation of dietary fiber and boost the immune system [55, 56].
It was reported that microbiome was involved in a dialogue between 71% of fecal, and 15% of blood metabolites [12]. Thus, studying the microbial metabolic potential rather than only focusing on taxonomy will provide a unique resource implicating the interplay between the microbiome and the systemic and fecal metabolic environments. In our metabolic pathway analysis, PWY-5384: sucrose degradation IV (sucrose phosphorylase) and GLYCOGENSYNTH-PWY: glycogen biosynthesis I regulated by R. intestinalis were associated with MMSE score. Since R. intestinalis was higher in MCI, these pathways might be implicated in higher MMSE scores (higher cognitive function). R. intestinalis was associated with anti-inflammatory action and decreased in patients with arthrosclerosis [57]. Additional findings for PWY-621: sucrose degradation III pathway by F. prausnitzii implicates that sugar metabolism by microbiome is associated with cognitive function in AD and F. prausnitzii showed beneficial effects to cognitive function in the previous study [19].
It is well known that glucose metabolism in the brains of individuals with AD is significantly impaired. High glucose concentration in brain tissue promotes the formation of amyloid plaques and tau tangles [58]. The main genetic predisposing factors for AD, APOE allele polymorphisms, are directly linked to glucose metabolism [59]. Therefore, glucose metabolic pathways and related microbiome species demonstrated in our study conform to the currently concentrated area of research in AD pathophysiology.
PWY-6151:S-adenosyl-L-methionine (SAMe) cycle I by Eubacterium hallii is significantly associated with binary variable, MCI, and dementia grouping. Since E. hallii was higher in MCI (not statistically different), SAMe cycle I was associated with higher cognitive function. A decreased SAMe concentration in cerebrospinal fluid (CSF) in the patients with AD was observed. After the adjustment by APOE genotype, the significance turned to null but a lower SAMe level was observed in the patients with APOE ɛ4 [60]. However, CSF SAMe levels in AD or probable AD have inconsistent findings [61, 62]. SAMe affects site-specific methylation of DNA-promoter regions that regulate gene function, and carboxymethylation of proteins that can regulate amyloid- β and tau proteins, neuropathological hallmarks of AD [63]. Studies have shown that with either oral or parenteral treatment, SAMe crosses the blood-brain barrier and increases its levels in CSF [64]. SAMe has been utilized for the treatment of psychiatric and medical conditions in Europe for over 30 years but with inconsistent trial results and limited efficacy, it is available as an over-the-counter dietary supplement [65]. In the US, a substantial number of studies were conducted on depression, osteoarthritis, and liver diseases but yielded inconsistent results on the SAMe supplementation, thus SAMe product is sold as a dietary supplement [66]. Based on these factors, SAMe has proven limited efficacy but still warrants further study potential. Eubacterium species associated with SAMe pathway was explored previously that its abundance was decreased in AD, Crohn’s disease, and kidney stones [57].
These observations implicate that investigation of lower-level taxa microbiome profiles in a large number of MCI and dementia patients providing more power can reveal differentiated microbiome features between two groups, which can be applicable for early risk group detection and prevention strategy against dementia progression.
Novelties and limitations
The novelty of this study is we implemented WMGS analysis and multiple bioinformatics modellings which enabled us to elucidate the association between microbiome species and strain level alteration and cognitive function. Furthermore, we could suggest microbial sucrose and SAMe metabolic pathways might have some underlying roles in cognitive function differences in dementia and MCI.
We also need to mention there are some limitations. First, since control data was acquired through preexisting biobank, only 16S rRNA sequencing data were obtained to compare with AD WMGS data. However, it is assumed that 16S rRNA sequencing is a robust, well-characterized method that provides adequate information about the composition of microbial communities, starting from a relatively small number of sequences per samples [67]. We also observed quite comparable rarefaction curves and good’s coverage [68] between AD and NC samples down to their family-level taxa, which means their sequencing depth has similarly adequate between AD and NC. In addition, to remove any biases, we only conducted comparative analyses in phylum, class, order, and family taxa resolution in AD and NC. Second, the sample size of MCI and dementia in AD is relatively small to elucidate robust evidence in comparisons. Additionally, the effect size of MaAsLin on significant genus and species associated with MMSE and CDR scores were a bit small to be applicable to clinical aspects. Third, due to the lack of data, we also could not examine the underlying mechanism of sucrose or SAMe metabolic pathways associated with microbiome and dementia risk in the context of AD biomarkers such as amyloid-β, tau tangles, and brain imaging data. Fourth, although we limited the patients with active infection by exclusion criteria, we did not have any strategy to exclude latent tuberculosis infection in our AD patients given tuberculosis (TB) is known associated with microbiome perturbation and chronic infection-related amyloidopathy [69]. Although we could not find any TB-related features in our samples (M. Tuberculosis or M. Avium) at least in the colon of included subjects, it is known that the feasibility of using stool samples to diagnose pulmonary tuberculosis is limited by the observations that swallowed sputum in stool is likely to be considerably diluted within the intestinal tract. Also, detection may be impaired by gastric acid killing mycobacteria, stool flora contaminating cultures, and stool may contain PCR inhibitors [70]. Certainly, investigators have had no trouble finding mycobacteria while they were investigating lung microbiomes [71]. Last, sucrose or SAMe metabolic pathways could not be related to metabolites in the feces or serum to picture the mechanistic links. Therefore, further multifaceted studies collecting AD biomarkers, fecal and serum metabolomics are highly warranted.
Conclusions
Abundance of several gut microbes were associated with lower cognitive function in AD patients recruited at Taipei Medical University Hospital. These AD patients are all Taiwanese with similar lifestyle and dietary pattern as well as lower systemic infection such as TB in the study populations. In addition, the enrichment of microbes in the sucrose and SAMe related microbial metabolic pathways suggested these metabolic pathways might be associated with cognitive function in AD. Mechanistic experiments to validate these findings are needed to further elucidate roles of these gut microbes in cognitive decline.
Footnotes
ACKNOWLEDGMENTS
We would like to thank Dr. Wei-Kuang Chi and Dr. Chi-Feng Chang for their roles in the initial phase to determine the project scopes, link up the collaboration parties, and facilitate the initial meetings with Department of Industrial Technology (DoIT) for approval to conduct this project. This project is funded by Development Center for Biotechnology (grant number:108VE012) in Taiwan.