
Abstract
Background:
Alzheimer’s disease (AD) is a progressive age-dependent disorder whose risk is affected by genetic factors. Better models for investigating early effects of risk factors such as apolipoprotein E (APOE) genotype are needed.
Objective:
To determine whether APOE genotype produces neuropathologies in an AD-susceptible neural system, we compared effects of human APOE ɛ3 (E3) and APOE ɛ4 (E4) alleles on the mouse olfactory epithelium.
Methods:
RNA-Seq using the STAR aligner and DESeq2, immunohistochemistry for activated caspase-3 and phosphorylated histone H3, glucose uptake after oral gavage of 2-[1,2-3H (N)]-deoxy-D-glucose, and Seahorse Mito Stress tests on dissociated olfactory mucosal cells.
Results:
E3 and E4 olfactory mucosae show 121 differentially abundant mRNAs at age 6 months. These do not indicate differences in cell type proportions, but effects on 17 odorant receptor mRNAs suggest small differences in tissue development. Ten oxidoreductases mRNAs important for cellular metabolism and mitochondria are less abundant in E4 olfactory mucosae but this does not translate into differences in cellular respiration. E4 olfactory mucosae show lower glucose uptake, characteristic of AD susceptibility and consistent with greater expression of the glucose-sensitive gene, Asns. Olfactory sensory neuron apoptosis is unaffected at age 6 months but is greater in E4 mice at 10 months.
Conclusion:
Effects of human APOE alleles on mouse olfactory epithelium phenotype are apparent in early adulthood, and neuronal loss begins to increase by middle age (10 months). The olfactory epithelium is an appropriate model for the ability of human APOE alleles to modulate age-dependent effects associated with the progression of AD.
Keywords
INTRODUCTION
Alzheimer’s disease (AD) is the most common type of dementia, estimated to affect more than 5 million U.S. citizens and more than 25 million people worldwide. It presents as a loss of cognitive functions, especially short-term memory, and is associated with the loss of synapses and neurons in several brain regions, eventually leading to atrophy of these regions [1, 2]. Postmortem neuropathology of AD brains first distinguished the disease via two characteristic features, senile plaques consisting of aggregations of amyloid-β (Aβ) from the amyloid-β protein precursor and neurofibrillary tangles consisting of aggregations of phosphorylated microtubule-associated protein tau [3]. Unfortunately, these clues to the etiology of the disease have led to a limited understanding of the mechanism of onset of AD and no successful therapies, facts that point toward a need to understand early stages of neuronal dysfunction leading to AD [4].
The pathophysiological development of AD is complex and multifactorial [5]. Clinically, two types of AD are present, familial AD (FAD) and late onset AD (LOAD). FAD accounts for approximately 1–5% of AD cases [6, 7] and is determined by nonsynonymous mutations in three genes, namely presenilin 1 (PSEN1), presenilin 2 (PSEN2), and amyloid precursor protein (APP) [8]. FAD onset occurs at relatively young ages, typically appearing between 30 to 60 years of age [9]. LOAD typically presents after age 65, and it accounts for approximately 95% of AD cases [6]. It is a polygenic disorder where genotype is the major factor affecting susceptibility to the disease [10]. Among these genetic risk factors, the one conferring by far the greatest risk for developing LOAD is Apolipoprotein E (APOE) genotype [11, 12].
In the brain, ApoE is expressed primarily in astrocytes where it helps to carry cholesterol and other lipids to neurons to help them maintain cell membranes and synapses [13–17]. Compared to the more common ɛ3 (E3) allele of the APOE gene, considered by convention to confer a normal level of risk for LOAD, the ɛ4 (E4) allele increases the risk by about 12-fold if both alleles are ɛ4 alleles and by about 3-fold if one allele is an ɛ4 allele [12, 18]. A third allele, ɛ2 (APOE2), confers protection from LOAD compared to the ɛ3 allele [18–20].
In AD, gradually worsening deficits in olfaction often appear years before cognitive decline, making poor performance on tests of odor detection a possible sign of early stages of AD and an indicator of disease progression [21–36]. Consistent with these observations, postmortem studies find that pathological changes such as cell loss, senile plaques, and neurofibrillary tangles occur early in olfactory information processing regions of the central nervous system such as entorhinal and transentorhinal areas, the anterior olfactory nucleus, and the olfactory bulb [37, 38]. As LOAD progresses olfactory information processing areas often show heavy tau pathology, especially the entorhinal cortex, perirhinal cortex, CA1 and subicular area of the hippocampus, and amygdala [39]. In contrast to these studies of central changes, relatively little attention has been paid to deficits in the olfactory epithelia of persons suffering from AD [40, 41]. Whether effects on the olfactory epithelium could contribute to olfactory deficits in AD is therefore uncertain. However, studies of animal models of the much less common FAD show effects on olfactory sensory neurons (OSNs) and their supporting cells, including Aβ-independent apoptosis of OSNs [42–47]. In contrast, whether LOAD risk factors also have effects on the olfactory epithelium has not been reported.
The olfactory epithelium evolved to detect volatile chemicals called odorants. To do so, it produces and supports bipolar OSNs whose ciliated dendrites project into an olfactory mucus layer exposed directly to inhaled air. OSN axons project through the cribriform plate of the skull into the olfactory bulb in the brain. Perhaps due to their exposure to damaging agents from the external environment, OSNs are continuously replaced throughout life from basally located stem and progenitor cells [48, 49]. Helping to support OSNs and coordinate their replacement are sustentacular cells. Their cell bodies sit apically in this pseudostratified epithelium where they surround and separate OSN dendrites, and their processes surround the OSN cell bodies in the middle of the epithelium before passing though the basal cell layer to terminate at the basal lamina. As an accessible part of the nervous system, the olfactory epithelium has advantages for mechanistic studies of the early events leading to the age-dependent neurodegeneration responsible for LOAD. The ability to biopsy the human olfactory epithelium, a surgical procedure done with local anesthesia where 2–3 mm of olfactory epithelium is scooped from the nasal septum through a naris (nostril) [50, 51], would facilitate assessment of cellular and molecular deficits in OSNs, should any prove to correlate with the progression of AD. Furthermore, continuous replacement of OSNs throughout life [52, 53] makes it possible to experimentally separate effects correlated with neuronal age from non-cell autonomous effects of organismal age.
Given that OSNs and neighboring cells of the olfactory epithelium are affected by mutations leading to FAD and toxic products produced in FAD [42–47], they might also be sensitive to risk factors for LOAD. To test this hypothesis, we investigated whether mice in which the endogenous mouse Apoe gene has been replaced by either human APOE ɛ3 or APOE ɛ4 alleles (E3 and E4 mice, respectively) show age-dependent differences in the olfactory epithelium. E4 mice show behavioral symptoms and brain pathologies related to AD, such as age-dependent cognitive deficits, increased levels of Aβ and hyperphosphorylated tau in brain neurons, synaptic deficiencies, and reductions in cerebral glucose metabolism [54–59]. Whether the olfactory epithelia of E4 mice also show symptoms characteristic of LOAD had not previously been determined. We find that the olfactory epithelia of E4 mice carrying two human APOE ɛ4 alleles do indeed differ from olfactory epithelia of E3 mice carrying two human APOE ɛ3 alleles, particularly in regards to glucose hypometabolism in mature adults and increased neuronal apoptosis at middle age.
MATERIAL AND METHODS
Selection of mice
To assess the effect of human APOE genotype on the olfactory epithelia of mice, two strains of gene-targeted mice on a C57BL/6 background were used. In E3 mice the human APOE ɛ3 allele replaces the mouse Apoe gene and in E4 mice the human APOE ɛ4 allele replaces the mouse Apoe gene. The olfactory epithelium shows little sexual dimorphism under most conditions, including the same sex housing conditions used for this study [60, 61], so both male and female mice were used in this study. Mice were treated according to an approved Institutional Animal Care and Use protocol.
Tissue lysis and RNA extraction
Dissections of olfactory epithelia typically include small amounts of neighboring cells from respiratory epithelia and from the underlying lamina propria, cartilage, and bone. For this reason, these dissected samples are properly called olfactory mucosae. Olfactory mucosae were dissected and placed into 500μl of lysis buffer from the RNeasy Mini Kit (Cat.no. 74004, Qiagen, Hilden, Germany) in a 1.5 mL tube on ice. Tissues were homogenized using the Tissue Ruptor (Cat. no. A662282, Omni International-GLH, Kennesaw, Georgia) for 50 s, and the tube was returned to ice. Total RNA was extracted from these lysed tissue samples using RNeasy Mini Kit according to manufacturer’s instructions (Qiagen). Total RNA was eluted in 50μl RNAse free water and stored at –80°C. The integrity and purity of RNA was measured with the Agilent Bioanalyzer 2100 using an RNA nano Chip kit (Agilent Technologies Inc., Palo Alto, CA). RNA integrity values (RIN) > 7 were considered of sufficient quality for RNA sequencing.
RNA-Seq
RNA-Seq was performed on four E3 samples (1 male, 3 females) and six E4 samples (3 males, 3 females) by Novogene (Novogene Corporation Inc, Sacramento, CA). RNA-Seq reads in the form of compressed Fastq files were uploaded to the Illumina BaseSpace Sequencing Hub (Illumina Inc., San Diego, CA) and were aligned to the mouse genome (build mm10) using the STAR Aligner v2.5.2a. After alignment, differential mRNA abundance was assessed using DESeq2 with Fragments Per Kilobase per Million mapped reads (FPKM) normalization. Loss of a male sample in processing led to fewer male E4 samples, causing us to reject significant differences in four Y-chromosome mRNAs (Eif2s3y, Uty, Ddx3y, and Kdm5d). Log2(Fold Difference) and -log(Padj) values were used for visualization of differences in transcript abundance in the form of volcano plots using Tableau software (Seattle, WA). For calculating the number of expressed genes, a threshold of FPKM > 5 was used. RNA-Seq data are available at Gene Expression Omnibus, accession number GSE181038.
Functional bioinformatics
Messenger RNAs showing significant differences were analyzed using the Database for Annotation, Visualization, and Integrated Discovery (DAVID) v6.7 [62]. The functional annotation clustering tool was used to look for enrichment of ontology annotations among Mus musculus genes. A Benjamini-Hochberg corrected threshold of p < 0.05 was applied.
Immunohistochemistry
Female E3 and E4 mice were paired across genotype to compensate for differences in timing and conditions of dissection of snouts. These were used to prepare coronal cryosections on microscope slides (Cat. no. 12-550-15, Fisher Scientific, Pittsburgh, PA) as described previously [63–67]. These frozen sections were thawed rapidly and permeabilized in phosphate buffered saline (PBS) pH 7.4 (Cat.no.14200, Gibco, Waltham, MA) containing 1% Triton X-100 for 30 min. 500μl of blocking buffer (2% BSA and 0.4% Triton X-100 in PBS) was applied to each slide for 1 h at room temperature followed by incubation overnight at 4°C in 1 : 200 dilutions of primary antibody in blocking buffer. The primary antibodies were directed against the active fragment of caspase-3 (Casp3) (Cat.no. 9661L, Cell Signaling Technology Inc., Danvers, MA) and against phosphorylated histone H3 (Cat.no. 06-570, EMD Millipore Biosciences, Billerica, MA). The specificities of these antibodies have been demonstrated previously [68–71]. Sections were incubated in washing buffer (0.05% Tween-20 in PBS) for 30 min followed by 90 min in a Cy3-conjugated donkey anti-rabbit IgG secondary antibody (Cat.no.711-165-152, Jackson ImmunoResearch Laboratories Inc., West Grove, PA) diluted 1 : 1000 in blocking buffer. The sections were then placed in washing buffer for 30 min. Counterstaining for nuclei was done for 5 min using Hoechst 33342 (Cat.no. H3570, Invitrogen, Carlsbad, CA) diluted 1 : 1000 in PBS and then the sections were rinsed with 1x PBS. Slides were mounted with an anti-fade mounting media, Vectashield (Cat. no. ZG1028, Vector Laboratories, Burlingame, CA), covered with a glass cover slip (Cat.no.48393241, VWR International, Radnor, PA) and sealed with nail polish. Fluorescent images were obtained on the Nikon Eclipse Ti-U inverted microscope with a SPOT camera and Spot software version 5.6 (SPOT Imaging, Sterling Heights, MI).
To avoid bias in selecting images used to quantify the frequency of immunoreactive cells, either brightfield or Hoechst 33342 fluorescence was used to locate olfactory epithelium in tissue sections and to select regions for imaging. Only then was antigen immunoreactivity viewed and images acquired using 10X or 20X objectives. At least 10 images per antigen per mouse were taken. Counts of immunoreactive cells in these images were done blind. Counts of cells immunoreactive for active Caspase-3 were made from the OSN cell body layers of the epithelium while counts for phosphorylated histone H3 were made from the basal cell layer. Counts were normalized by dividing by the total length of epithelium in the image and compared across genotype (n = 3).
Metabolic measurements
Mice of both sexes were weighed and administered an oral gavage (approximately 200μl per mouse) of 2-[1,2-3H (N)]-deoxy-D-glucose (Cat. No. NET328A001MC, Perkin Elmer, Waltham, MA) diluted in D-glucose solution (2 mg glucose /g body weight). Each E3 mouse was paired with an E4 mouse for age, sex, and time of gavage. Nine pairs of E3 and E4 mice were tested (four female pairs, five male pairs), with four pairs on one day and five on another. Thirty minutes after gavage, mice were administered a lethal dose of ketamine–xylazine–acepromazine cocktail (0.01 ml/g of 25 mg/ml ketamine (Covetrus, Dublin, OH), 0.625 mg/ml acepromazine (Covetrus), 3.125 mg/ml xylazine (Sigma-Aldrich, St. Louis, MO)) via intraperitoneal injection and olfactory mucosae were dissected. Tissue was homogenized in 4 ml of PBS. These homogenates were transferred to a scintillation vial, 1 ml of Optiphase scintillation fluid (Perkin Elmer) was added, and samples were measured on a liquid scintillation counter (Beckman Coulter, Inc., Brea, California). Counts were normalized to body weight.
Cellular respiration in dissociated olfactory mucosal cells
Seven male mice and five female mice of each genotype were used for this experiment. Olfactory mucosae were dissected from the nasal cavity and placed into a 2 mL collection tube containing 700μL of oxygenated low calcium saline solution (110 mM NaCl, 25 mM NaHCO3, 5 mM KCl, 5 mM N, N-bis(2-hydroxyethyl)-2-aminoethanesulfonic acid (BES), 1 mM MgSO4, 4.8 mM CaCl2, 5 mM EGTA, 10 mM NaOH, 10 mM glucose). The tissue was homogenized (Omni International GLH) at a speed level 1 for 60 s. The homogenized tissue was then transferred into a new pre-cooled 1.5 mL tube containing 150μL of oxygenated low calcium saline solution containing 5 mM cysteine and supplemented with 21 units of papain (Cat. No. P4762-1G, Sigma-Aldrich) and 0.3 units of DNase I (Cat. No. AM2222, Ambion Inc., Austin, Texas). The mixture in the tube were mixed by inverting 2-3 times and incubated for 37°C for 15 min. Then 450μL of non-oxygenated low calcium saline solution supplemented with 18,000 units of trypsin (Cat. No. T0303-1G, Sigma-Aldrich) and 0.9 units of DNase I, and the tube was mixed by inverting 2-3 times and incubated at 37°C for 5 min. The digested tissue sample was transferred into fresh culture tube (Cat. No. 60825-414, VWR) containing 3 mL of cold HBSS (Cat. No. 14025-092, Life Technologies, Carlsbad, CA) containing 6 units of DNase I. The digested tissue was homogenized at speed level 1 for 20 s and centrifuged for 10 min at 200 x g (Cat. no. 5810R, Eppendorf, Hamburg, Germany). The supernatant was discarded, and the content were transferred to a fresh culture tube containing 3ml of cold HBSS containing 6 units of DNase I. The above procedure was repeated one more time and finally after decanting the supernatant each pellet was resuspended into 800μl of Seahorse XF Assay medium and further filtered through a cell-strainer cap into a 5 mL polystyrene round-bottom tube (Cat. no. 352235, Corning Life Sciences, Tewksbury, MA). The tube was incubated at 37°C for 2 min and cells were counted on a BIO-RAD TC20™ Automated Cell Counter (Hercules, CA).
Cellular respiration measurements were done immediately after cell dissociation using a Seahorse XFe96 (Agilent Technologies Inc., Santa Clara, CA). The final cell pellets of acutely dissociated olfactory mucosal cells were resuspended in 1 ml XF assay media (Cat. no.103680, Agilent Technologies) containing 10 mM glucose, 2 mM glutamine, and 1 mM pyruvate. Live cell counting was done using trypan blue staining. Based on these counts, 120,000 live cells in 175μl media were plated per well on a 96-well Seahorse cell culture plate coated with Cell-Tak (Cat. no. 354240, Corning). Once cells were added to wells, plates were spun at 300 x g for 5 min and then incubated at 37°C for 30 min. Injection ports of a Seahorse cartridge, hydrated on the previous day per manufacturer instructions, were loaded and the assay was performed as per the Mito Stress Test protocol. The substrates/inhibitors/uncouplers were prepared in the reconstituted XF assay media and injected such that the cells were sequentially exposed to 2.5μM Oligomycin, 1μM FCCP (2-[2-4-(trifluoromethoxy) phenyl] hydrazinylidene] - propanedinitrile), 0.1μM Rotenone+10 mM Succinate, and 1μM antimycin-A injected through Seahorse cartridge ports A, B, C, and D respectively. Oxygen consumption rates were measured after each injection and the respiratory parameters were determined using the Mito Stress test output format.
Statistical analyses
For immunohistochemistry, cell counts from paired E3 and E4 mice were generated by a person blind to genotype and then analyzed by one-sided paired t-tests (n = 3). The increased risk of LOAD associated with the APOE ɛ4 allele predicts loss of neurons in E4 mice, justifying one-sided tests. For glucose uptake the normalized counts from paired E3 and E4 mice were analyzed by one-sided paired t-tests (n = 9). The presence of APOE ɛ4 alleles is associated with decreased glucose uptake in other tissues, justifying one-sided tests [54, 72–76]. For each quantitative outcome of the cellular respiration measures, an analysis of covariance (ANCOVA) model was fit to test for differences between the two genotypes studied. Due to limitations on sample processing, the mice from each genotype group were split into four subgroups (3 mice per genotype for each subgroup) whose measurements were made on separate days. To account for any resulting variability in the outcome variables, we adjusted for the day of data collection in each model. Shapiro-Wilk and Levene tests were used in each case to check the assumptions of normality and homogeneity of variances, respectively. Graphical plots of the cellular respiration measures were also generated to assess model assumptions and genotype differences. No evidence of lack of normality or heteroscedasticity was found. Across these analyses, a p-value < 0.05 was considered statistically significant. All analyses were completed in R, version 4.0.3 (R Foundation for Statistical Computing; Vienna, Austria).
RESULTS
Differences in the transcriptomes of olfactory mucosae in adult E3 and E4 mice
The olfactory system is highly susceptible to AD and this susceptibility may include peripheral effects in the olfactory epithelium [45, 77]. A pilot experiment done on young adult mice (age 3 months) using E3 and E4 mice on a mixed genetic background (C57BL/6:FVB) identified hundreds (741) of differentially abundant mRNAs, suggesting that the olfactory epithelia of mice expressing human ɛ3 and ɛ4 alleles may be phenotypically different (Supplementary Figure 1; Supplementary Table 1). To test whether these differences arise from differential effects of the human alleles rather than genetic variation we assessed the transcriptome of olfactory mucosal samples from E3 and E4 mice on pure C57BL/6 genetic backgrounds at a mature adult age (6 months) when early events associated with LOAD are likely to be detectable. Samples of whole olfactory mucosae at this age contained mRNAs from 16,107 genes detected above background (mean FPKM > 5), consistent with previous measures of the transcriptome of this tissue [65, 79].
We detected 121 mRNAs that differed in abundance (Fig. 1; Supplementary Table 2). Of these, 75 are primarily expressed in mature OSNs [65, 81], with 46 being less abundant and 29 more abundant in E4 samples than E3 samples. This distribution is not strongly biased and only includes a few of the hundreds of mRNAs specific to mature OSNs, indicating that a difference in the proportion of mature OSNs in the olfactory epithelium is not the reason these mRNAs differed. Six of the mRNAs are expressed primarily by immature OSNs. Thirty-four of the mRNAs are found primarily in non-neuronal cells of the olfactory epithelium. Of these, 15 were less abundant and 19 more abundant in E4 mice. As with mature OSNs, this distribution indicates that the mRNA abundance differences are not due to differences in the abundance or proportions of non-neuronal cells in the samples.
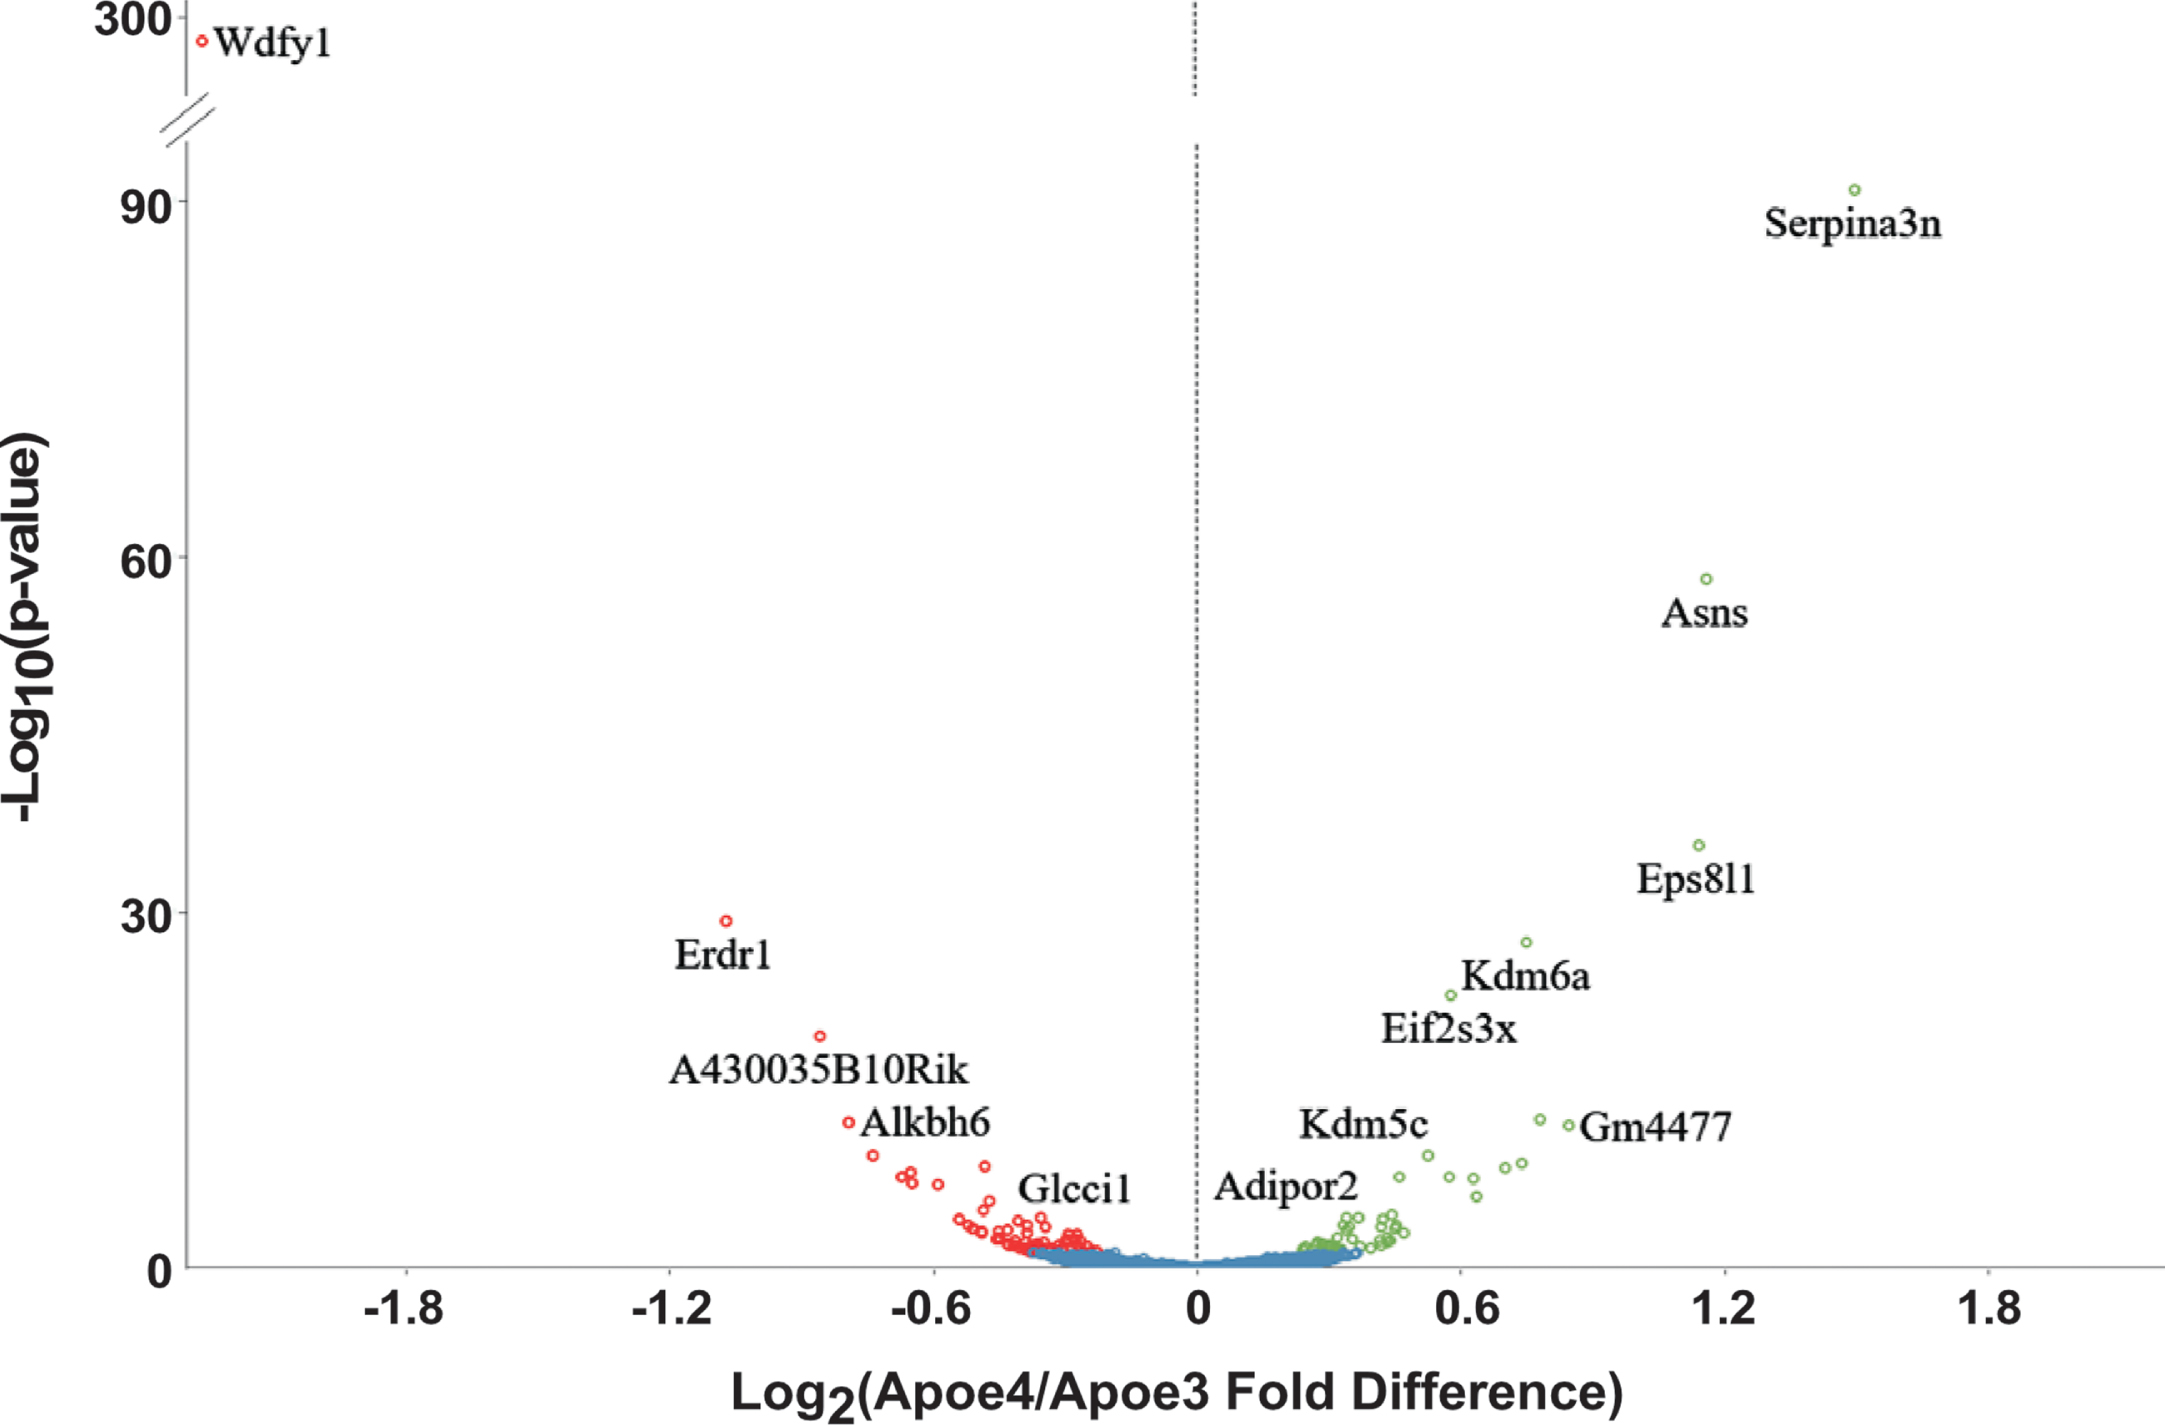
Differentially abundant mRNAs between E4 and E3 olfactory mucosae as detected by DESeq2.
Although some differentially abundant mRNAs come from genes on chromosome 7, such as Ndufa3 and Alkbh6, they are distant from the modified Apoe locus on this chromosome, and we do not detect a bias toward effects on mRNAs from genes located on chromosome 7. For example, more differentially abundant mRNAs arise from genes on chromosomes 2 and 6 than from chromosome 7.
The mRNA abundance differences between E3 and E4 samples include mRNAs encoding proteins whose functional relationships are potentially related to increased risk of damage to neurons. Functional bioinformatics revealed overrepresented functional ontology annotations (Table 1) when all 121 differentially abundant mRNAs are assessed together and when these mRNAs are grouped into subsets according to which olfactory mucosal cell types express them most strongly. The latter is possible because the transcriptomes of three cell populations in the olfactory epithelium have been defined in detail: mature OSNs, immature OSNs, and the pooled population of non-neuronal cells in this tissue [65, 80]. Analyses of the mRNAs primarily expressed in this non-neuronal population and more abundant in E4 samples revealed an overrepresented serine protease inhibitor annotation due to a group of four mRNAs (Serpina3m, Serpina3n, Agt, and Slpi). Functional bioinformatics of every level of analysis, from the entire set of 121 differentially abundant mRNAs down to mature OSN mRNAs less abundant in E4 mice, revealed that olfactory transduction is an overrepresented annotation due to differences in the abundance of 17 odorant receptor mRNAs. Oxidoreductase was also an overrepresented annotation due to a set of 10 mRNAs that are less abundant in E4 samples (Table 1). These mRNAs encode either oxidoreductases or proteins that regulate oxidoreductases. If we exclude odorant receptors and restrict functional bioinformatics analysis to the 77 mRNAs that are not significant in previously published data from cortex, this overrepresentation of oxidoreductases remains.
Functional bioinformatics of differentially abundant mRNAs
Cellular respiration is not affected at 6 months of age
The lower abundance of a set of 10 mRNAs related to oxidoreductases in E4 samples suggested decreased capacity in some cellular metabolism pathways in cells from the olfactory mucosae of E4 mice compared to E3 mice. Several of these mRNAs are abundant in OSNs (Adi1, Alkbh6, Gapdhs, Gpx1, Gpx4, Nnt, and Pcyox1) and others are expressed primarily in non-neuronal cells (Aldh1a7, Cbr2, and Cyp2e1). Of the encoded proteins, five are known to reside in mitochondria or have effects on mitochondria (Cbr2, Cyp2e1, Gpx1, Gpx4, and Nnt), suggesting potential for effects on cellular respiration [82–86]. We investigated this hypothesis using Seahorse technology to measure respiration in cells acutely dissociated from olfactory mucosae. Mito Stress test experiments found no significant differences in any parameter of cellular respiration (Fig. 2; Supplementary Table 3).

Cellular respiration measures show no differences between E4 and E3 olfactory mucosae. A) To illustrate Mito Stress Test oxygen consumption rate (OCR) measurements, data from the two samples of cells acutely dissociated from olfactory mucosae, one each from E4 and E3 mice, are shown. Oligo, oligomycin; Rot+Succ, mixture of rotenone and succinate; Anti-A, antimycin-A. Measures of basal respiration (B), mitochondrial proton leak (C), maximum respiration (D), spare respiratory capacity (E), non-mitochondrial oxygen consumption (F), ATP production (G), coupling efficiency (H), and spare respiratory capacity (I) for E4 and E3 cell samples. The p-values are from analysis of covariance.
Glucose hypometabolism in E4 olfactory mucosae at 6 months of age
Glucose hypometabolism is perhaps the earliest symptom of a nervous system at risk for LOAD [54, 72–76]. We note that the mRNA with the second largest positive difference between E4 and E3 is Asns. Asns is an asparagine synthase whose expression increases when glucose availability is reduced [87]. Asns mRNA should increase when glucose uptake is reduced, predicting that E4 olfactory mucosae have lower glucose uptake than E3 olfactory mucosae. Another clue potentially linking transcriptome differences with glucose hypometabolism in olfactory mucosae is a decrease in Gapdhs mRNA. Knockdown of Gapdhs mRNA in melanoma cells decreases glucose uptake [88]. When we measured glucose uptake in samples of olfactory mucosae at age 6 months, we detected less uptake in E4 samples relative to E3 samples (Fig. 3; Supplementary Table 4). Since Asns is broadly expressed in mature OSNs, immature OSNs, and non-neuronal cells of the olfactory epithelium [65], these data do not yet point toward differences in glucose uptake in any particular cell type.

Glucose (2- [1,2-3H (N)]-deoxy-d-glucose) uptake was lower in olfactory mucosal samples from E4 mice compared to E3 mice (one-sided paired t-test; n = 9). To minimize temporal variation, each E4 mouse was paired with an E3 mouse. Effect size is displayed as the confidence interval around the paired mean difference.
OSN apoptosis increases in E4 mice at 10 months of age
AD leads to loss of neurons in several regions of the human brain, including regions that process olfactory signals [37–39]. Human OSNs from people suffering from AD show morphological differences from non-AD individuals, consistent with olfactory epithelium pathology [41]. Furthermore, OSNs are susceptible to apoptosis at very early ages in mouse models of FAD [45]. Based on these findings we hypothesized that the E4 mouse model of increased risk for LOAD would show evidence of increased OSN apoptosis relative to E3 mice. In a paired design experiment, we performed immunostaining for the active fragment of Casp3, a marker of OSN apoptosis, in olfactory epithelia of E3 and E4 mice. We found a significant difference in the frequency of Casp3 immunoreactivity in OSNs of E4 mice compared to E3 mice at 10 months of age but not at 6 months of age (Fig. 4A-C; Supplementary Table 5). These data indicate that human E4 does not begin to have measurable effects on mouse OSN survival until middle age.
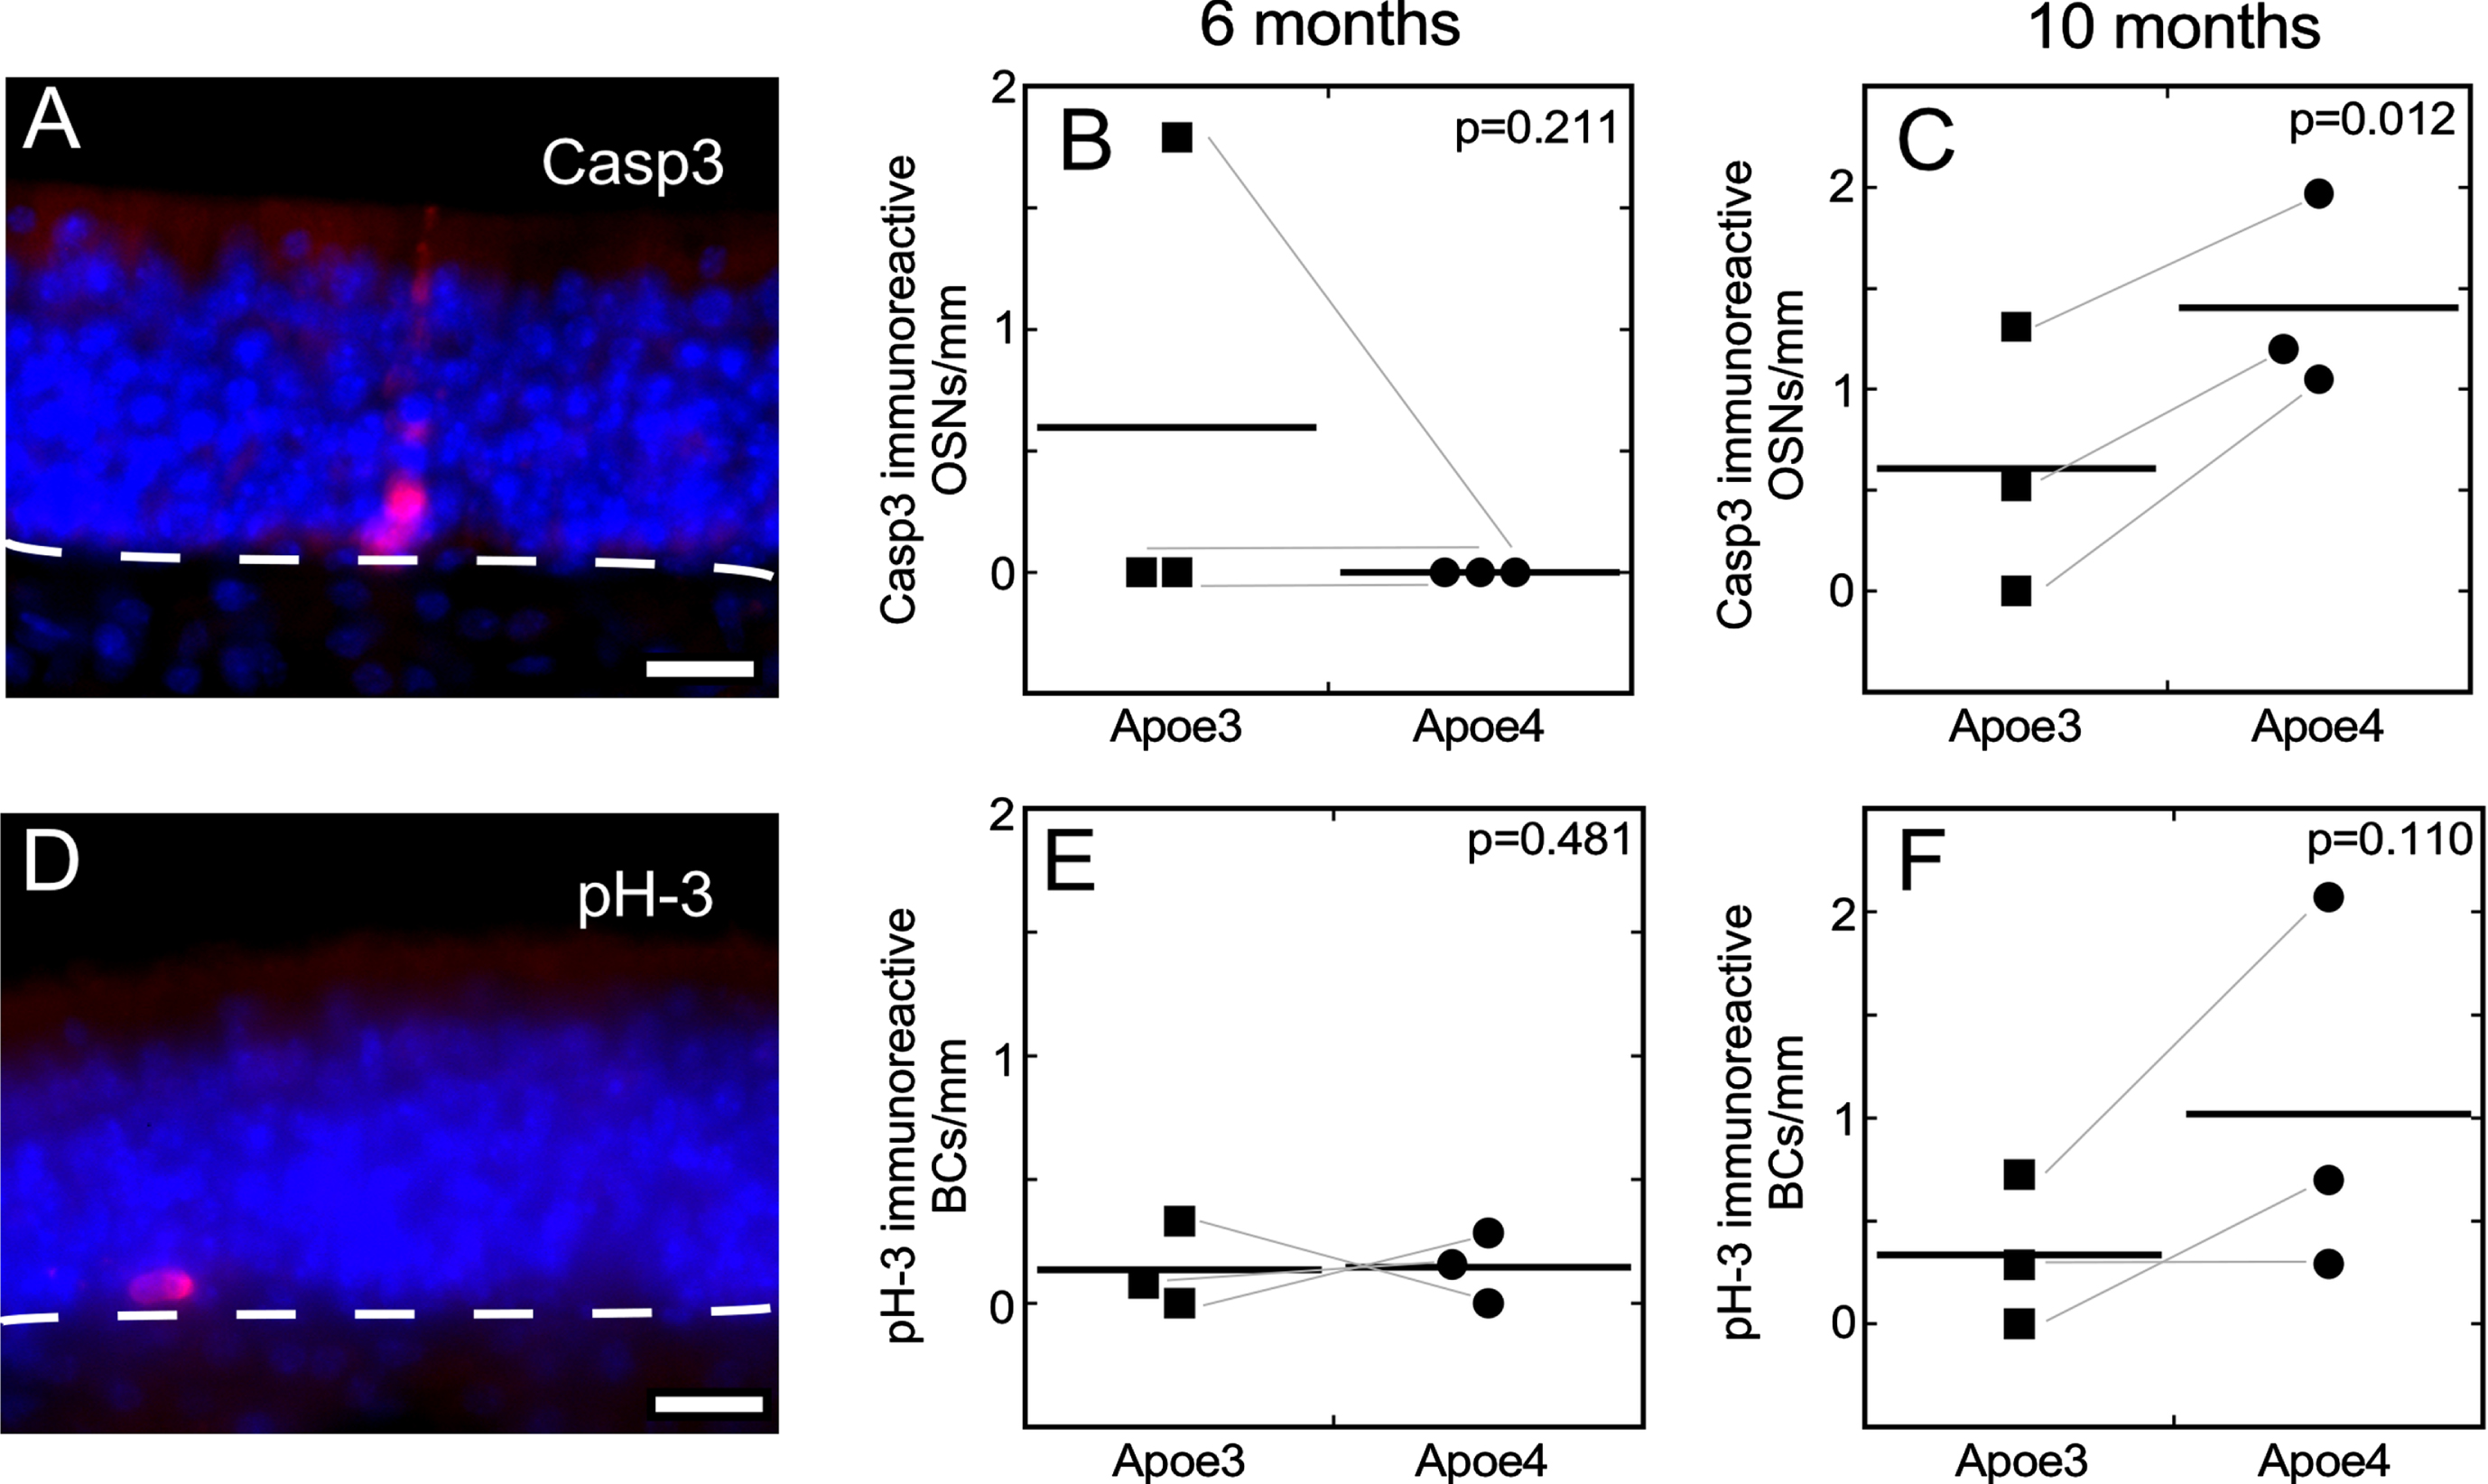
The rate of OSN apoptosis, as measured by the frequency of OSNs immunoreactive for the active fragment of Casp3, is greater in E4 mice than in E3 mice at age 10 months (one-sided paired t-tests). A. Example of a Casp3-immunoreactive OSN in an E3 mouse at age 6 months. B, C) The frequency of Casp3 immunoreactive OSNs differ at age 10 months but not at age 6 months. D) Example of phosphorylated histone H3 (pH-3) immunoreactive basal cells in an E3 mouse at age 6 months. E, F) The frequency of basal cell proliferation, as measured by pH-3 immunoreactivity does not differ at either age.
The olfactory epithelium continuously replaces OSNs throughout life from basal stem and progenitor cells. When OSN loss increases substantially the rate of basal cell proliferation increases to maintain the size of the OSN population [89]. Whether small increases in the rate of OSN apoptosis would increase basal cell proliferation is uncertain. In undamaged olfactory epithelia of wild-type mice, a peak of apoptosis occurs at the boundary between the basal cell layer and the immature OSN layer, consistent with overproduction of basal cells under laboratory housing conditions [48]. This suggests that small increases in OSN apoptosis might not lead to increased basal cell proliferation. We used immunoreactivity for phosphorylation of histone H3, a highly specific marker of mitosis, to assess basal cell proliferation. These data revealed no difference in basal cell proliferation in the olfactory epithelia of E4 mice compared to E3 mice at either 6 or 10 months of age (Fig. 4C-F).
DISCUSSION
Recent advances in understanding the progression of AD and the lack of impact of therapies targeting late-stage symptoms have shifted attention to early deficits that might prove more effective as therapeutic targets [4]. Studies directed toward identifying and understanding these early deficits would benefit from models that emphasize the period prior to neuronal loss. In this sense, comparing the olfactory epithelia of E3 and E4 mice is a promising model. We find evidence of glucose hypometabolism in E4 olfactory mucosae of mature adults (age 6 months) when other early neuropathologies and neuronal death are not yet increased. Evidence of an age-dependent progression of AD-related neuropathologies is the increase in OSN apoptosis that becomes detectable as E4 mice reach middle age (10 months). Furthermore, we find differences in the transcriptomes of E3 and E4 olfactory mucosae at 6 months, potential links to the phenotypic differences we observe. These may yet identify specific causes for greater rates of OSN apoptosis in E4 mice as age increases, but as appears the case for the glucose-sensitive gene, Asns, some may instead be outcomes of phenotype differences. In either case, they reveal that the human E4 allele has effects on both the transcriptomes and phenotypes of cells in the olfactory epithelium.
As a model of LOAD and early events leading to AD, the olfactory epithelium and its OSNs have more advantages than a period during which events progress toward increased neuronal death. First, it is an accessible and replaceable population of neurons in which early symptoms could be assessed in humans. Second, it has just one type of neuron, the OSN. This simplifies many types of experiments and analyses. Third, OSNs are susceptible to AD-related neuropathologies. For example, mutant human proteins responsible for FAD and toxic proteins they produce greatly increased mouse OSN apoptosis, often at very young ages [42–47]. Importantly, OSN apoptosis in at least one of these FAD models is independent of Aβ [45]. We extend evidence of increased OSN apoptosis to E4 mice, a model of risk for LOAD. Fourth, the complete transcriptomes of mature and immature OSNs are known, and the transcriptomes of the other cells in the olfactory epithelium are nearly as well characterized [65, 91]. Most of these data come from experiments on purified populations of each cell type so that the entire transcriptomes are captured, instead of single-cell RNA-seq data where only a fraction of each cell types’ transcriptomes are detected. Fifth, the transcriptome differences between E3 and E4 olfactory mucosae have substantial similarities to differences found in cortical regions of E3 and E4 mouse brain [92, 93]. This argues that molecular diagnostic approaches could be used on olfactory epithelium biopsies to assess progression of molecular events associated with AD-relevant neuropathologies. Sixth, similar to the brain where Apoe is expressed by astrocytes, in the olfactory epithelium Apoe is expressed not by neurons but by the glial-like sustentacular cells that support the OSNs [94]. Seventh, continuous replacement of OSNs from stem cells resident in the olfactory epithelium allows experiments distinguishing cell-autonomous effects in OSNs from external effects, and OSN age from organismal age.
Related to these advantages of the olfactory epithelium as model for AD risk driven by human APOE genotype is evidence that E4 mice show neuropathologies related to AD. This includes general effects such as age-related cognitive deficits, increased levels of Aβ plaques and tauopathy in brain neurons, synaptic deficiencies, and reductions in cerebral glucose metabolism [54, 56–59], and also effects on central olfactory pathways and olfactory-driven behaviors. By 6 months of age, APOE mice show allele-specific differences in odor habituation tests, as well as in field potential recordings from the olfactory bulb and piriform cortex, and homozygous E4 mice are hyperexcitable to odor stimuli compared to mice homozygous for the other human APOE alleles [22, 95].
The transcriptomes of olfactory mucosae from mature adult E3 and E4 mice are highly similar, but differences of potential importance for LOAD do exist. The mRNA abundance differences between olfactory mucosae of E3 and E4 mice show some interesting similarities to previously observed mRNA abundance differences between cortical regions of these mice, with 32 mRNAs that are affected in both olfactory mucosae and cortical samples [92, 93]. These include mRNAs more abundant in E4 samples and mRNAs less abundant in E4 samples. They tend to be the mRNAs with the largest differences, including Serpina3n, Asns, Eps8l1, Wdfy1, and Alkbh6. Serine protease inhibitors such as Serpina3n are particularly important for their role as negative regulators of extracellular signals, and they are known to be associated with AD and Aβ toxicity [96–98]. Extracellular signals regulated by SerpinA3 are involved in angiogenesis, apoptosis, fibrosis, oxidative stress, and the inflammatory response [99]. The most notable difference between our olfactory epithelium data and previously published data from cortex is the set of oxidoreductase mRNAs.
The differences in abundance of a set of mRNAs encoding oxidoreductases and their regulatory proteins, including several found in mitochondria, suggest possible effects on cellular respiration. We find no evidence of this in mature adults at age 6 months but cannot rule out the possibility that changes in cellular respiration could occur at more advanced ages. Alternatively, these differences in oxidoreductase-related mRNAs could instead be linked to differences in lipid, glucose, and fatty acid metabolism associated with the E4 genotype and consequent neural damage [100, 101]. For example, six of the oxidoreductases have functions that reduce oxidative stress or support DNA repair: Aldh1a7, Alkbh6, Cbr2, Cyp2e1, Gpx1, and Gpx4 [82, 102–106]. In addition, Adi1, Gpx1, and Gpx4 have been associated with AD neuropathologies [105, 107].
The transcriptome data reveal differences in mRNA abundance between olfactory mucosae of E4 and E3 mice, differences that are on the same order of magnitude as those found in the central nervous systems between E4 and E3 mice [92, 93]. These differences are not strongly biased toward greater or lesser amounts in E4 mice. This observation is true for mRNAs specific to mature OSNs, immature OSNs, and non-neuronal cells of the olfactory epithelium. These mRNA differences are therefore not due to differences in the proportions of cell types but rather most likely due to differences in gene expression. Furthermore, it is unlikely they could be due to genes expressed in mosaic patterns, except for the odorant receptors. Mosaic expression of activity-dependent genes occurs across the population of mature OSNs and, except for Pcdh10 [79], they are not the OSN mRNAs that differ between E4 and E3 mice. A more promising explanation for some of the differences in mRNA abundance between E4 and E3 mice is a subtle difference in the progress of olfactory epithelium development, leading to differences in the frequency of odorant receptor expression. Each OSN chooses to express just one of ∼1,100 odorant receptor genes via a process that includes both random and deterministic steps [108, 109]. This random element makes odorant receptor mRNAs more variable than the average mRNA in olfactory mucosal samples [79] so that even minor variation in development of the olfactory epithelium causes differences in the abundance of some odorant receptor mRNAs.
This study reveals phenotypic differences between olfactory epithelia of E3 and E4 mice in the middle of their lifespans. These are small differences, which is a limitation of this study, but this may have value in the sense that it may reflect the gradual progression of LOAD. Another limitation is that the data do not yet provide mechanistic explanations for how these differences arise or how they lead to increased loss of neurons. The most promising lead is the effect on oxidoreductase mRNAs, which could be involved in differences in lipid, glucose, and fatty acid metabolism associated with the E4 genotype. Overall, our findings demonstrate that the olfactory epithelium is a viable model for studying the effects of Apoe genotype on neurons, one that is more accessible than other parts of the nervous system. Further work on this model system should emphasize investigating phenotypic differences at greater temporal and cellular resolution, tracking the development of differences capable of leading to OSN loss.