
Abstract
Background:
5-Hydroxymethylcytosine (5hmC) is an epigenetic DNA modification that is highly abundant in central nervous system. It has been reported that DNA 5hmC dysregulation play a critical role in Alzheimer’s disease (AD) pathology. Changes in 5hmC signatures can be detected in circulating cell-free DNA (cfDNA), which has shown potential as a non-invasive liquid biopsy material.
Objective:
However, the genome-wide profiling of 5hmC in cfDNA and its potential for the diagnosis of AD has not been reported to date.
Methods:
We carried out a case-control study and used a genome-wide chemical capture followed by high-throughput sequencing to detect the genome-wide profiles of 5hmC in human cfDNA and identified differentially hydroxymethylated regions (DhMRs) in late-onset AD patients and the control.
Results:
We discovered significant differences of 5hmC enrichment in gene bodies which were linked to multiple AD pathogenesis-associated signaling pathways in AD patients compared with cognitively normal controls, indicating they can be well distinguished from normal controls by DhMRs in cfDNA. Specially, we identified 7 distinct genes (RABEP1, CPNE4, DNAJC15, REEP3, ROR1, CAMK1D, and RBFOX1) with predicting diagnostic potential based on their significant correlations with MMSE and MoCA scores of subjects.
Conclusion:
The present results suggest that 5hmC markers derived from plasma cfDNA can served as an effective, minimally invasive biomarkers for clinical auxiliary diagnosis of late-onset AD.
INTRODUCTION
Alzheimer’s disease (AD) is the most common cause of dementia and is quickly becoming one of the most expensive, lethal, and burdening disease in the world [1]. Physicians use a variety of approaches and tools to help make a diagnosis; however, a definitive diagnosis of AD can only be made postmortem [2]. Accurate and timely diagnosis of probable AD in living individuals is challenging, so the National Institute on Aging and the Alzheimer’s Association proposed to incorporate not only the clinical judgment but also biomarker tests [3]. There are some intriguing reasons to give consideration to peripheral blood biomarkers for AD. Firstly, it is impossible to obtain brain tissue samples from living patients. Secondly, biopsies in the cerebrospinal fluid (CSF) are very challenging from the perspective of obtaining longitudinal samples due to the risk of the CSF biopsy itself. Therefore, developing a peripheral blood biomarker test to assist in diagnosing AD would be of great significance.
AD is a complex multifactorial neurodegenerative disorder that involves complex interactions between genes and environmental factors [4]. Epigenetic factors, mediating the interactions of genes and environmental factors, of which the dysregulation has been implicated in brain aging and neurodegenerative disorders including AD [5, 6]. Notably, increasing studies have focused on the identification of 5-methylcytosine (5mC) in peripheral blood DNA to characterize AD in the past decade [7]. However, there is no study examining other DNA epigenetic modifications, like DNA hydroxymethylation, in peripheral blood DNA of AD patients and its potential role as a diagnostic biomarker.
5-Hydroxymethylcytosine (5hmC) is a stable epigenetic marker that is generated though oxidation of 5mC by the ten-eleven translocation family of dioxygenases [8]. This conversion is an important mechanism underlying the active demethylation of DNA. More importantly, studies indicated that 5hmC is highly enriched in the central nervous system [9], and dynamically regulated during neural development, being enriched with age across the lifespan [10, 11]. Altered levels of 5hmC have been associated with AD diagnosis as well as numerous neuropathological phenotypes, though the results are somewhat conflicting [6, 12–14]. The study of postmortem AD brains indicated that differentially hydroxymethylated genes were significantly enriched in AD-related pathology and clustered in functional gene ontology categories [15]. These findings suggest that 5hmC signature may represents a new dimension of epigenetic regulation that play an important role in AD diagnostics.
Cell-free DNA (cfDNA) in the peripheral blood circulation originates from apoptotic and necrotic cells from different tissues, which release DNA into the peripheral bloodstream upon degradation after cell death [16]. cfDNA in blood has attracted great interest as noninvasive source for the clinic with potential roles in disease diagnosis, such as cancers and vascular complications [17–19]. Notably, elevated cfDNA levels have been detected in patients with severe brain injury which is proof-of principle that cfDNA is shed from the brain to the peripheral blood stream during cell degradation [19]. AD is characterized by brain atrophy associated with apoptotic of synapses and neurons, hence the proportion of the cfDNA in plasma originating from which will increase in AD patients. These characteristics revealed great potential diagnostic or predictive value of 5hmC for AD. Therefore, we hypothesized that cfDNA-derived-5hmC landscape may be a potential diagnostic biomarker of AD and carried out a case-control study to test the feasibility.
METHODS
Participants and clinical laboratory tests
In total, 18 AD patients (>60 years) and age-matched (±3 years) cognitively normal subjects were recruited from November 2019 to June 2020 in the Second Hospital of Shandong University, Jinan, China. The diagnosis of AD was based on the present clinical procedure [1]. Firstly, face-to-face interviews were conducted by trained investigators to screen suspected AD patients using Mini-Mental State Examination (MMSE) and the Montreal Cognitive Assessment (MOCA). Next, according to the clinical diagnostic criteria of AD, the suspected AD patients received a complete set of physical and nervous system examinations, including Alzheimer’s Disease Cooperative Study-Activities of Daily Living Scale (ADCS-ADL), the Neuropsychiatric Inventory-Clinician rating scale (NPI-C), and magnetic resonance imaging. Physicians determined whether the patients were suffering from AD based on these clinical symptoms, and only the subjects who were diagnosed as AD by two physicians were included in our study. Participants with dementia family history, vascular dementia, depression, psychiatric disease, mental disorder, or drug or alcohol abuse were excluded. Fasting blood samples of the participants were obtained for the clinical tests on the morning following hospital admission. Total triglycerides (TG), total cholesterol (TC), high density lipoprotein cholesterol (HDL-C), and low density lipoprotein cholesterol (LDL-C) were determined by using AU5800 Chemistry Analyzer (Beckman).
The calculation of the sample size was based on the areas under the ROC curves. Considering a null hypothesis at 0.50, expecting an area under the curve for the 5-hmc signatures in cfDNA for predicting AD of 0.80 and taking into account an α risk at 5% and a β risk at 10%, we planned to include 17 patients per group. The sample size was performed using MedCalc 19.8 software (Mariakerke, Belgium). The included 18 cases and 24 controls in the present study can meet the need of sample size. The study was approved by The Ethics Committee of Qilu Hospital of Shandong University and registered at the Chinese Clinical Trial Registry (No. ChiCTR2100042537).
Sample collection and cell-free DNA sample isolation
Fasting peripheral blood samples (5–10 ml) were collected in EDTA anticoagulant tubes (BD). The peripheral blood samples were placed on ice and sent to the lab within 2 h. Plasma samples were collected from peripheral blood after centrifugation for 10 min at 1600 g (4°C) and for 10 min at 16,000 g (4°C). The prepared plasma samples were immediately stored at –80°C until purification. cfDNA was extracted from 3–5 ml of plasma using the QIAamp Circulating Nucleic Acid Kit (Qiagen) according to the manufacturer’s protocol. Concentrations and quality of cfDNA were quantified by Qubit fluorometer (Life Technologies) and 2% agarose gel electrophoresis (Invitrogen).
5hmC library preparation and high-throughput sequencing
5hmC libraries of the isolated cfDNA were prepared following a previously described selective chemical labeling technique [20]. Briefly, 10 ng cfDNA spiked with control oligos (0.01 pg of unmodified, methylated, or hydroxymethylated oligos per 10 ng cfDNA) was end repaired, 3’-adenylated, ligated to DNA Barcodes (Illumina Compatible), labeled with 5hmC and pulled down, and amplified with 14 cycles of PCR amplification using KAPA Hyper Prep Kit (Kapa Biosystems) according to the manufacturer’s instructions. The PCR products were purified using 1X AMPure XP beads according to the manufacturer’s instructions. The DNA concentration of each library was measured with a Qubit fluorometer (Life Technologies), and sequencing was performed on the Illumina NextSeq 500 platform.
Bioinformatics analysis and statistical analysis
All of the de-multiplexed sequencing reads passed filters was first trimmed to remove the low-quality bases and adaptor sequences by Trimmomatic (ver. 0.36) using the following parameters: ILLUMINACLIP:adapter.fa:2 : 30 : 7:1:TRUE; LEADING:3; SLIDINGWINDOW:4 : 15; TRAILING:3; and MINLEN:36. For the 5hmC-captured libraries, the trimmed reads were unique mapped to reference genome UCSC/hg19 by Bowtie2 with default parameters [21]. After filtering the duplicate reads, the mapping information for each reads pair was extracted and output as file of BED format for following analysis. Hydroxymethylated regions (hMRs) over corresponding input of each sample were identified using the peak calling software MACS (version 1.4.9) with default parameters [22]. Differential hMRs (DhMRs) analysis was performed using the PePr (version 1.1.1.18) [23]. We used normalized reads number per 50 bp among the genome of the hMRs to calculate the reads density normalized to one million reads in the library for each genomic position (Wig files). Screeshots of genomic regions were taken using the IGV genome browser. Genomic annotations of differential hMRs were performed by detecting hMRs overlapping each genomic region ≥1 bp with bedtools [24]. To functionally annotate putative DhMR genes, we conducted functional enrichment analysis for the identified DhMR genes using the Fisher’s test function in R. GO and KEGG pathways analysis was performed using custom perl scripts with hypergeometric test and WebGestalt (WEB-based GEne SeT AnaLysis Toolkit). The significance (p value) of the overrepresented GO terms or pathway was corrected by the Benjamini–Hochberg procedure. All statistical analysis were performed by SPSS 24.0 software and GraphPad Prism 8.0. Differences between control and AD group were analyzed using Student’s t-test. The correlation of the candidate diagnostic genes for AD with MMSE, MoCA, ADCS-ADL, and NPI-C scores were analyzed using Spearman’s correlation analysis. Receiver operating characteristic curve (ROC) analysis was used to calculate the area under curve (AUC) to preliminarily evaluate the predictive value of gene and AD. p < 0.05 indicated significance.
RESULTS
Basic characteristics of the participants
Totally, 18 AD patients and 24 age-matched controls were included in the present study. Table 1 shows the basic characteristics of the study participants. There was no significant difference in age, gender, TC, TG, LDL-C, and HDL-C between the two groups (p > 0.05). AD patients had significantly lower levels of cognitive function than the controls as shown by MMSE and MoCA scores (p < 0.001).
Characteristics of study participants
AD, dementia due to Alzheimer’s disease; TC, total cholesterol; TG, triglyceride; LDL-C, low density lipoprotein cholesterol; HDL-C, high density lipoprotein cholesterol; MMSE, Mini-Mental Status Examination; MOCA, Montreal Cognitive Assessment; ADCS-ADL, Alzheimer’s disease Cooperative study group–Activities of daily living inventory; NPI-C, The neuropsychiatric inventory-Clinician Rating Scale. /, no test, ***p < 0.001, between Control and AD.
Genome-wide 5hmC profiles of cfDNA of AD patients and the controls
According to the mapped rate and unique mapping rate, there were good sequencing quality observed between the two groups in this study (Supplementary Table 1). To answer whether or not the cfDNA 5hmC profiles differed between AD patients and the controls, we compared the distribution of 5hmC along the gene bodies and discovered that the overall normalized read density of cfDNA 5hmC was significantly different between the two groups (Fig. 1A). Compared with the controls, AD patients showed higher 5hmC level in gene bodies whereas it was depleted at transcription start site. Then, we analyzed 5hmC enrichment in different genomic characteristic regions and the overall genomic distribution of hMRs in all samples were shown in Fig. 1B. Consistent with previous studies in human brain [5, 25], the genome-wide analysis of hMRs of AD and control groups found that hMRs were mostly enriched in intragenic regions (e.g., introns, exon, promoter) and depletion in intergenic regions (Fig. 1C). These results underscored that 5hmC profiles of cfDNA between AD patients and controls indeed displayed significant differences.

Genome-wide distribution of 5hmC in cfDNA of AD patients and control individuals. A) 5hmC densities at TSS (±2 kb) and TES (±2 kb) in control and AD subjects. B) Pie chart shows the overall genomic distribution of hMRs in cfDNA. C) Normalized enrichment of hMRs across distinct genomic regions relative to that expected in cfDNA.
DhMRs involved in AD pathogenesis associated signaling pathways
After compared 5hmC profiles between AD patients and the controls, we identified 685 DhMRs between control and AD groups (153 hypo-hydroxymethylated, 532 hyper-hydroxymethylated, p < 0.05). The list of the annotated DhMR genes is shown in Supplementary Table 2. To evaluate the potential classification effects of DhMRs for AD and controls, we carried out the principal component analysis for DhMRs and found that AD samples showed prominent signatures and could be readily separated from the control groups (Fig. 2A). Thus, we thought that DhMRs may have the potential to distinguish AD patients from cognitively normal individuals. Next, we performed KEGG pathway enrichment analysis and realized that hyper-hydroxymethylated DhMRs annotated genes in AD patients were mainly distributed in AD pathogenesis-associated pathways, such as tight junction, MAPK signaling pathway, dopaminergic synapse, neurotrophin signaling pathway, and NF-kappa B signaling pathway (Fig. 2B). In additional, hypo-hydroxymethylated DhMRs annotated genes in samples from AD patients were also enriched in several AD-related pathways including fatty acid biosynthesis, axon guidance, pyruvate metabolism, and TCA cycle (Fig. 2C). Go analysis showed that these genes were involved in multiple AD pathogenesis-associated biological processes, such as metabolic process [26], ion binding [27], and cytoskeleton [28] (Supplementary Figures 1 and 2). Taken together, these results further indicate that the DhMRs play critical roles in the pathogenesis of AD and may be used to separated AD patients from cognitively normal individuals.
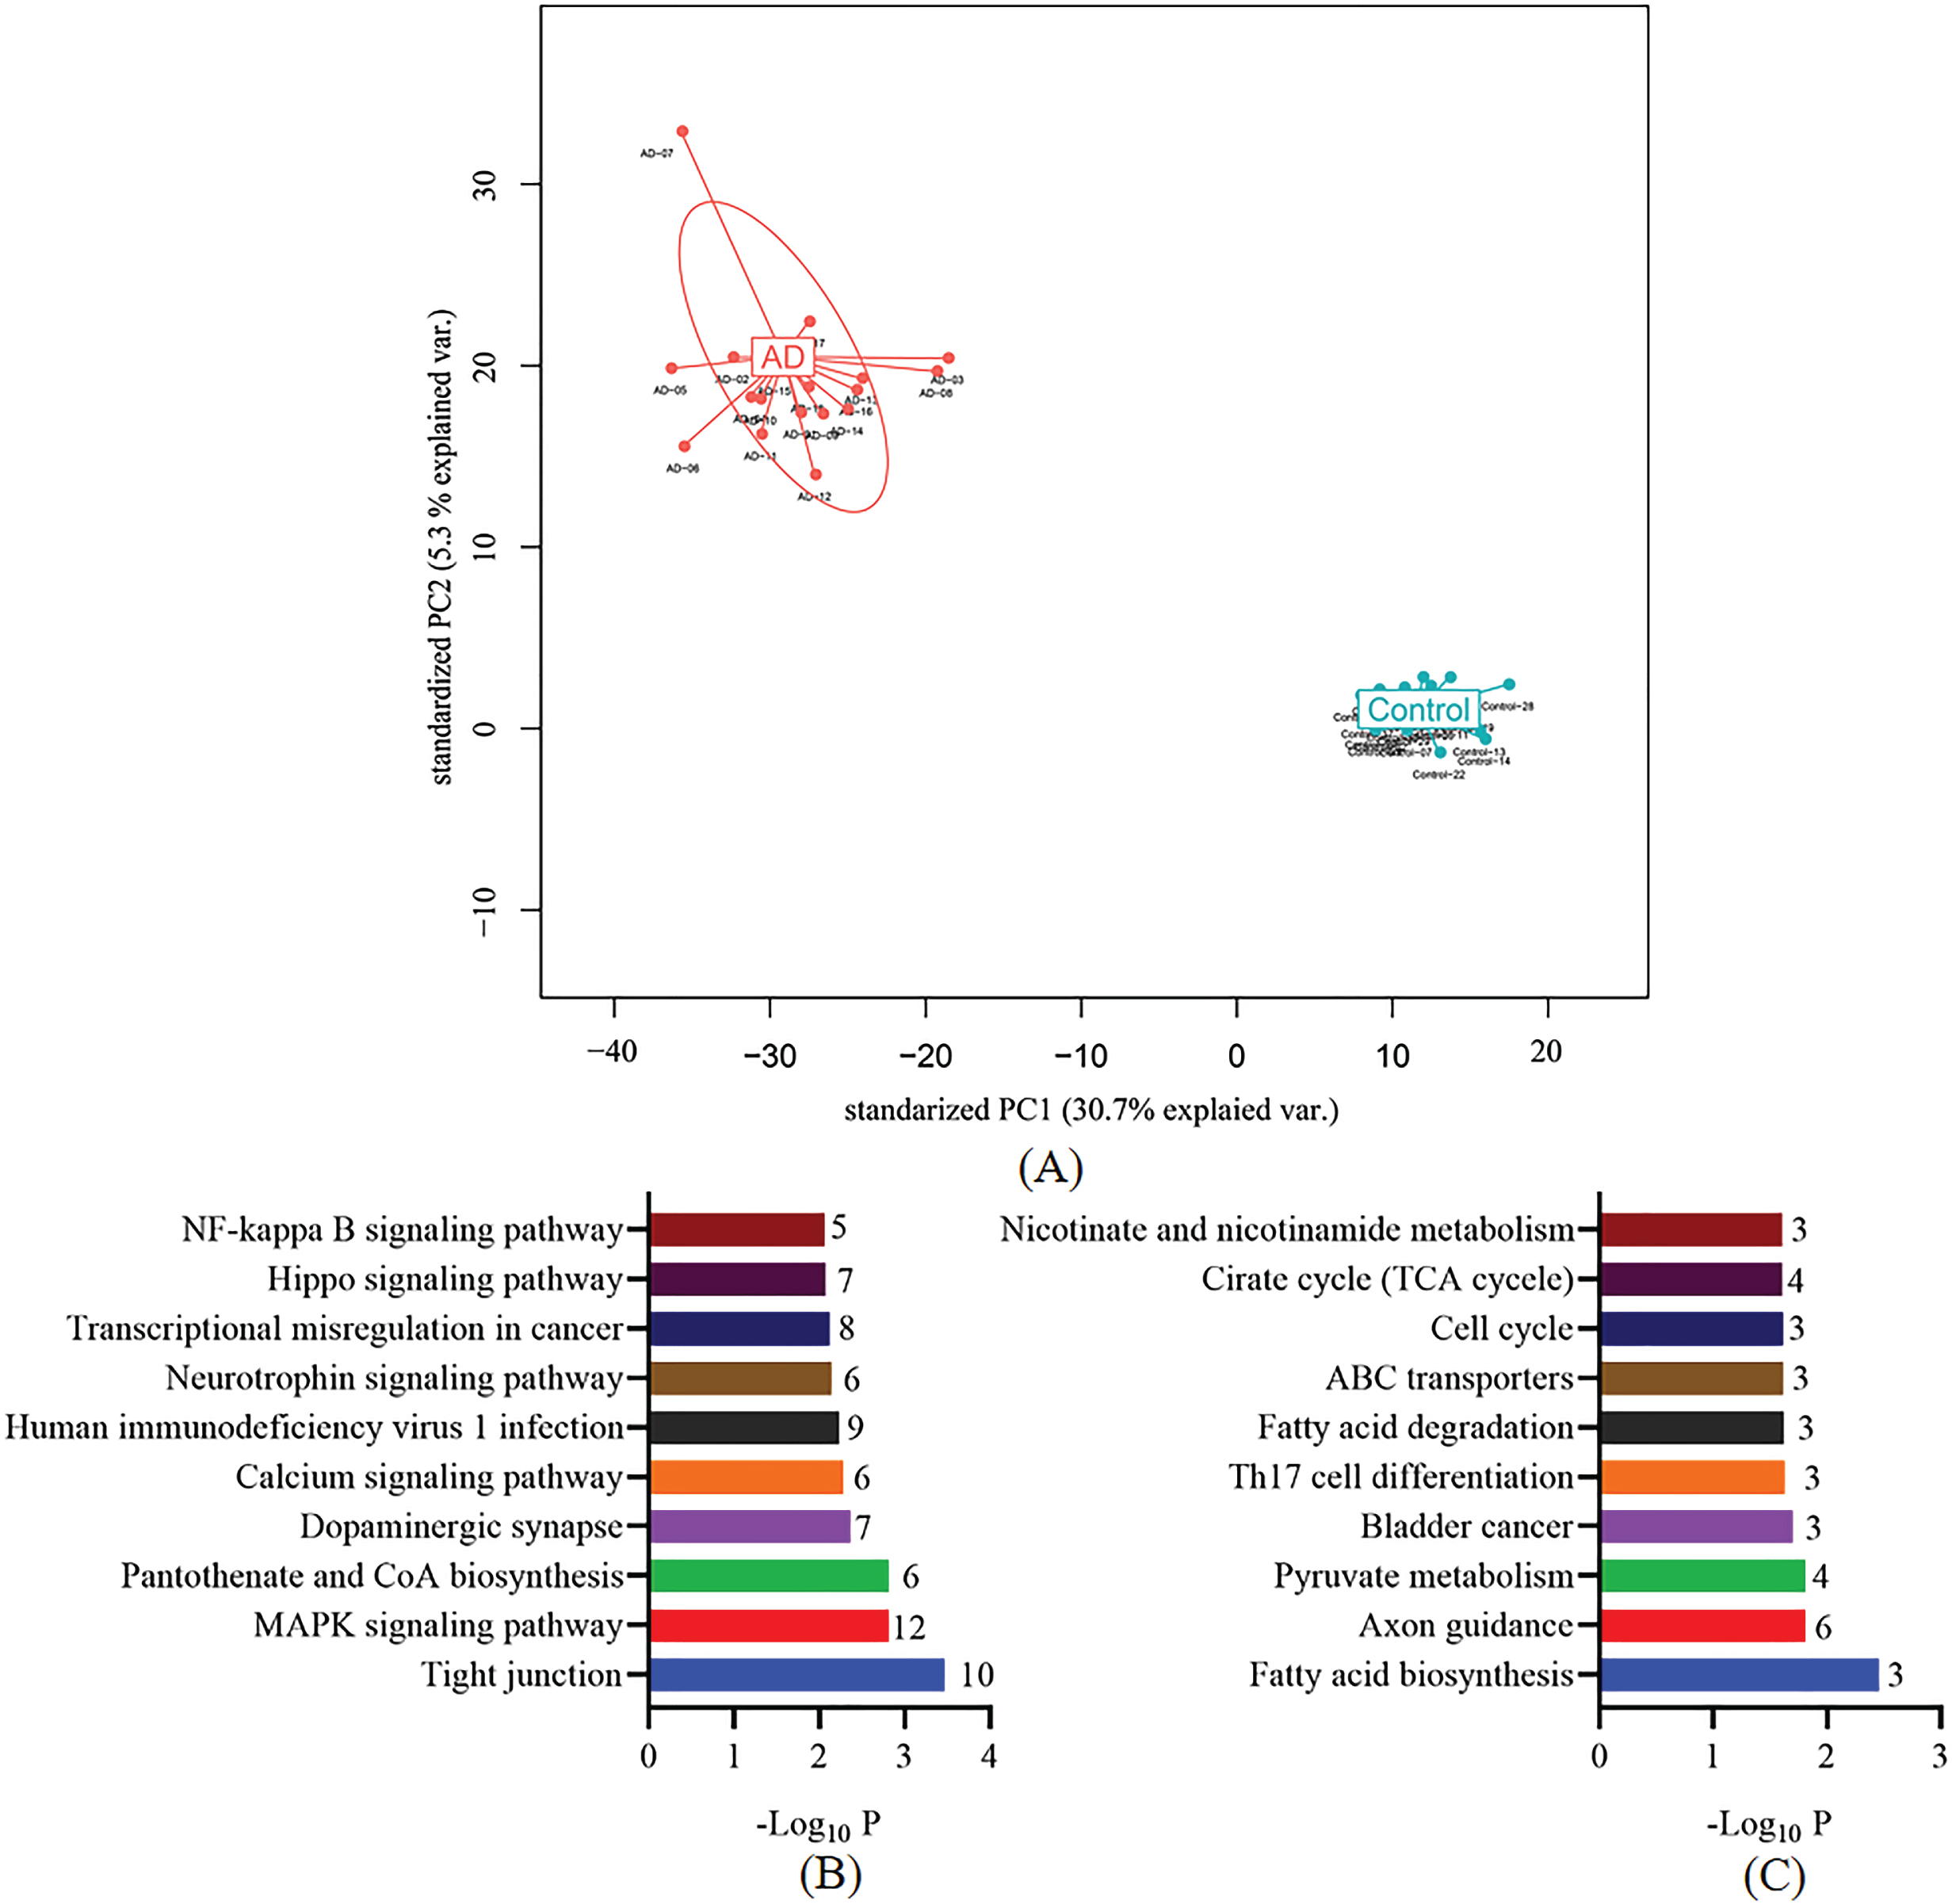
Performance of potential cfDNA 5hmC for identification of AD patients and control individuals. A) Principle component analysis (PCA) plot of 5hmC FPKM in cfDNA from AD and control samples. B) KEGG enrichment analysis of DhMRs annotated genes with significant 5hmC increase in AD samples. C) KEGG enrichment analysis of DhMRs annotated genes with significant 5hmC decrease in AD samples.
Correlations of DhMRs with the MMSE and MoCA scores
As shown in Supplementary Table 2, after correction for multiple testing (q < 0.05), we identified 20 DhMRs and annotated to 19 distinct genes (2 hypo-hydroxymethylated, 17 hyper-hydroxymethylated). Of these, many genes are well known to be associated with AD-related pathologic processes such as DNA damage, apoptosis, tau phosphorylation, neuronal plasticity, and mitochondrial function. We further assessed the ability of these 19 genes to classify dementia in AD patients with available clinical results. We analyzed the correlation between these 19 genes and MMSE, MoCA, ADCS-ADL, and NPI-C scores, respectively (Supplementary Table 3). As shown in Fig. 3, the top 5 genes that were significantly negatively correlated with MMSE and MoCA scores were RABEP1, CPNE4, DNAJC15, REEP3, and ROR1 (r < –0.6, p < 0.001). Compared with the controls, the 5hmC level of these 5 genes (RABEP1, CPNE4, DNAJC15, REEP3, and ROR1) in cfDNA were significant higher in AD patients (Fig. 4A–E, all p < 0.01). In additional, we also found that other 4 genes (CAMK1D, EFNA5, PBRM1, and CCDC141) were negatively correlated with MMSE scores (r< -0.6, p < 0.005) and MoCA scores (r < –0.6, p < 0.01) in male participants. As shown in Supplementary Table 3, it is interesting to note that CAMK1D was positively correlated with ADCS-ADL scores in male AD patients (r = 0.731, p = 0.0396), while negatively correlated with which in female AD patients (r = –0.632, p = 0.0498). An ROC curve was plotted to evaluate the diagnostic performance of the identified genes. As shown in Fig. 4F, the AUC of RABEP1, CPNE4, DNAJC15, REEP3, and ROR1 was 0.921 (sensitivity was 94.4%, specificity was 87.5%), 0.898 (sensitivity was 77.8%, specificity was 87.5%), 0.905 (sensitivity was 88.9%, specificity was 83.3%), 0.940 (sensitivity was 77.8%, specificity was 100.0%), and 0.912 (sensitivity was 88.9%, specificity was 83.3%), respectively. These results indicated that abnormal 5hmC level of the 5 genes in cfDNA might have diagnostic accuracy to distinguish AD patients from cognitively normal subjects.
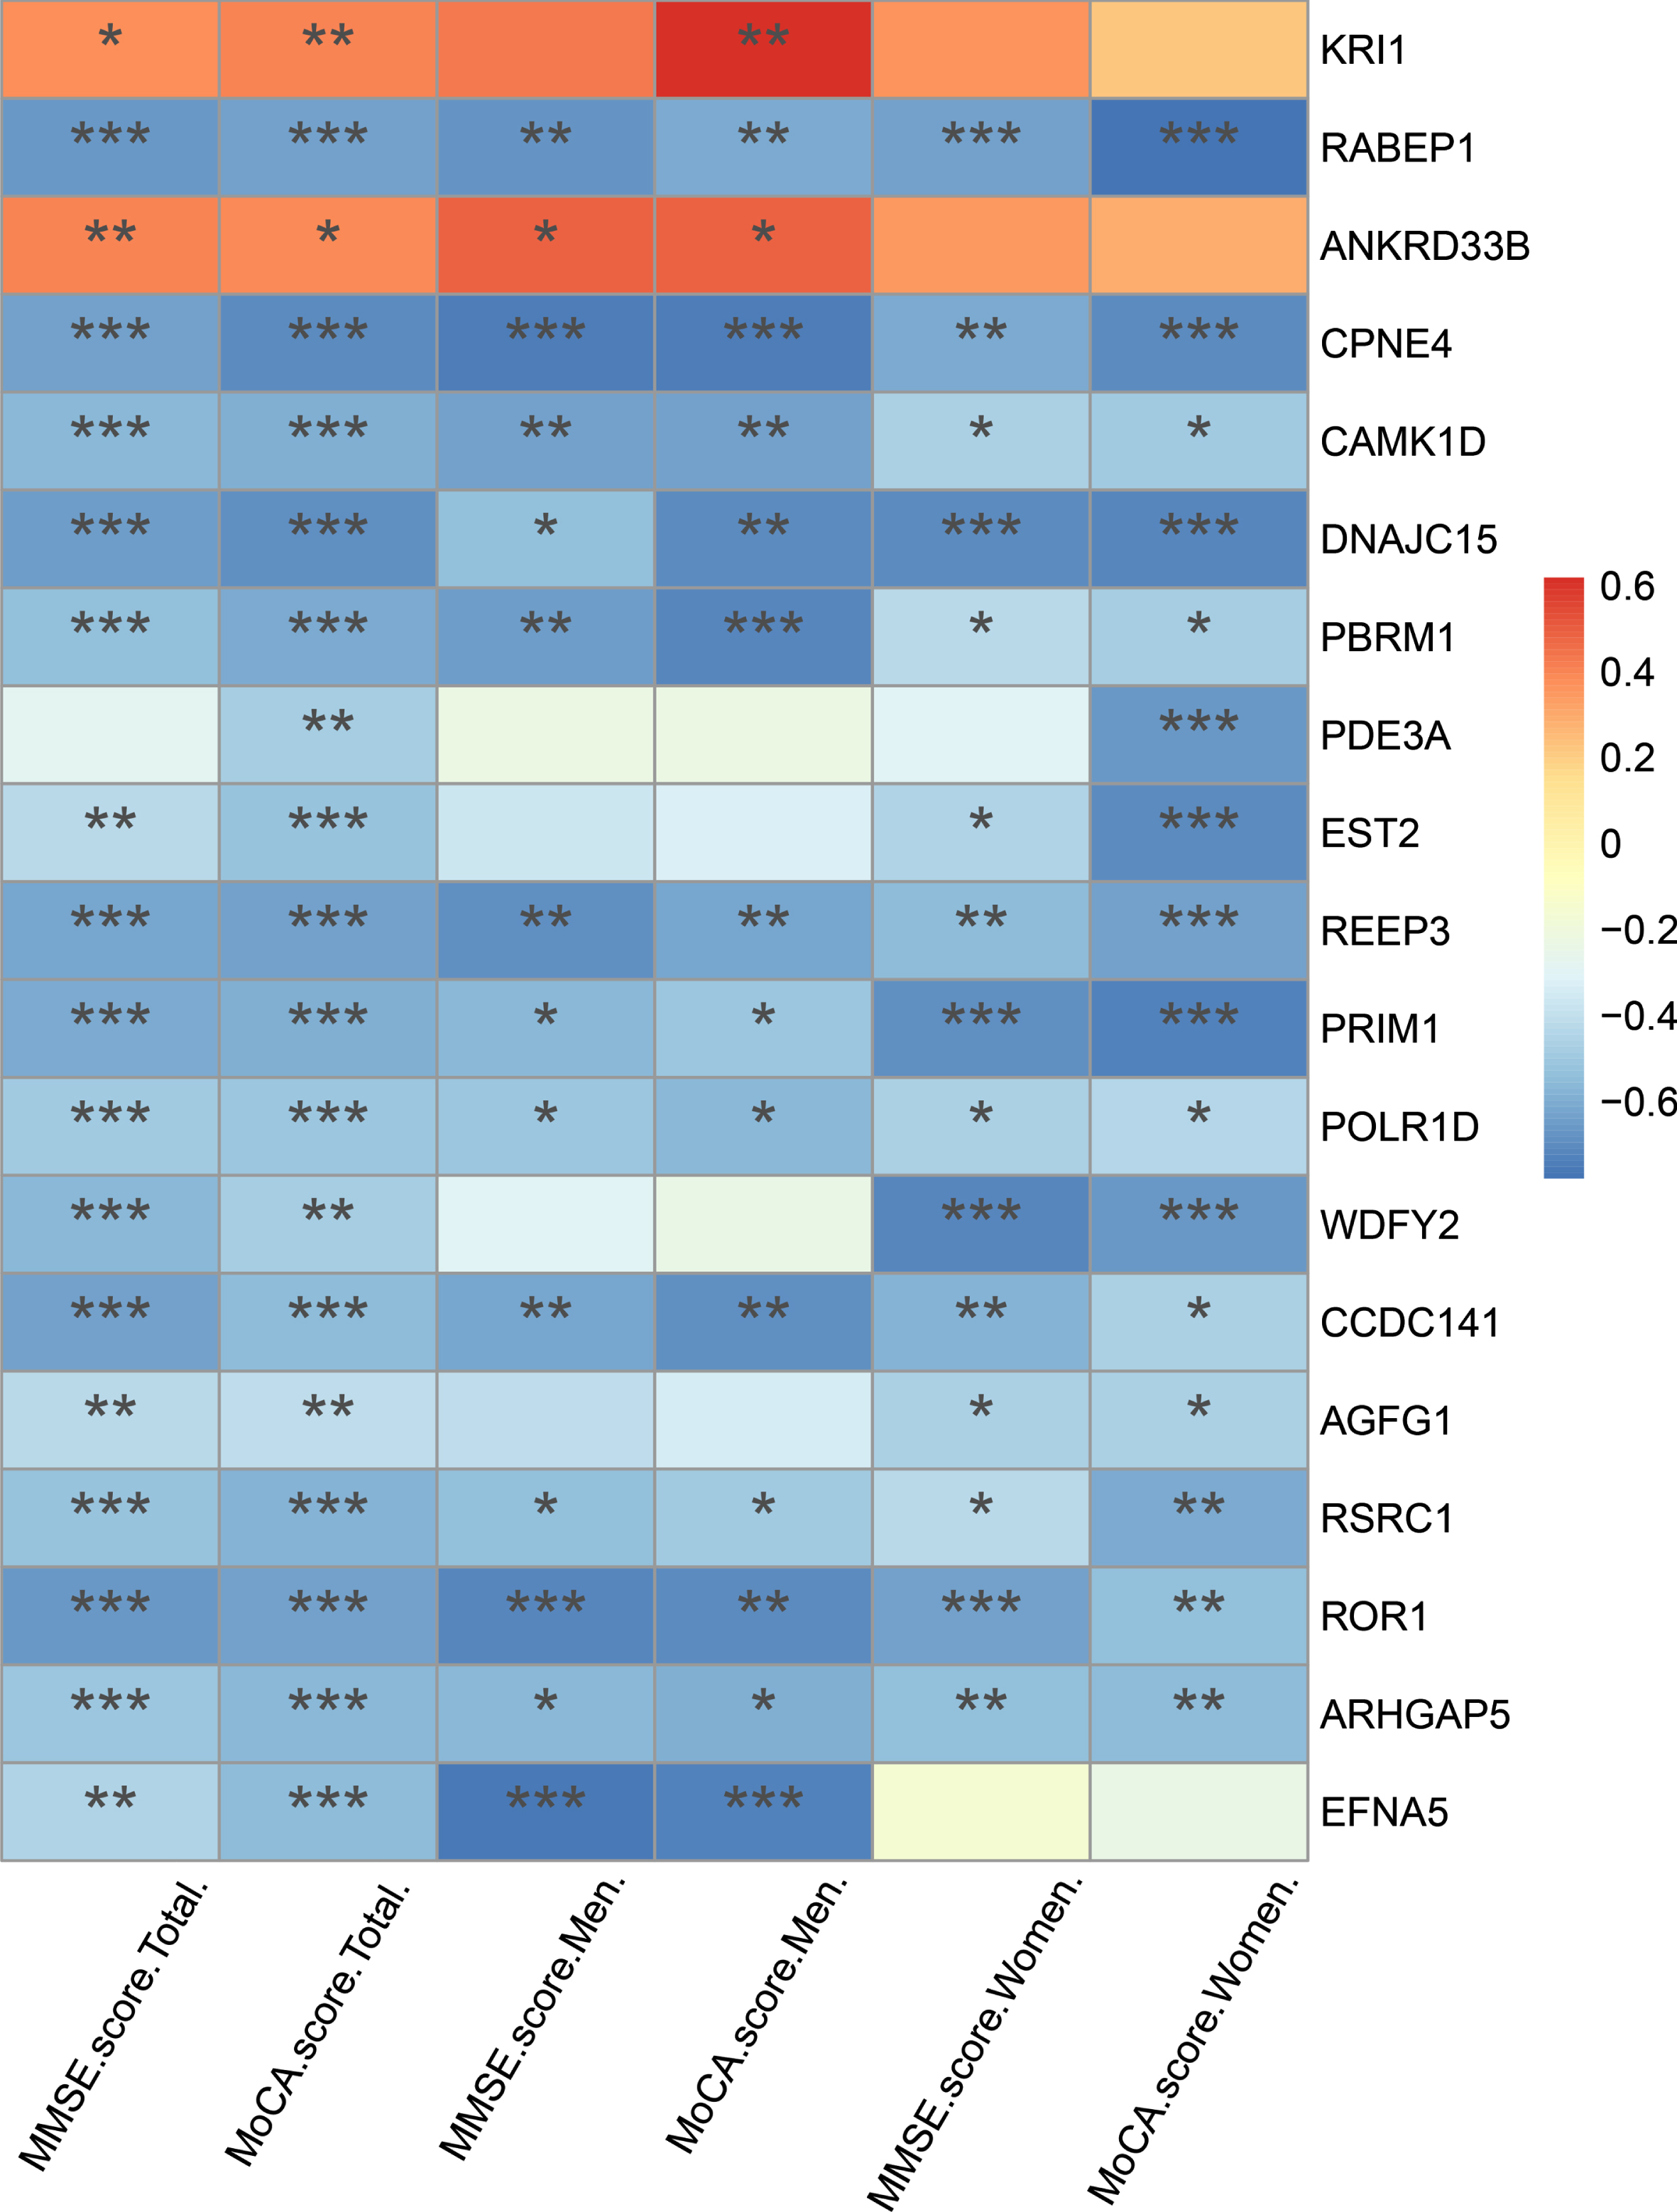
Correlation of DhMRs annotated genes with MMSE and MoCA score in AD patients. *p < 0.05, **p < 0.01, ***p < 0.001.
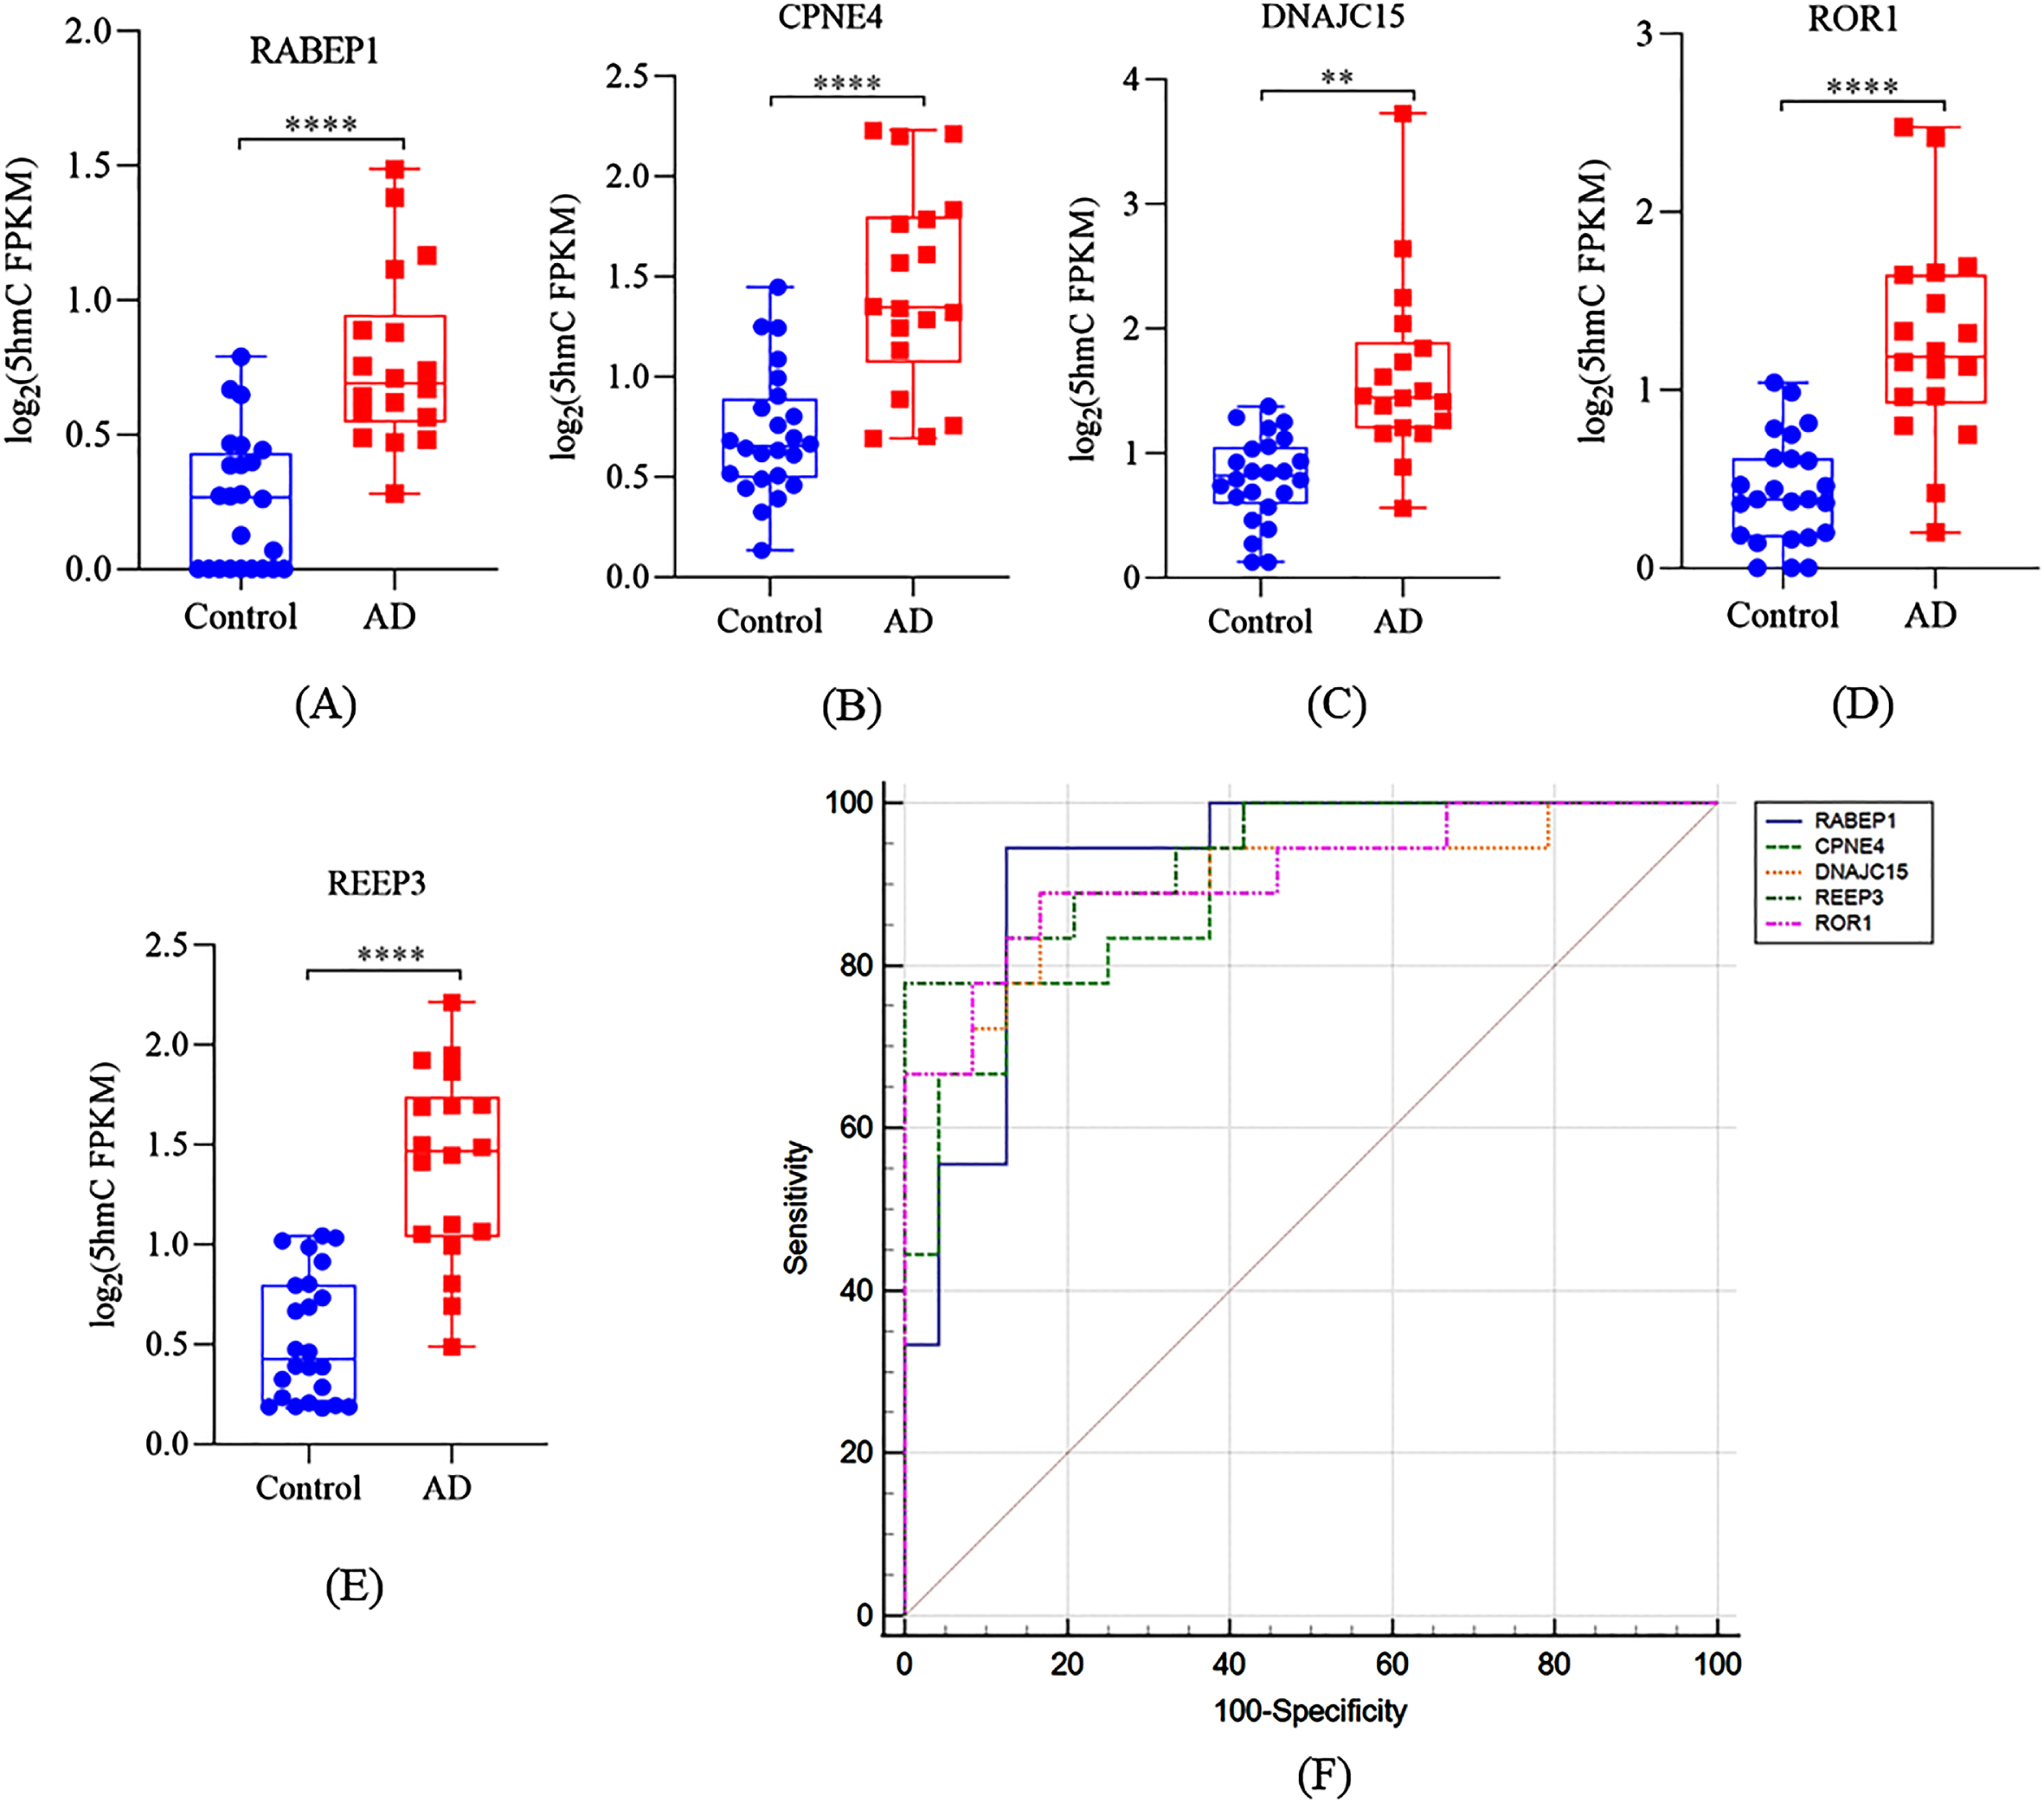
Performance of distinct genes for diagnosis and prediction of AD. Boxplots of (A) RABEP1, (B) CPNE4, (C) DNAJC15, (D) ROR1, and (E) REEP3 5hmC FPKM in cfDNA samples. E) A receiver operating characteristic curve for AD patients based on 5hmC level of RABEP1, CPNE4, DNAJC15, ROR1, and REEP3. **p < 0.01, ***p < 0.001, ****p < 0.0001.
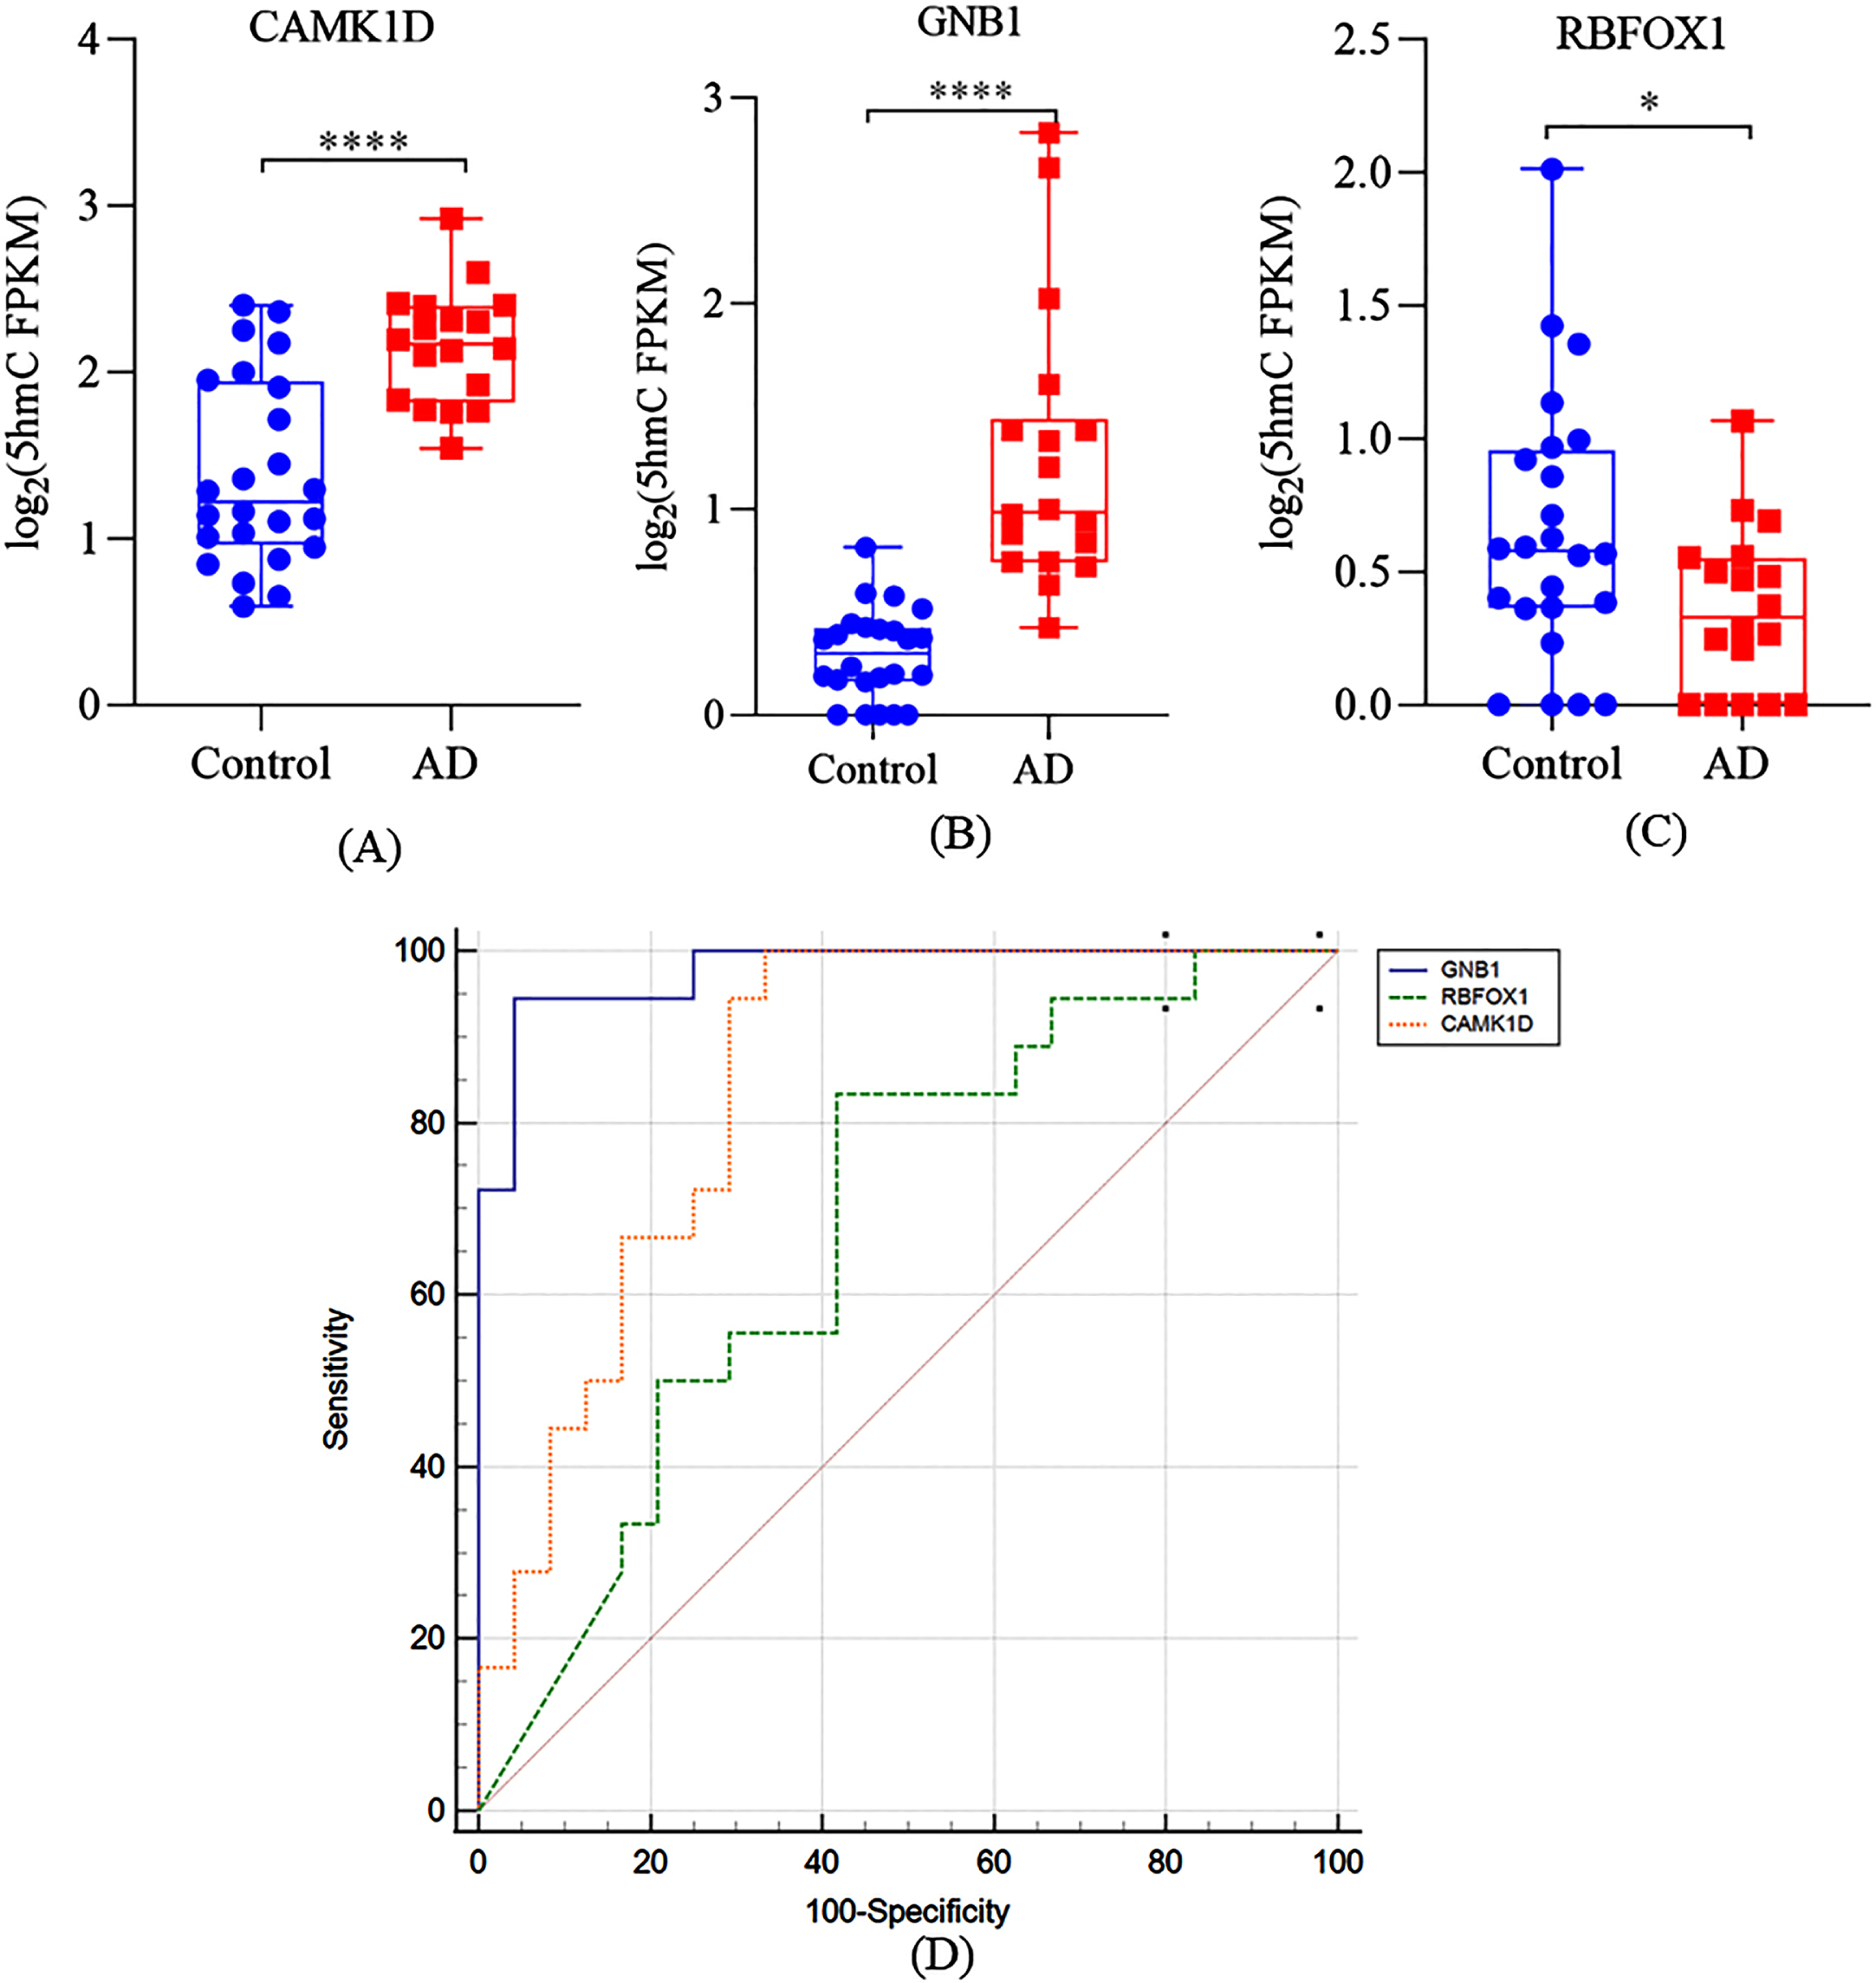
Cell-free 5hmC for diagnosis and prediction of AD. Boxplots of (A) CAMK1D, (B) GNB1, and (C) RBFOX1 5hmC FPKM in cfDNA samples. D) A receiver operating characteristic curve for AD patients based on 5hmC level of CAMK1D, GNB1, and RBFOX1. *p < 0.05, ****p < 0.0001.
Identified DhMRs in cfDNA compared with those detected in postmortem brain from AD patients
It is important to verify the consistency between the DhMRs detected in cfDNA and postmortem brain of AD patients. However, there were not many studies on DNA 5hmC associated with AD in patients, mostly studies examined the total level of 5hmC in AD brain by immunohistochemistry methodology, only one study utilized the same method as we did to detected the genome-wide profile of brain 5hmC at specific locus. Therefore, we compared our results with Zhao’s results and found 14 DhMRs that were both detected in cfDNA in our study and dorsolateral prefrontal cortex tissue of AD patients [15]. As shown in Table 2, 13 DhMRs were associated with neuritic plaques (NP) and 3 DhMRs were associated with neurofibrillary tangles (NFTs). These DhMRs annotated to 11 NP-related genes and 3 NFTs-related genes, respectively, with CAMK1D and RBFOX1 being associated with NP and NFTs. Next, we further analyzed the correlation between these 13 genes and MMSE, MoCA, ADCS-ADL, or NPI-C scores, respectively. As shown in Table 4, we found that only GNB1 was negatively correlated with the MMSE scores (r = –0.682, p < 0.001) and MoCA scores (r = –0.732, p < 0.001) of total participants. However, no significant correlations were observed between GNB1 and ADCS-ADL or NPI-C scores in AD patients (p > 0.05, Table S4). Similar to CAMK1D, RBFOX1 was positively correlated with the MMSE scores (r = 0.714, p < 0.001) and MoCA scores (r = 0.635, p < 0.01) of male participants. However, no significant correlations were observed between RBFOX1 and ADCS-ADL or NPI-C scores in AD patients (all p > 0.05). Compared with the controls, the 5hmC level of CAMK1D and GNB1 in cfDNA in AD patients were significant higher in AD patients (Fig. 4A, B, p < 0.001), while the 5hmC level of RBFOX1 in cfDNA was significant lower in AD patients (Fig. 4C, p < 0.05). The AUC of GNB1, CAMK1D, and RBFOX1 was 0.977 (sensitivity was 94.4%, specificity was 95.8%), 0.850 (sensitivity was 100.0%, specificity was 66.7%), and 0.683 (sensitivity was 83.3%, specificity was 58.3%), respectively. These results further indicated that the 5hmC level of some AD-related genes (like CAMK1D) can be detected both in cfDNA of plasma and brain of AD patients, which may have significant potential as a non-invasive liquid biomarker of AD.
DISCUSSION
cfDNA in the circulating blood originates from dying cells from different tissues, which release DNA into the peripheral bloodstream upon degradation after cell death [16]. Growing evidence showed that a diagnostic model based on 5hmC profile of cfDNA showed the potential to assisted clinical diagnosis in various types of cancers and cardiovascular diseases [17, 30]. However, the possible role of 5hmC in cfDNA for detecting of AD has not yet been reported till now.
DhMRs both detected in cell-free DNA and dorsolateral prefrontal cortex tissue of AD patients
NP, neuritic plaques; NFTs, neurofibrillary tangles.
AD is characterized by brain atrophy associated with apoptosis of synapses and neuros [31]. Thus, the proportion of cfDNA which released into peripheral blood from synapses and neuros are increases along with the degenerating process, giving increase possibility by which to discriminate the biological and clinical variation of AD by cfDNA. This hypothesis was in agreement with a marked increase of neuro-specific RNA in the peripheral blood of AD subjects [32], as well as a significant increase of cfDNA content in the peripheral blood of the patients with brain injury [19]. However, conventional epigenomic profiling approaches, such as bisulfite conversion based methods, were limited with cfDNA degradation and content, and they cannot distinguish 5hmC from 5mC. Hence, we utilized a selective chemical labeling strategy of hmC-Seal sequencing method for detecting 5hmC, which was optimized for genome-wide 5hmC mapping in as low as approximately 3–5 ng cfDNA from only a few milliliters of plasma [20]. Taking advantage of this method, we implemented a case-control study to detected 5hmC signatures of cfDNA in AD cases and cognitively normal controls, so as to try to uncover a potential non-invasive reliable diagnostic biomarkers for AD.
In this study, our primary aim was to evaluate whether 5hmC in cfDNA could distinguish AD patients from age-matched cognitively normal controls. First, we observed significant difference of cfDNA 5hmC profiles between AD patients and the controls (Fig. 1). To date, there were only 11 available studies examining DNA hydroxymethylation associated with AD in postmortem human brains [6]. Notably, most of them examined genome wide levels of 5hmC using immunohistochemistry methodology, and the results were inconsistent with some studies reporting decreased [12] whereas others showing increased [14] or no changes [33] in global 5hmC level in AD patients compared with controls, probably due to the small sample size and the samples from different stages of AD. Only 2 papers utilized the next generation sequencing to detected the genome-wide profile of brain 5hmC at cortex tissue of AD patients, and they both found the majority of DhMRs had an increased in 5hmC located in intragenic regions of the brains in AD patients [15, 25], which was consistent with our findings (Fig. 1). Second, our results indicates that AD patients can be well distinguished from cognitively normal individuals by DhMRs (Fig. 2A). Especially, we found that DhMRs annotated genes mainly distributed in AD pathogenesis related pathways including tight junction [34], metabolic related pathway (MAPK signaling pathway, pyruvate metabolism, and TCA cycle) [35], fatty acid homeostasis (biosynthesis and degradation) [36], axon guidance, and neurotrophin signaling pathway (Fig. 2B, C). Moreover, these genes are enriched for GO cellular component such as metabolic process, and cytoskeleton, indicating functional relevance of these genes to AD pathology. Overall, our results suggest that abnormal hydroxymethylation profile of cfDNA may provide a new strategy for early non-invasive liquid diagnosis of AD.
After correction for multiple testing (q < 0.05), we identified 5 genes including RABEP1, CPNE4, DNAJC15, REEP3, and ROR1 negatively correlating with MMSE and MoCA scores, and the AUC of which suggesting a good performance on the diagnosis of AD (Fig. 3). These distinct genes have been shown to be related to AD pathology in previously studies [37, 38]. For example, RABEP1, involved in endocytic membrane fusion and membrane trafficking, was identified to be associated with increased AD risk in a recent genome-wide association study [37]. Furthermore, genome-wide association studies have identified that RABEP1 is one of the AD candidate causal genes [39]. CPNE4 encodes copine IV, a calcium-dependent membrane-binding protein highly expressed in the brain. The copy number variation (CNV) genome-wide association study identified 5 CNV regions that contribute to the heritability of AD, and 2 CNV events are intragenic causing a deletion in CPNE4. DNAJC15 is an endogenous mitochondrial repressor of the respiratory chain that controls metabolic alterations and response to inflammatory stimuli, the dysfunction of which has been associated with several neurologic disorders [40]. CpG island methylation constitutes the only mechanism identified for the regulation of DNAJC15 gene expression, and the dysregulation of which has been associated with several neurologic disorders [41]. ROR1 plays an important role in regulating neurite extension, synapse formation, and synaptic transmission of hippocampal neurons [42]. Furthermore, we also found that 12 DhMRs annotated genes were both detected in cfDNA and postmortem AD brain (Table 3), especially CAMK1D and RBFOX1 were both associated with NP and NFTs. CAMK1D is involved in modulating neuronal development and plasticity and late-onset AD pathogenesis [43]. RBFOX1 encodes a neuronal RNA-binding protein known to be expressed in neuronal tissues and involved in the pathogenesis of AD. Nominal association signals in RBFOX1 were also found in an epigenome-wide association study of abnormal behavior, like anger, conduct disorder, and aggressive behavior [44]. A meta-analysis of amyloid positron emission tomographic imaging data collected on 4,314 participants found that RBFOX1 localized around plaques and reduced expression of RBFOX1 was correlated with higher amyloid-β burden and global cognitive decline during life [45]. In additional, we used a post-hoc analysis was used to investigate whether there existed gender difference concerning the correlation of cfDNA 5hmc with AD. It is interesting to note that CAMK1D was negatively correlated with the MMSE scores and MoCA scores of male participants, which may be related to calcium regulated hormonal secretion [46]. However, RBFOX1 was positively correlated with the MMSE scores and MoCA scores of male participants. Gender-specific associations might result from gene-gene or gene environment interactions. It is possible that men were exposed to an environment that interacts with the RBFOX1 and/or CAMK1D. However, we should be cautious with the explanation of the age stratified results due to the trait of the post hoc analysis and the small sample size. An enlarged sample is needed in further studies to get a more reliable conclusion. Taken together, these results further indicates that the 5hmC level of AD-related genes, such as CAMK1D and RBFOX1, in cfDNA from plasma present a great potential to clinical auxiliary diagnosis of AD.
Correlation analysis of MMSE and MoCA scores with the genes both detected in cell-free DNA and dorsolateral prefrontal cortex tissue
To our best knowledge, this is the first research about genome-wide profiling of 5hmC in cfDNA to evaluate the potential for diagnosis of late-onset AD. Our findings indicates that AD patients can be well distinguished from cognitively normal subjects by 5hmC signatures in peripheral blood cfDNA. Importantly, we identified several genes including RABEP1, CPNE4, DNAJC15, REEP3, ROR1, CAMK1D, and RBFOX1with predicting diagnostic potential based on their significant correlations with MMSE and MoCA scores of the participants. Especially, the abnormal 5hmC level of CAMK1D and RBFOX1 identified in brain tissues of AD patients in previous [15] were also detected in peripheral blood cfDNA in our study. Taken together, our study provides a new strategy for developing non-invasive peripheral diagnostic biomarkers for late-onset AD.
It is also important to note the limitations of our study. First, similar as most studies that identify AD biomarkers by epigenetic [4, 47], our sample size is relatively small, and thus our results should be considered as a proof of concept rather than conclusive.
However, we calculated the needed sample size before the study, and the included participants could meet the need of the statistical power. Second, the origin of cfDNA is complex and remains poorly understood to date. Although the proportion of the cfDNA which released into blood from apoptotic and necrotic synapses and neuros are increased, it may still be confounded by various cells from different tissues. Thus, our results could be confounded by cellular heterogeneity inherent. Hence, the profile of brain region-specific and/or neuro-specific cfDNA 5hmC should be investigated in future research. Finally, we cannot make a convincing causal interpretation due to the case-control design. However, the significant correlation between the identified genes and cognitive scale scores, as well as the fine diagnostic performance indicated in the preliminary ROC analysis make us be confident of the clinical auxiliary diagnosis for AD.
Conclusion
In summary, our results suggest that 5hmC signatures of plasma cfDNA can be served as effective biomarkers for non-invasive diagnosis of late-onset AD. Building on our study, prospective cohort study in AD population of larger sample size with longitudinal follow-up and sampling over several decades to establish the causality between 5hmC signatures and the onset and progress of AD are warranted in the future.