
Abstract
Background:
Individuals with subjective cognitive decline (SCD) are hypothesized to be the earliest along the cognitive continuum between healthy aging and Alzheimer’s disease (AD), although more research is needed on this topic. Given that treatment approaches may be most effective pre-clinically, a primary objective of emerging research is to identify biological markers of SCD using neuroimaging methods.
Objective:
The current review aimed to comprehensively present the neuroimaging studies on SCD to date.
Methods:
PubMed and PsycINFO databases were searched for neuroimaging studies of individuals with SCD. Quality assessments were completed using the Appraisal tool for Cross-Sectional Studies.
Results:
In total, 62 neuroimaging studies investigating differences between participants with SCD and healthy controls were identified. Specifically, the number of studies were as follows: 36 MRI, 6 PET, 8 MRI/PET, 4 EEG, 7 MEG, and 1 SPECT. Across neuroimaging modalities, 48 of the 62 included studies revealed significant differences in brain structure and/or function between groups.
Conclusion:
Neuroimaging methods can identify differences between healthy controls and individuals with SCD. However, inconsistent results were found within and between neuroimaging modalities. Discrepancies across studies may be best accounted for by methodological differences, notably variable criteria for SCD, and differences in participant characteristics and risk factors for AD. Clinic based recruitment and cross-sectional study design were common and may bias the literature. Future neuroimaging investigations of SCD should consistently incorporate the standardized research criteria for SCD (as recommended by the SCD-Initiative), include more details of their SCD sample and their symptoms, and examine groups longitudinally.
INTRODUCTION
Globally, dementia affects roughly 43.8 million older adults [1]. One of the most common forms of dementia includes Alzheimer’s disease (AD), an incurable neurodegenerative disorder that accounts for 60–70% of all dementia cases [2]. Currently, the disease-modifying treatments for AD aim to prevent symptom progression. However, much of this research has been focused on treating patients with amnestic mild cognitive impairment (aMCI) or AD itself who have already experienced significant neurodegeneration that has impacted their cognition and ability to carry out instrumental activities of daily living. In light of this, one objective of emerging research in AD has shifted towards identifying pre-clinical biomarkers in individuals at risk for developing AD. Broadly, the goal of the emerging research is to find a way of identifying individuals who will later develop AD before significant neurocognitive symptoms develop; a time point which is believed to be the period during which disease-modifying treatments are most effective [3–5].
More recently, some studies in pre-clinical AD have begun to examine individuals with subjective cognitive decline (SCD). Individuals with SCD have been conceptualized as the group showing the earliest signs of decline on the cognitive continuum towards AD (i.e., between healthy aging and MCI) [6]. In 2014, an international working group on SCD was formed to propose a framework for research on SCD [6]. Specifically, Jessen et al. [6] describe individuals with SCD to self-report a decline in their own cognitive abilities, but these self-reports are not corroborated by impaired performance on neuropsychological assessment measures. Instead, these individuals perform within normal limits on these measures [6]. Within the literature, healthy controls (HC) are essentially the same as those with SCD, in terms of demographics and normal performance on neuropsychological assessment; the main difference between these two groups is the subjective report of cognitive decline.
In 2017, Molinuevo and colleagues of the SCD-Initiative [7] published a research article providing recommendations for operationalizing SCD and implementing the SCD criteria in research studies as outlined by Jessen et al. [6]. Notably, Jessen and colleagues [6] recognize that the experience of SCD is not specific to preclinical AD. In fact, SCD may be experienced for a variety of reasons such as normal aging, psychiatric conditions, other neurological conditions, the impact of substance use, or from medications. In recognition of these different causes of SCD, Jessen et al. [6, 8] have outlined additional criteria known as SCD-plus, which represents additional features of SCD that signal a higher risk of future development of AD. Such risk factors include but are not limited to concern of experiencing SCD, onset of SCD at age 60 years or older, persistence of SCD over time, and seeking medical attention for these symptoms [8]. Despite the creation of the research framework for SCD, advancement in SCD research has not progressed as rapidly as other areas of dementia research. This stalled progression may be attributed to a lack of common terminology and research standards across studies [9].
Being able to differentiate between those with SCD relative to HC is important but inherently difficult, given that individuals with SCD demonstrate normal levels of cognitive functioning as measured on neuropsychological assessment measures. As paper-and-pencil neuropsychological assessment measures are unable to differentiate between those with SCD and healthy individuals, there is a distinct need for brain-based biomarkers within the SCD group that could signal future risk of developing AD.
Given that biomarkers have potential to advance the diagnosis of AD, the NIA-AA released revised guidelines on the diagnosis of AD to include pathological criteria in addition to clinical observations [10, 11]. Currently, the diagnostic criteria for AD has integrated three different categories of biomarkers, including 1) accumulation of amyloid-β (Aβ) plaques or associated pathologic state (as measured by amyloid positron emission tomography (PET) imaging, low cerebrospinal fluid (CSF) Aβ42, or CSF Aβ40/Aβ42 ratio), 2) accumulation of tau tangles or associated pathologic state (measured by tau PET or CSF phosphorylated tau (P-tau), and 3) neuronal injury or neurodegeneration (measured by structural magnetic resonance imaging (MRI), fluorodeoxyglucose (FDG) PET, or CSF total tau (T-tau)) [12]. Although not included in this research framework of AD, a multitude of different neuroimaging techniques have been used to study disease progression of AD. These methods include other MRI metrics (i.e., functional MRI (fMRI), diffusion-tensor imaging (DTI), etc.), electroencephalography (EEG), magnetoencephalography (MEG), and multi-modal methods incorporating a combination of neuroimaging techniques. Although these techniques are not included in the NIA-AA criteria, they may be especially relevant moving forward because MRI and EEG are widely available and thus ecologically relevant to clinicians and researchers compared to techniques such as PET which are often only available at major medical centers.
Importantly, a main thrust of biomarker research has focused on applying neuroimaging techniques to better understand brain-based changes in individuals with SCD relative to HC. Therefore, the major objectives of the current systematic review are: to comprehensively present the neuroimaging studies on SCD to date, to synthesize findings across studies and imaging modalities, and to identify steps for future research that will move this field forward. In the context of these aims, the current review sought to address four specific questions based on the current literature: 1) Can differences be detected between individuals with SCD and HC using a variety of neuroimaging methods?; 2) Are the detected differences consistent within each neuroimaging technique?; 3) Are the regions (structural and functional) affected in SCD consistent with those expected in early-stage AD?; and 4) Are there methodological characteristics/differences between the studies that could impact the findings?
METHODS
Eligibility criteria
English-language, peer-reviewed, human studies, that reported original research with full-text availability were considered eligible for inclusion. Additional inclusion criteria based on the research topic included the necessity of an SCD group (or equivalent condition group). It should be noted that given the variability in nomenclature prior to the recommendations of the International Working Group of the SCD-Initiative [6], the applied definition of SCD included individuals who were identified within an article to have cognitive complaints of any type (e.g., specific to memory, or more general cognitive complaints) in combination with neuropsychological testing sufficient to confirm that participants were functioning within normal limits. Studies were included when participants were aged 55 years and above, to account for the approximate 15-year timeframe to AD conversion that has been proposed [13]. Studies with a lower minimum age were included if they provided age-stratified data with a distinct 55 + age group. Finally, included studies must have included the use of a neuroimaging method, as well as an observational study design (no intervention studies were included). The review protocol for this study was registered with PROSPERO (CRD 42021235940).
Search strategy
PubMed and PsycINFO databases were searched using a combination of relevant keywords agreed upon by the authors (see the Supplementary Material for search terms in full). Following an initial screen to exclude ineligible articles and duplicates, the suitability of each article was independently adjudicated by two of the authors (two of AP, LO, VS, JRG). Where there was disagreement between the initial raters, the third author’s rating determined whether a given study was included.
Data analysis and synthesis
Studies were organized according to the neuroimaging methods employed: MRI (including anatomical MRI, DTI, fMRI, and multi-modal MRI), PET, SPECT, EEG, MEG, and multi-modal neuroimaging combining MRI and PET. For each study, the term/construct of interest (e.g., SCD, subjective memory impairment, subjective cognitive complaints, etc.), number of participants, mean sample age, mean sample education, number of males and females, prevalence of APOE ɛ4, recruitment source, and results relevant to SCD are tabulated.
Study quality ratings
Each study was also rated (by one of AP, LO, VS, CMS, JRG) for quality using the Appraisal Tool for Cross Sectional Studies (AXIS) tool [14], to evaluate risk of bias, study design quality, and quality of reporting. The AXIS tool is comprised of 20 questions and was not designed to yield a total quality score out of 20 as each item cannot be weighted equally [14]. We assessed and interpreted items individually to evaluate each study’s overall quality [14]. Although the AXIS tool [14] is designed to be used with cross-sectional studies, to maintain consistency we also used this scale when rating the quality of longitudinal studies.
RESULTS
Systematic review
The search was conducted on February 14, 2021. Initial search results yielded 619 studies, with 395 articles from PubMed and 224 articles from PsycINFO. Following manual removal of duplicates and evident irrelevant entries (e.g., meta-analyses, intervention studies), 505 abstracts were reviewed for inclusion and exclusion criteria. Following this initial review and manual retrieval of known articles that fit inclusion criteria, 296 full text articles were identified for more in-depth review. After the review of each article by two authors, discrepancies between authors were found for 82 articles. The nature of these 82 discrepancies pertained to correlational studies investigating severity of SCD symptoms in relation to neuroimaging, studies lacking a distinct HC group apart from those with SCD, and studies where the outcomes were focused on creation of novel methods. All discrepancies were successfully reconciled by a third reviewer who was not involved in the initial rating of that article. The exclusions primarily resulted from an undefined SCD group (e.g., lack of discrimination between those with SCD and MCI) or lack of reporting on neuroimaging biomarkers (e.g., reporting of cerebrospinal fluid biomarkers). Results of this process are summarized in Fig. 1 using the PRISMA Flow Diagram [15]. A list of the articles excluded from this review is provided in the Supplementary Material. A final sample of 62 articles published between 2010 and 2021 were included in the final review.
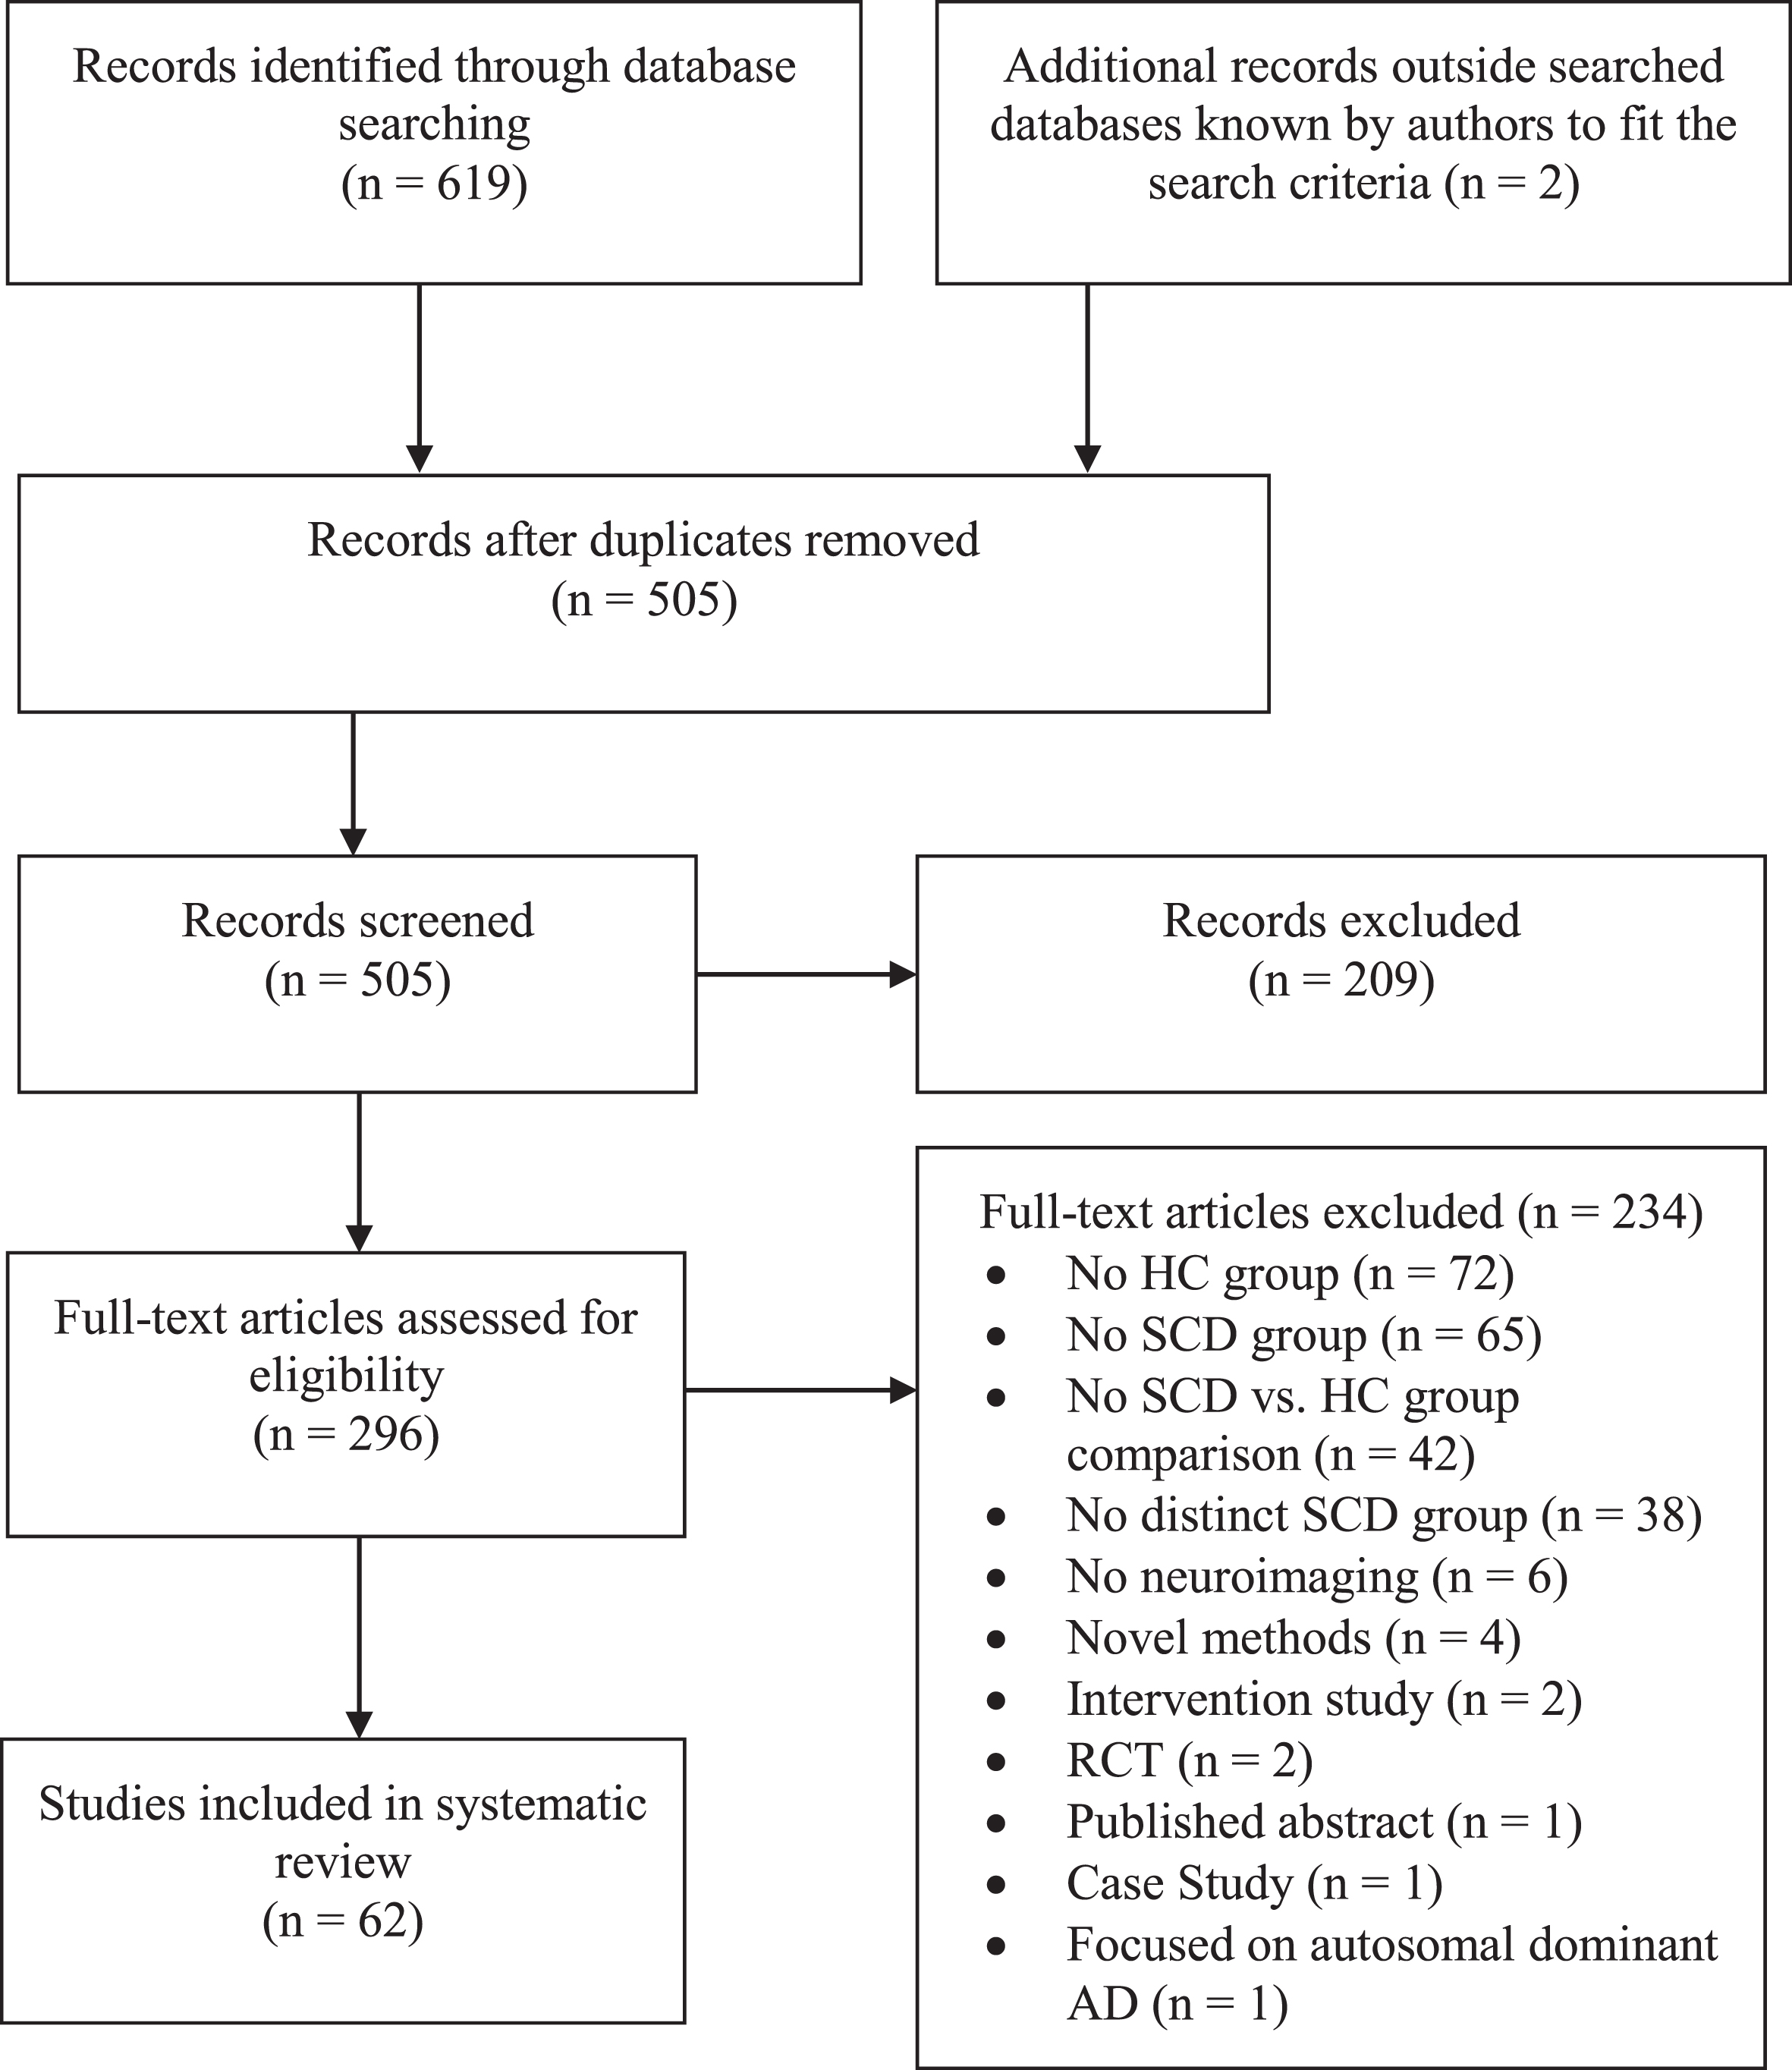
PRISMA flow diagram for the current systematic review.
Table 1 shows the number of studies included in each neuroimaging modality. Table 2 provides brief descriptions of each neuroimaging technique as well as an overarching summary of the results. Grouped by neuroimaging modality, Tables 3–11 present more detailed information on each study including details on the participant sample and relevant SCD results for each included article. Table 12 shows a count of the significant and non-significant findings separated by neuroimaging modality considering the studies that incorporated multiple neuroimaging modalities.
Summary of neuroimaging modalities used in the articles included (n = 62)
DTI, diffusion tensor imaging; EEG, electroencephalography; fMRI, functional magnetic resonance imaging; MEG, magnetoencephalography; MRI, magnetic resonance imaging; PET, positron emission tomography; SPECT, single-photon emission computed tomography
Description of brain imaging modalities and summary of results
DTI, diffusion tensor imaging; EEG, electroencephalography; fMRI, functional magnetic resonance imaging; MEG, magnetoencephalography; MRI, magnetic resonance imaging; PET, positron emission tomography; SPECT, single-photon emission computed tomography
Sample characteristics and results of anatomical MRI studies (n = 11)
Bold text denotes statistical significance found between SCD and HC groups; 1SCD non-progressors; 2SCD progressors; 3Recruited from the community; 4Recruited from a clinic; –, not reported; APOE ɛ4, Apolipoprotein E4; CA1, Cornu Ammonis 1; Edu, education; F, female; HC, healthy controls; M, male; MRI, magnetic resonance imaging; SCD, subjective cognitive decline; SD, standard deviation; SNCI, symptoms of memory loss but no objective cognitive impairment; SMI, subjective memory impairment; TIV, total intracranial volume
Characteristics of DTI Studies (n = 6)
Bold text denotes statistical significance found between SCD and HC groups; 1: Only 22 participants (of 36) had information on APOE status; –, not reported; aMCI, amnestic mild cognitive impairment; APOE ɛ4, Apolipoprotein E4, AxD, axial diffusivity; BABRI, Beijing Aging Brain Rejuvenation Initiative; Edu, education; F, female; FA, fractional anisotropy; HC, healthy controls; M, male; MD, mean diffusivity; SCD, subjective cognitive decline; SD, standard deviation; SMI, subjective memory impairment.
Characteristics of fMRI studies (n = 9)
Bold text denotes statistical significance found between SCD and HC groups; 1Recruited from the Indiana Alzheimer’s Disease Center; 2Recruited from the Indiana Memory and Aging Study; 3Range; 4Median; 5Verhage Scale; 𠀓, not reported; APOE ɛ4, Apolipoprotein E4; CC, cognitive complaints; Edu, education; F, female; FC, functional connectivity; HC, healthy controls; M, male; SCD, subjective cognitive decline; SCI, subjective cognitive impairment; SD, standard deviation; SMI, subjective memory impairment.
Characteristics of multi-modal MRI studies (n = 10)
Bold text denotes statistical significance found between SCD and HC groups; 1This study reported 28 participants in the SMI group, but only 19/26 of the participants being female; 2Range; –, not reported; ALFF, amplitude of low-frequency fluctuations; APOE ɛ4, Apolipoprotein E4; BOLD, blood-oxygen-level-dependent; Edu, education; F, female; FA, fractional anisotropy; FC, functional connectivity; HC, healthy controls; M, male; MD, mean diffusivity; SCD, subjective cognitive decline; SCI, subjective cognitive impairment; SD, standard deviation; SMC, subjective memory complaints; SMI, subjective memory impairment; WMH, White Matter Hyperintensity.
Characteristics of PET studies (n = 6)
Bold text denotes statistical significance found between SCD and HC groups; 1Value for the entire study (not just the SCD group); –, not reported; APOE ɛ4, Apolipoprotein E4; CSF, cerebrospinal fluid; Edu, education; HC, healthy controls; F, female; M, male; PET, positron emission tomography; PiB, Pittsburgh Compound B; SCD, subjective cognitive decline; SCI, subjective cognitive impairment; SD, standard deviation; SMC, subjective memory complaints; SUVR, standardized uptake value ratio
Characteristics of multi-modal MRI & PET studies (n = 8)
Bold text denotes statistical significance found between SCD and HC groups; 1Low-PiB subjective cognitive impairment group; 2High-PiB subjective cognitive impairment group; 3SCD recruited from community; 4SCD recruited from clinic; 5APOE ɛ4- group; 6APOE ɛ4 + group; 7at baseline; 8at follow-up; 95th percentile; 1010th percentile; –, not reported; APOE ɛ4, Apolipoprotein E4; Edu, education; F, female; FA, fractional anisotropy; HC, healthy controls; M, male; MD, mean diffusivity; PiB, Pittsburgh Compound B; SCD, subjective cognitive decline; SCI, subjective cognitive impairment; SD, standard deviation; SMC, subjective memory complaints; SMCon, subjective memory concerns; SMI, subjective memory impairment; SUVR, standardized uptake value ratio
Characteristics of EEG studies (n = 4)
Bold text denotes statistical significance found between SCD and HC groups; 1Standard Error; 2Median; –, not reported; APOE ɛ4, Apolipoprotein E4; Edu, education; EEG, electroencephalography; F, female; HC, healthy controls; M, male; SCD, subjective cognitive decline; SD, standard deviation; SMC, subjective memory complaints; SMI, subjective memory impairment
Characteristics of MEG studies (n = 7)
Bold text denotes statistical significance found between SCD and HC groups; –, not reported; APOE ɛ4, Apolipoprotein E4; Edu, education; F, female; FC, functional connectivity; HC, healthy controls; M, male; MEG, magnetoencephalography; SCD, subjective cognitive decline; SD, standard deviation
Characteristics of SPECT studies (n = 1)
Bold text denotes statistical significance found between SCD and HC groups; 1Range; –, not reported; APOE ɛ4, Apolipoprotein E4; Edu, education; F, female; HC, healthy controls; M, male; SCC, subjective cognitive concerns; SCD, subjective cognitive decline; SD, standard deviation; SPECT, single-photon emission computed tomography
Breakdown of significant and non-significant findings across neuroimaging modalities
The total number of analyses exceeds the number of studies included in this review because this table accounts for studies that incorporated multiple neuroimaging analyses. DTI, diffusion tensor imaging; EEG, electroencephalography; fMRI, functional magnetic resonance imaging; MEG, magnetoencephalography; MRI, magnetic resonance imaging; PET, positron emission tomography; SPECT, single-photon emission computed tomography.
Anatomical MRI results
16 of 28 studies (eight from Table 3, five from Table 6, and three from Table 8) found significant differences between those with SCD compared to HC using anatomical MRI neuroimaging analyses. Across studies that examined brain atrophy in SCD, reductions in grey matter volume were commonly found in the amygdala [16–18], hippocampus [16–24], entorhinal cortex [18, 21–23], precuneus [16, 25], and various frontal areas ([16, 25–27]. Cortical thickness analyses revealed significantly reduced parenchymal tissue in the left entorhinal cortex [21, 28].
DTI results
In investigations of the microstructural characteristics of white matter, using DTI, 10 of 13 studies (five from Table 4, four from Table 6, and one from Table 8) found widespread differences between SCD and HC groups in various metrics (such as fractional anisotropy (FA), mean diffusivity (MD), radial diffusivity (RD), or axial diffusivity (AxD)). Although loss of white matter integrity was widespread, common regions of decreased FA in those with SCD included the corpus callosum [25, 29–31], superior longitudinal fasciculi [29, 31], hippocampus [23, 31], and uncinate fasciculus [28, 29]. Increased MD in those with SCD were also widespread across studies, with common regions including the corpus callosum [25, 29–31], superior longitudinal fasciculus [29, 31]), hippocampus [23, 32], and cingulum [25, 29, 30].
fMRI results
When investigating differences between HC and SCD using fMRI techniques, 11 of 15 studies (six from Table 5, four from Table 6, and one from Table 8) found significant results. Considering resting-state fMRI studies, individuals with SCD exhibited differences in functional connectivity in areas associated with the default mode network (DMN) compared to HC [16, 33]. In studies using task-based fMRI, increased functional activity was found in the precuneus during a divided attention task [34], as well as in the posterior cingulate and thalamus during a working memory task [35]. Interestingly, increased functional connectivity was also seen in the precuneus and thalamus in the studies conducted by Hafkemeijer et al. [16] and Parker et al. [33] using resting-state fMRI.
PET results
Ten of 14 studies (four from Table 7 and six from Table 8) looking at PET yielded significant findings. Six of nine studies that examined Aβ found that individuals with SCD had significantly higher Aβ deposition relative to HC [36–41]. All three studies that investigated tau levels in SCD versus HC found significantly higher tau values in those with SCD [27, 41]. Finally, three of four studies found significant glucose hypometabolism in those with SCD compared to their healthy counterparts [24, 43].
EEG results
There were four studies that used various EEG techniques (e.g., EEG rhythms, amplitudes, and microstate maps) to examine differences between HC and SCD groups (see Table 9). All four studies found significant differences; however, little commonality was found between studies due to the disparate nature of their research questions of interest. See Table 8 for a summary of research findings from EEG studies.
MEG results
Five of the seven studies that used MEG to investigate differences between SCD and HC found significant results. Interestingly, all seven of these studies were comprised of participants from the same recruitment sources, however their sample size increased over time. As each of these studies focused on evaluating unique research questions, the findings from each study yielded unique results which are described in Table 10.
SPECT results
Only one study used SPECT to study differences between HC and those with SCD (see Table 11). This study by Niwa et al. [44] found that individuals with SCD showed hypoperfusion in the caudate, thalamus, and bilateral temporal regions compared to HC.
Study quality ratings
The AXIS tool was used to assess study quality in cross-sectional and longitudinal studies. The AXIS tool does not yield a total numerical score, as a total score would not meaningfully communicate the level of quality across studies as study quality is assessed over 20 components [14]. Table 13 shows a breakdown of the quality ratings for the 62 included studies for each of the 20 items on the AXIS tool. Information on the quality assessment for each individual study can be found in the Supplementary Material.
Breakdown of ratings for each item on the AXIS tool across the 62 included studies
AXIS tool, Appraisal Tool for Cross-Sectional Studies; Y, yes; N, no; U, unclear; N/A, not applicable; *Item is reverse scored (i.e., N rating is positive).
DISCUSSION
With the goal of synthesizing the existing neuroimaging studies on SCD and identifying steps for future research that will move this field forward, the current study sought to address four specific questions that will be discussed herein.
Can differences be detected between individuals with SCD compared to HC using neuroimaging methods?
A major purpose of this review was to synthesize the neuroimaging literature comparing individuals with SCD to HC. Of the 62 included articles, there were significant findings across each imaging modality. In total, 48 articles identified significant differences between SCD and HC groups. Notably, significant differences were not detected between HC and individuals with SCD in every study. For instance, some studies found significant differences between SCD and other patient groups, such as MCI or AD, while there were no significant differences between the HC and SCD groups. Further, some studies only found differences between HC and SCD when controlling for other variables such as high PiB, or APOE ɛ4, etc. Notably, methodological considerations were very important to the outcomes of each study. Nonetheless, it is clear that significant differences between HC and individuals with SCD have been found using each of the neuroimaging techniques included in the current review. This evidence suggests that there are detectable structural and functional differences in the brains of cognitively normal individuals who report symptoms of SCD compared to those who do not.
Are the detected differences consistent within each neuroimaging technique?
Taken together, 26 of 41 studies that incorporated structural neuroimaging analyses and 31 of 41 studies that incorporated functional neuroimaging analyses found significant differences between HC and those with SCD (Note: The number of incorporated analyses is greater than the total number of studies included in this review as many studies incorporated more than one neuroimaging technique). Overall, there were some common findings within neuroimaging techniques, particularly for the structural imaging approaches. Functional studies that took similar approaches seemed to have consistent results, although the small number of studies and wide variety of analysis techniques employed led to unique findings across studies. Replication of these findings and applying multimodal approaches for the same participants represent important steps for future research.
Are the regions affected in SCD consistent with those expected in early-stage AD?
Across structural MRI studies, we saw areas of atrophy in regions that are consistent with early AD, such as the hippocampus [45, 46] and entorhinal cortex [47–49]. Although atrophy was detected in brain regions associated with AD, studies also reported structural atrophy beyond the hippocampus and entorhinal cortex, including frontal regions and widespread white matter tracts. It is possible that the additional regions of atrophy identified in these SCD studies relates to the aforementioned variability in etiology of SCD; not all individuals with SCD will convert to AD.
Functional MRI studies of preclinical AD represent a relatively new and emerging area of research. Currently, fMRI biomarkers are not included in the AT(N) biomarker grouping outlined by Jack et al. [12]. Although there are no guidelines for AD specific biomarkers such as altered functional connectivity through analysis of fMRI, previous research has noted the usefulness of resting-state fMRI in its ability to distinguish between groups of HC, MCI, and AD [50–52]. A recent review examining the potential of functional imaging biomarkers for neurodegenerative disorders examined 95 papers focused on functional connectivity in AD and reported that evidence for reduced connectivity in the DMN (including the precuneus, posterior cingulate, and prefrontal cortex) in AD has been well established [53]. In the current systematic review, the findings for individuals with SCD showed decreases in functional connectivity in the DMN consistent with AD. Remarkably, increases in functional connectivity were also detected, mostly in frontal regions, setting the findings for individuals with SCD apart from those with AD. It is possible that at earlier stages of the continuum of cognitive decline, individuals with SCD are able to compensate for cognitive challenges, as demonstrated by increased functional connectivity (prior to observable structural atrophy). These findings are congruent with the Posterior-Anterior-Shift with Aging (PASA) model, which characterizes a shift in functional activity from posterior regions of the brain to frontal regions of the brain, reflective of executive based compensation [54]. However, at later stages such as AD, these compensatory mechanisms may no longer subsist. To investigate these possibilities, more research is needed to capture individuals with SCD, MCI, and AD using the same methods longitudinally.
Similar to fMRI, EEG, and MEG are not included in the current AT(N) biomarker grouping [12]. Recently, Horvath et al. [55] published a critical review of EEG/ERP biomarkers for AD that included more than 300 citations focused on a wide variety of methodologies and types of dementia. They concluded that a majority of studies detected alterations in AD, with variations in latency, amplitude, and source localization. They noted that “outcome variability is a serious issue” that may primarily relate to sample size. The current review included four EEG studies focused on individuals with SCD that had a wide variety of methods and sample sizes; therefore, it is not yet possible to compare findings across EEG/ERP studies on SCD to findings in AD. Similarly, with all the MEG studies on SCD coming from one sample and only one published report using SPECT, the outcomes of these studies cannot yet be thoroughly compared to findings from studies focused on AD. Overall, techniques such as EEG and MEG offer complementary information to MRI methods. In future dementia research, it will be important for techniques such as these to be anchored to other methods that we have a greater knowledge base in (such as MRI or PET).
Within the PET literature, it has been well established that markers of amyloid and tau are measurable hallmarks of AD. The current review revealed mixed findings within the SCD PET literature, with some studies revealing greater tau and amyloid values in SCD relative to HC groups, but other studies finding no significant differences. These mixed findings are almost certainly attributable to the methodological differences between studies, discussed next.
Are there methodological characteristics/differences between the studies that could impact the findings?
In synthesizing neuroimaging studies on SCD versus HC, several methodological differences that could lead to discrepant findings became apparent. Below we discuss several methodological differences including differences in definitions and characterization of SCD (i.e., lack of standardized terms and criteria for SCD), APOE ɛ4 status, participant recruitment location, study design, and inclusion/exclusion criteria which may have led to inconsistent findings and may be exerting a broader impact on the SCD neuroimaging literature.
Definitions and characterization of SCD
Across the studies in this systematic review, there was a lack of consistency in the terminology and criteria characterizing individuals with subjective reports of cognitive decline. Across the 62 studies, eight different terms were used to describe those with subjective cognitive decline or SCD-equivalent classifications. Overall, the term SCD was used in just over half of the included studies (see Table 14 for the frequency counts of each of these eight terms). Almost all of the studies that used the term SCD were published after 2014, which may suggest these studies are following the guidance of Jessen and colleagues of the SCD-Initiative, an international working group focused on the advancement of knowledge in the realm of SCD. However, some of the studies that used other terms to refer to SCD such as SMI or SCI were also published after 2014, and do not follow the recommendations set out by the SCD-Initiative [6]. As a result, some studies may have only included individuals with subjective complaints in the domain of memory, while others may have included individuals with subjective decline in other domains, such as executive function (which SCD is intended to capture).
Frequency counts of each SCD-equivalent classifications
Studies often lacked detailed descriptions of SCD reports such as severity of cognitive concerns, which cognitive domains are affected, onset and length of SCD, the persistence of SCD symptoms, and corroboration of decline from an informant. For example, in documenting and determining inclusion criteria for SCD, some studies only asked one or two questions about whether the person experiences SCD. Meanwhile other studies included completion of questionnaires with specific cut-off scores (e.g., Cognitive Change Index and SCD-Questionnaire), however the rationale for the specified cut-off scores is not typically provided. Furthermore, some studies used comprehensive assessments with several cognitive measures to ensure objective cognitive performance of the participants fell within the normal range, while others only administered cognitive screeners or select subtests from different cognitive measures.
APOE ɛ4 status
In the literature, it is widely accepted that the presence of the APOE ɛ4 allele is associated with an increased risk of developing late-onset AD [56–59]. However, in this review, there was variability across studies in reporting APOE ɛ4 status in their groups. Out of the 62 included articles, only 20 articles included information on APOE ɛ4 status. These were seen across anatomical MRI, DTI, fMRI, multi-modal MRI, PET, and MRI & PET studies. No articles reported APOE ɛ4 status that utilized EEG, MEG, or SPECT.
Participant recruitment location
Most of the articles included in the current review recruited their samples from memory clinics. Of the 62 articles included in this systematic review, only 11 articles investigated differences between HC and individuals with SCD in community samples, rather than memory clinics. In many studies, it appeared that recruitment from a memory clinic was part of the inclusion criteria for their SCD group. The results of the 11 studies that utilized community recruitment (or both clinic and community recruitment) for their SCD groups were mixed. Eight of these 11 studies found significant differences between HC and individuals with SCD [21, 60–63]. Community recruitment was not utilized in stand-alone PET, MEG, or SPECT studies. Studies that recruited individuals with SCD from memory clinics may yield participant samples with greater levels of concern about their SCD compared to studies that recruited individuals with SCD from the community who were not actively seeking medical care [7]. Furthermore, as most SCD participants were recruited from memory clinics, most were located within larger cities and these studies tended to include participants with higher levels of education (e.g., a mean of 16 years of education was not uncommon). It is unclear if this represents a sampling bias or whether individuals with higher levels of education are more likely to report and seek care for experiences of SCD. It is also possible that individuals with SCD and lower levels of education may yield different findings.
Study design
Nearly all the studies included in this review were cross-sectional. It is possible that different results would be revealed if within-subject longitudinal study designs were utilized. Investigating SCD longitudinally will be important in understanding who is more likely to progress from SCD to AD-related or non-AD related dementia in the future.
There was also a wide range in sample size observed in the literature. In the current systematic review, sample sizes for the SCD groups ranged from 5 to 210, which may also have impacted the statistical power to detect differences from HC groups.
Inclusion/exclusion criteria
Many of the studies included in this review listed exclusion criteria regarding their sample such as history of a mental disorder, depression, prescription of psychotropic or psychoactive medications, history of stroke, history of addiction, history of traumatic brain injury that could cause cognitive impairment, or structural brain abnormalities such as white matter hyperintensities or vascular problems. Careful consideration of inclusion/exclusion criteria is imperative, given that some of the above mentioned criteria (e.g., depression, vascular problems) may contribute the presentation of SCD and can occur independent of, or be considered integral to, the presentation of AD. Molinuevo and colleagues [7] recommended three areas of information that should be included in research on SCD including information on the measurement approach, defined cut-off scores for subjective report measures of SCD, and defined cut-off scores for measures evaluating objective cognition. In the current review, a large majority of studies adequately described their measurement approach such that they included information on the research environment and recruitment source, the names of the measures used, who completed the measures, how the measures were administered, the comparison group (i.e., HC), and the domains of cognition that were assessed. Although a large majority of the studies reviewed provided detailed information on their measurement approach, several of these studies did not provide defined cut-off scores the subjective and objective report measures. While some studies provided defined cut-off scores for the subjective report measures and/or objective cognitive measures., many simply stated that performance by the SCD and HC groups were within normal limits.
Limitations
The search strategy in the current review was limited to published studies written in English available on the PubMed and PsycINFO databases. Systematic searches were not conducted outside of these databases nor were unpublished studies solicited. It is possible that studies included in this review are skewed towards those with significant findings due to the “file drawer problem” [64]. Although the current systematic review provides a comprehensive synthesis of neuroimaging findings in individuals with SCD, there were several types of studies that were not included. Specifically, this review sought to detail group differences between individuals with SCD compared to HC. This specific criterion led to the exclusion of studies that did not include a separate SCD group from HC (i.e., control groups comprised of healthy individuals with or without reports of SCD). This criterion also excluded studies without a distinct control group (i.e., healthy individuals without SCD) but investigated differences between individuals with SCD relative to a cognitively impaired group, such as MCI or AD. Similarly, studies that only investigated relationships or associations between the severity of SCD symptoms and neuroimaging metrics were also excluded if they did not report group differences in neuroimaging metrics between individuals with SCD and HC.
Future directions
There are several specific recommendations for future research that can be made based on the existing literature. In particular, studies investigating SCD should engage in standardized research practices outlined by the SCD-Initiative, using both the proposed standardized terminology and group classification of individuals with SCD. Further, SCD-plus criteria should be applied to specifically examine individuals with SCD that have an increased risk of future cognitive decline. Notably, the criteria for SCD-plus has been recently updated by Jessen et al. [8] and recommendations for operationalizing SCD have been well described by Molinuevo et al [7]. Relatedly, the inclusion of more details on the SCD groups being studied will be useful in contextualizing the findings of each study. Specifically, including data on the nature of the self-experienced cognitive decline such as persistence of symptoms, length of time experiencing SCD, and the cognitive domain(s) affected, will help contextualize results based on participant characteristics. It will also be important for future studies to include information on the diversity of the samples as well as consider whether there are cultural contributions to the presentation and/or identification of SCD. Collecting information on APOE ɛ4 from participants should be continued in order to investigate the relationship between APOE, SCD, and AD. Additionally, longitudinal study designs should be used to provide valuable information regarding conversion rates and distinguishing between individuals with SCD who progress from subjective to objective cognitive decline based on neuropsychological measures and those who remain cognitively stable. Longitudinal designs would also help determine whether SCD is indicative of early AD or if it is related to other forms of dementia. Furthermore, multiple measurements could help to model the progression of change over time (e.g., Ashford & Schmitt [65]). Finally, along with consistency, multimodal methods and replications with large sample sizes will be crucial for translating research findings on individuals with SCD into practice.
Conclusions
Biomarker research has focused on the identification of pre-clinical indicators of AD. We have completed the most comprehensive overview of published neuroimaging studies comparing individuals with SCD to HC to date. The current review found that differences can be detected between individuals with SCD and HC across all included neuroimaging modalities, anatomical MRI, DTI, fMRI, PET, EEG, MEG, SPECT, and multi-modal neuroimaging. These findings suggest that neuroimaging is capable of detecting differences between individuals experiencing both normal and non-normal aging, even during SCD where no objective impairments in cognition have yet taken place. Although significant differences were found between individuals with SCD and HC across the neuroimaging modalities included in this review, results were inconsistent both within and across neuroimaging modalities likely due to methodological variations. Due to the inconsistencies in methodology, the level of generalizability of the findings across studies is unknown. Since SCD may arise from other etiologies apart from preclinical AD, it is important that future research in this area is designed and conducted purposefully, recognizing the impact of methodology on the study outcome. Implementation of the recommendations for future neuroimaging studies on SCD are imperative to understanding the earliest changes in the brain that relate to cognitive decline and potential future development of AD.
DISCLOSURE STATEMENT
Authors’ disclosures available online (https://www.j-alz.com/manuscript-disclosures/21-5249r2).