
Abstract
Background:
Amyloid-β (Aβ), which derives from the amyloid-β protein precursor (AβPP), forms plaques and serves as a fluid biomarker in Alzheimer’s disease (AD). How Aβ forms from AβPP is known, but questions relating to AβPP and Aβ biology remain unanswered. AD patients show mitochondrial dysfunction, and an Aβ/AβPP mitochondria relationship exists.
Objective:
We considered how mitochondrial biology may impact AβPP and Aβ biology.
Methods:
SH-SY5Y cells were transfected with AβPP constructs. After treatment with FCCP (uncoupler), Oligomycin (ATP synthase inhibitor), or starvation Aβ levels were measured. β-secretase (BACE1) expression was measured. Mitochondrial localized full-length AβPP was also measured. All parameters listed were measured in ρ0 cells on an SH-SY5Y background. iPSC derived neurons were also used to verify key results.
Results:
We showed that mitochondrial depolarization routes AβPP to, while hyperpolarization routes AβPP away from, the organelle. Mitochondrial AβPP and cell Aβ secretion inversely correlate, as cells with more mitochondrial AβPP secrete less Aβ, and cells with less mitochondrial AβPP secrete more Aβ. An inverse relationship between secreted/extracellular Aβ and intracellular Aβ was observed.
Conclusion:
Our findings indicate mitochondrial function alters AβPP localization and suggest enhanced mitochondrial activity promotes Aβ secretion while depressed mitochondrial activity minimizes Aβ secretion. Our data complement other studies that indicate a mitochondrial, AβPP, and Aβ nexus, and could help explain why cerebrospinal fluid Aβ is lower in those with AD. Our data further suggest Aβ secretion could serve as a biomarker of cell or tissue mitochondrial function.
INTRODUCTION
Amyloid-β (Aβ) plaques are a hallmark of Alzheimer’s disease (AD). Decades of research define how Aβ derives from amyloid-β protein precursor (AβPP) and how Aβ forms various insoluble species [1]. Why AβPP metabolism changes in AD, however, is unclear. A recognized relationship between AβPP, Aβ, and mitochondria exists and could provide insight into this question, but our appreciation of the factors that mediate this relationship is also incomplete [2, 3].
AβPP and Aβ localize to mitochondria [4]. The trafficking of AβPP to mitochondria results in its transmembrane arrest where it blocks mitochondrial translocases and inhibits the import of nuclear DNA-encoded mitochondrial proteins [5]. Aβ could be produced locally within mitochondria by a resident γ-secretase [6]. This is important because Aβ interacts with mitochondrial proteins to cause mitochondrial dysfunction [7, 8]. Aβ interacts with a mitochondrial enzyme, Aβ binding alcohol dehydrogenase, which inhibits NAD+binding [4]. Aβ also inhibits cytochrome oxidase (COX) activity, reduces ATP production, increases reactive oxygen species, and depolarizes the mitochondrial membrane potential [5, 9, 10].
Relationships between Aβ production and mitochondrial dynamics exist. Inhibition of COX with concomitant mitochondrial uncoupling increased the production of an 11.5 kDa AβPP C-terminal fragment containing the Aβ sequence [3]. The non-amyloidogenic AβPP derivative, sAβPPα, is reduced with glycolysis inhibition, a phenomenon reversed with antioxidants. Amyloidogenic AβPP processing is also enhanced through complex I inhibition in vitro and in vivo [11].
Consistent with in vitro and in vivo studies, changes in bioenergetics and mitochondrial function are observed in the brain and periphery of AD subjects. Brain glucose metabolism is reduced in AD subjects. COX enzyme maximum velocity (Vmax) activity is lower in AD subject platelets, brain tissue, and fibroblasts [12–15]. Given the relationship between mitochondria, AβPP, and Aβ, we examined the relationship between mitochondrial functional states and Aβ secretion. We found strong correlations between mitochondrial membrane potential, AβPP mitochondrial localization, and Aβ secretion.
In addition to informing issues of AβPP biology, the data we now present provides insight into Aβ fluid levels. Aβ is reduced in AD patient cerebrospinal fluid (CSF) [16, 17], and the plasma Aβ42:Aβ40 ratio is also lower than it is in cognitively normal individuals [9, 18–24]. As our data show mitochondrial function determines cell Aβ release, in addition to serving as a biomarker of AD presence, Aβ fluid levels and ratios may also function as biomarkers of mitochondrial integrity.
MATERIALS AND METHODS
Cell culture
Human SH-SY5Y neuroblastoma cells were cultured in high glucose DMEM with 5% FBS and penicillin/streptomycin. SH-SY5Y ρ0 cells were cultured in high glucose DMEM with 5% FBS, penicillin/streptomycin, 50μg/mL uridine, and 100μg/mL pyruvate. When SH-SY5Y cells were compared to SH-SY5Y ρ0 cells medium for both cell types contained uridine and pyruvate as indicated above. Cultivation of cells was completed approximately every 48 hours using 0.25% trypsin with EDTA. Cells were plated for experiments in appropriate vessels and allowed to reach 80% confluence before experiments were completed.
The iPSC line DF6-9-9T.B (referred to as DF6) was purchased from WiCell. DF6 cells were maintained on a feeder free system using Matrigel (Corning) and mTESR1 medium (StemCell Technologies). Cells were passaged with ReLeSR (StemCell Technologies) when colonies became large and confluent to avoid spontaneous differentiation as outlined in manufacturer protocols.
Neuronal differentiation
iPSCs were differentiated into neural progenitor cells (NPCs) using STEMDiff Neural Induction Medium (NIM) from StemCell Technologies. iPSCs were placed into a single cell suspension in NIM with SMADi/ROCKi (SMAD inhibitor and ROCK Inhibitor) in an AggreWell 800 plate. Embryoid bodies were cultured in the AggreWell plate for 5 days with NIM/SMADi partial medium changes daily. Embryoid bodies were plated onto Matrigel (Corning) coated plates and fed daily with NIM/SMADi medium until day 12 to allow neural rosette formation. Neural rosettes were selected using Neural Rosette Selection Reagent (StemCell Technologies) and plated onto Matrigel coated dishes with NIM/SMADi. The medium was changed daily for 7 days, after which neural progenitor cells were cryopreserved and split into defined Neural Progenitor Medium (StemCell Technologies). NPCs were plated on PLO/Laminin (Sigma) coated dishes in Neural Progenitor Medium. The following day the medium was changed to StemDiff Forebrain Neural Differentiation Medium (StemCell Technologies), which was changed daily for 7 days [25, 26]. Cells were then plated onto PLO/laminin coated dishes in defined Brain Phys Medium (with N2A, SM1, BDNF, GDNF, cAMP, and ascorbic acid) for neuronal maturation. Neurons were matured for 7 days for downstream experiments.
3M AβPP
A wild-type (WT) AβPP 695 construct was obtained from Addgene (30137). This plasmid is on the pCAX vector backbone. Three point mutations where engineered using site directed mutagnesis as previously described [5]. Site directed mutagenesis and sequencing was completed at Genewiz. The point mutations included Lys to Asp at position +51 (AAG to AAC), His to Asp at position +44 (CAC to AAC), and Arg to Asp at position +40, which required two mutations (AGA to AAA, and AAA to AAC).
Transfection
Transfections with WT or 3M AβPP were completed using Lipofectamine 2000 (ThermoFisher). We followed the manufacturer’s protocol and used 5μg DNA for 6-well dishes or 100 ng DNA for 96 well dishes.
Cell treatments
Cells were treated with FCCP, oligomycin, or glucose starvation. All treatments lasted 4 hours. Doses for FCCP and oligomycin ranged from 5μM to 20μM and are indicated in the figure legends. Glucose starvation was completed using HBSS with Ca2 + and Mg2 + . Ethidium bromide treatment of iPSC-derived neurons was completed at a dose of 100 ng/mL for seven days.
Aβ ELISA assays
Media protein was concentrated using ice-cold 100% acetone at a 2 : 1 ratio. Media samples were incubated in acetone for a minimum of 30 min at –20°C. Samples were sedimented by centrifugation at 5,000×g for 5 min followed by a 70% ethanol wash. Samples were resuspendend in 8M urea. Whole cell lysate samples were prepared in RIPA buffer (Sigma Aldrich) with protease/phosphatase inhibitor cocktail (ThermoFisher). Media and whole cell samples were used in downstream ELISA assays. Aβ40 and Aβ42 were measured using human ELISA assays from ThermoFisher with samples at a dilution of 1 : 5. All data were normalized to the protein content of the samples using a BCA protein assay (ThermoFisher).
Membrane potential
Mitochondrial membrane potential was determined using tetramethylrhodamine, ethyl ester (TMRE from ThermoFisher). 1 mM TMRE was diluted into cell culture medium with indicated treatments to a final concentration of 200 nM. Hoechst was added to a final concentration of 10μg/mL. Cells were incubated with TMRE/Hoechst for 30 min and washed two times with Hank’s Balanced Buffer Solution (HBSS with Ca2 + and Mg2 +). Cells were imaged using a Cytation 1 Cell Imaging MultiMode Reader from BioTek. TMRE intensity was normalized to total cell counts for each image.
Plasma membrane potential was determined using Bis-(1,3-Dibutylbarbituric Acid)Trimethine Oxonol (DiBAC4(3)) (ThermoFisher). 1 mM DiBAC4(3) was diluted into cell culture medium with indicated treatments to a final concentration of 200 nM. Hoechst was added to a final concentration of 10μg/mL. Cells were incubated with DiBAC4(3)/Hoechst for 30 min and washed two times with Hank’s Balanced Buffer Solution (HBSS with Ca2+ and Mg2+). Fluorescence intensity was determined using a Tecan infinite M200 plate reader. DiBAC4(3) intensity was normalized to total cell counts for each image.
For correlation of mitochondrial and plasma membrane potential both dyes were used simultaneously with Hoechst. Fluorescence intensity was then determined using a Tecan Infinite M200 plate reader.
Mitochondrial isolation
Mitochondria were isolated as previously described [27] with changes as noted. Briefly, SH-SY5Y cells were resuspended in ice-cold MSHE buffer (225 mM mannitol, 75 mM sucrose, 5 mM HEPES, 1 mM EGTA, pH 7.4). The suspended cells were disrupted via nitrogen cavitation for 15 minutes on ice with 900 PSI chamber pressure. Enriched mitochondrial pellets were sedimented by centrifugation (1000 g for 5 min at 4°C, followed by two 10 min spins at 20,000 g and 4°C). The heavy membrane fraction was collected after the first centrifugation (the pellet). Mitochondria were re-suspended in MSHE and treated with 50μg/mL trypsin for 15 min at room temperature. Mitochondria were sedimented at 20,000×g for 5 min and washed with MSHE. Protein concentration was determined using a BCA protein assay for downstream western blotting. HDAC and calreticulin were included in analysis to check for nuclear and endoplasmic reticulum contamination of mitochondrial samples.
Western blotting
Western blotting was completed as previously described [27]. Whole cell lysates were generated using RIPA buffer with protease and phosphatase inhibitors (Sigma and ThermoFisher). Briefly, equal amount of protein were resolved via SDS-PAGE on Criterion TGX gels 4–15% (BioRad). Gels were transferred to PVDF membranes and blocked with 5% BSA in PBST. Primary antibodies were incubated overnight at 4°C followed by three washes with PBST. Secondary antibodies (ThermoFisher) were incubated at room temperature for 1 h. Gels were imaged using WestFemto ECL (ThermoFisher) and a BioRad ChemiDoc XRS imaging system. Loading controls included either actin (Cell Signaling) or AmidoBlack (Sigma) total protein stain. Primary antibodies include AβPP 6E10 (Biolegend), BACE1 (Abcam), COX41I (Cell Signaling), Calreticulin (Cell Signaling), GAPDH (Cell Signaling), GFAP (Abcam), HDAC (Cell Signaling), MAP2 (Abcam), Nestin (ThermoFisher), S100β (Abcam), and Synaptophysin (Abcam).
Statistics
Data were summarized by means and standard errors. To compare means between two groups we used a student’s T-test. For correlation analysis a Pearson test was used. p-values less than 0.05 were considered statistically significant. All experiments were completed with a minimum of six replicates unless indicated in the figure legend.
RESULTS
Chronic depletion of mtDNA (ρ0) depolarizes mitochondrial membrane potential in SH-SY5Y neuroblastoma cells (Fig. 1A). The ρ0 cells lack detectable mtDNA and have no mitochondrial oxygen consumption as previously described [28]. We examined Aβ secretion from SH-SY5Y control cells and SH-SY5Y ρ0 cells. ρ0 cells secrete significantly less Aβ40 and Aβ42 when compared to control cells (Fig. 1B). In this case the reduction in secreted Aβ40 proportionally exceeded the reduction in secreted Aβ42, which increased the medium Aβ42/Aβ40 ratio. Intracellular Aβ levels were inverse to what was observed in the media. Intracellular Aβ40 and Aβ42 levels were higher in SH-SY5Y ρ0 cells (Fig. 1C). Intracellular Aβ42/Aβ40 ratios did not change. BACE1 expression levels were higher in SH-SY5Y ρ0 cells (Fig. 1D). We also observed a significant inverse correlation between the mitochondrial membrane potential and the plasma membrane potential (Supplementary Figure 1).
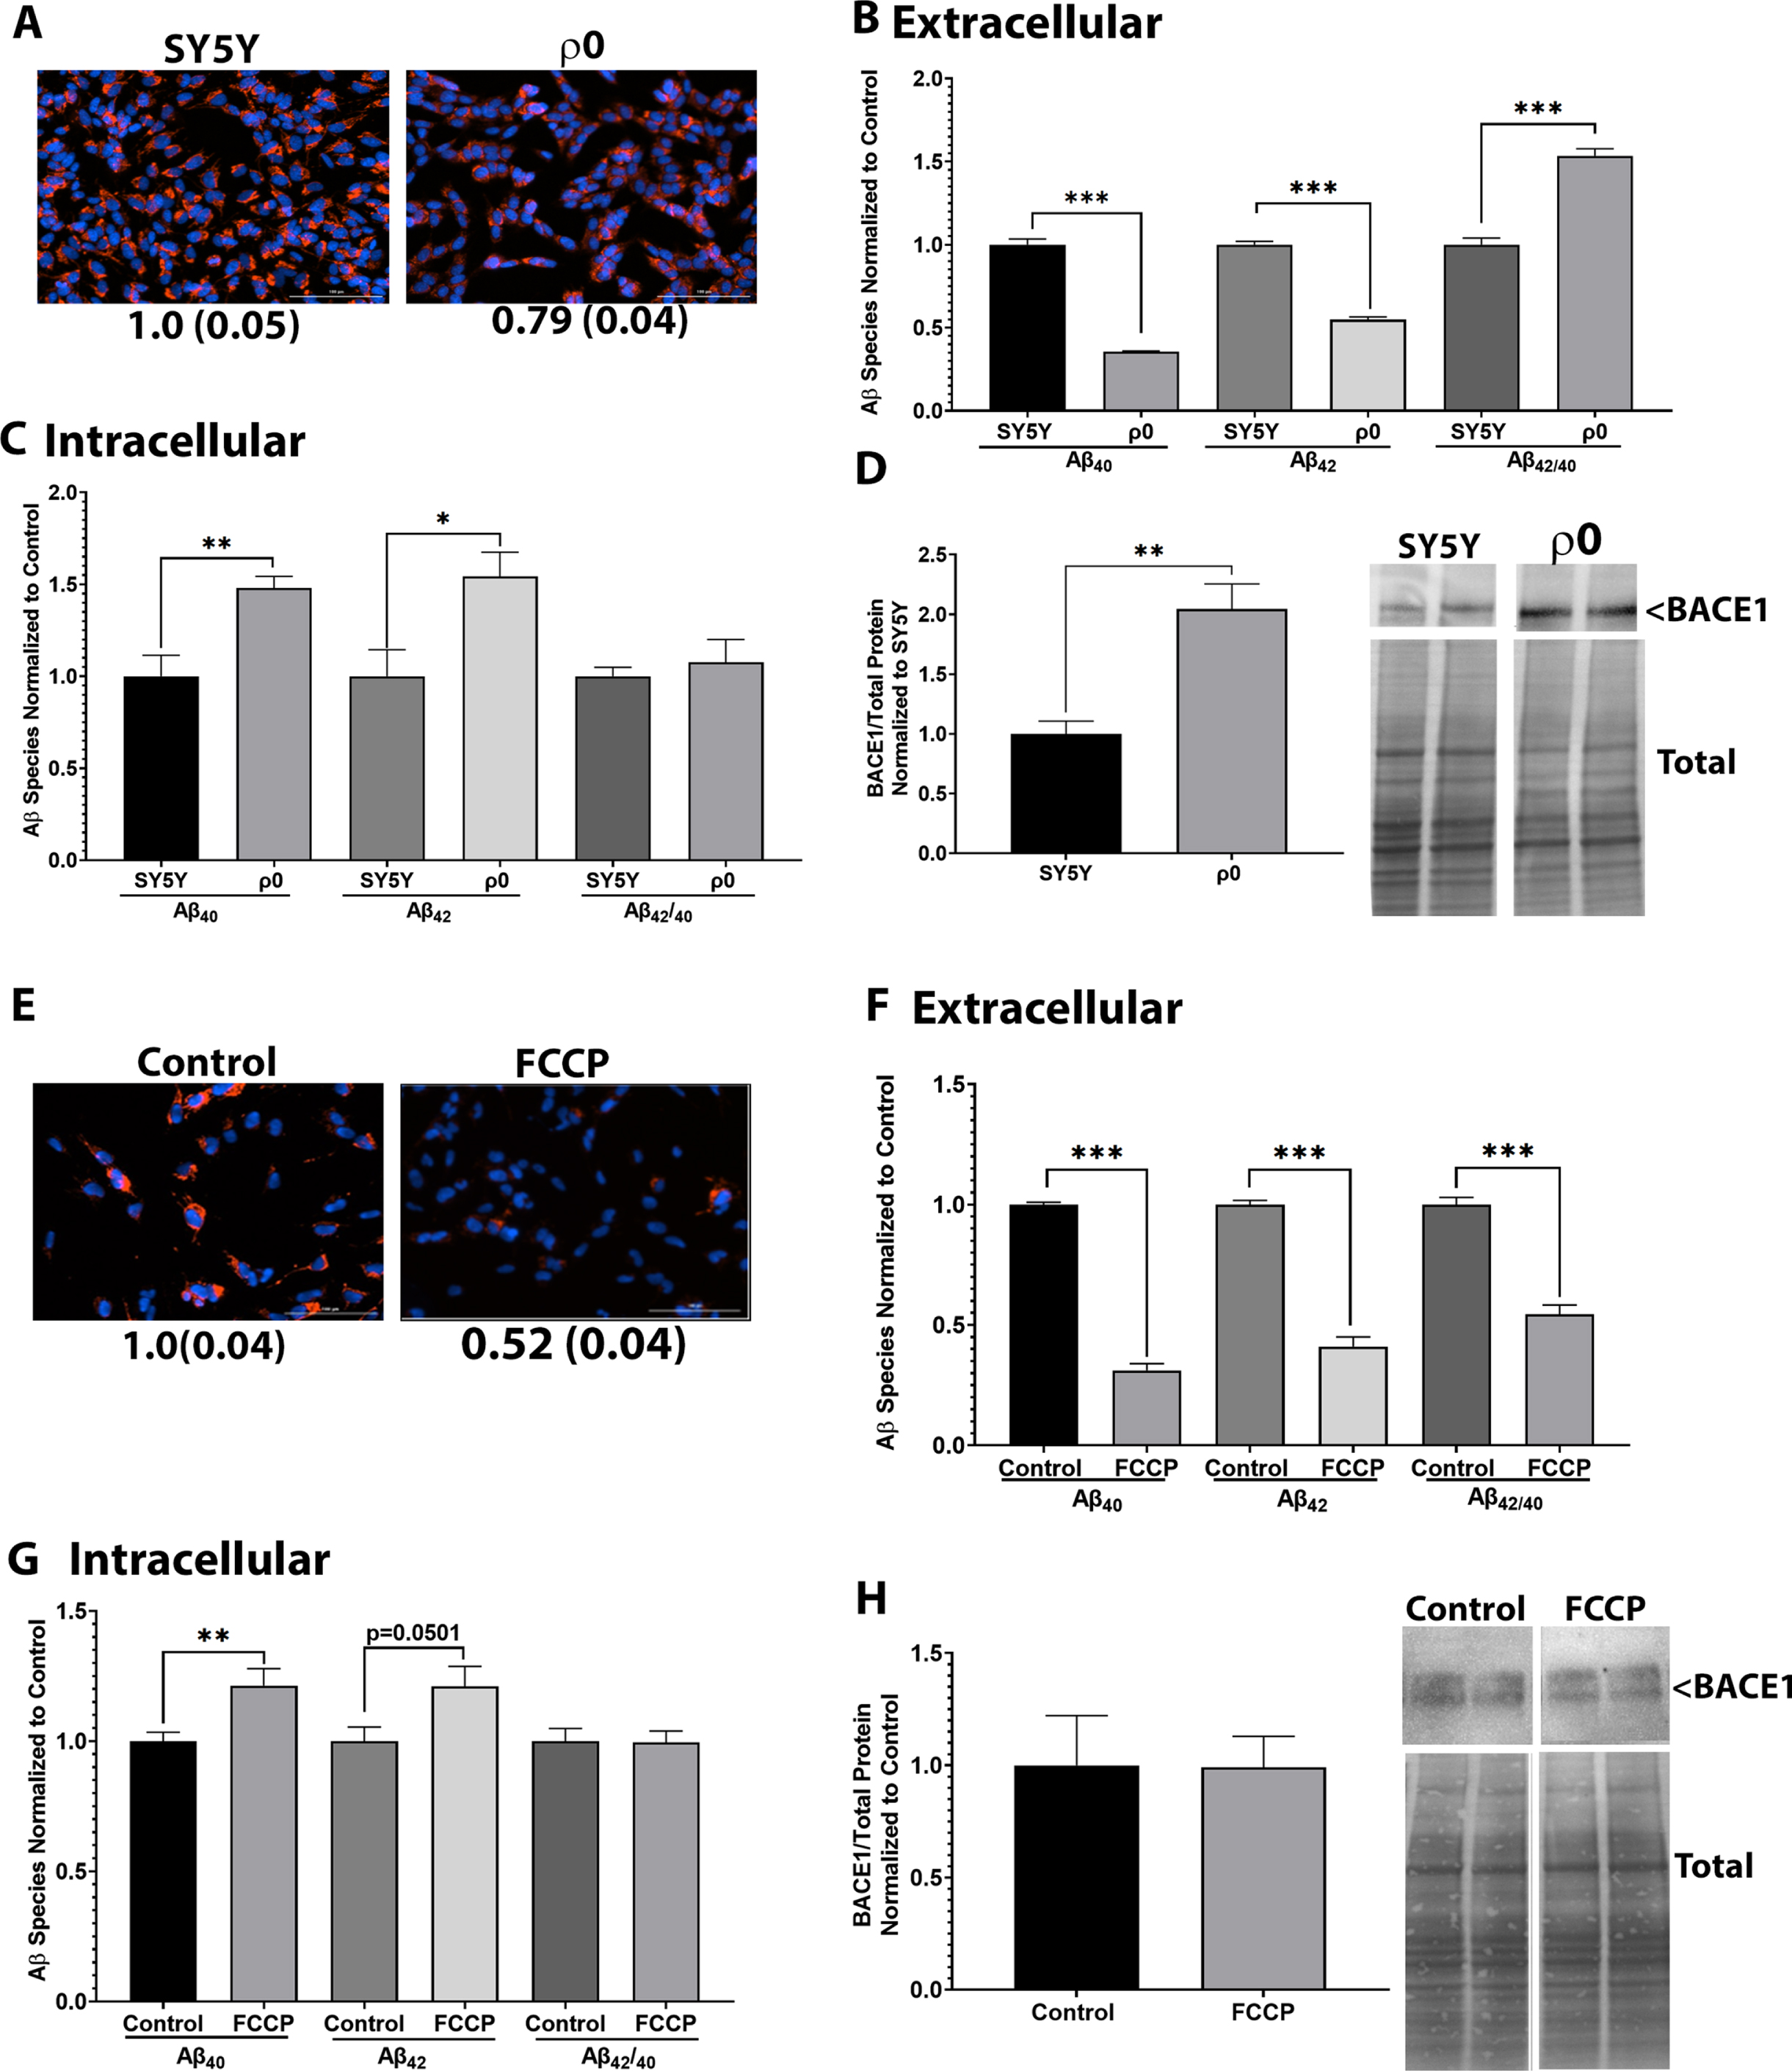
Mitochondrial membrane depolarization reduces Aβ40 and Aβ42 secretion. For A-D, SH-SY5Y or SH-SY5Y ρ0 cells expressing WT AβPP were used. A) Cells stained with TMRE and Hoechst for 30 min. Fluorescent images were captured, and intensity was normalized to total cell number. Values indicate average and standard error. B) Media was collected, and protein extracted. Samples were incubated in either an Aβ40 or Aβ42 ELISA. Data were normalized to protein content and control samples. Data indicate average and standard error. C) Whole cell lysate samples were incubated in either an Aβ40 or Aβ42 ELISA. Data were normalized to protein content and control samples. Data indicate average and standard error. D) Whole cell lysate samples underwent western blotting to measure BACE1 protein expression normalized to total protein content. Data indicate average and standard error. For E-H, SH-SY5Y cells expressing WT AβPP were treated with 20μM FCCP for 4 h. E) Cells stained with TMRE and Hoechst for 30 min. Fluorescent images were captured, and intensity was normalized to total cell number. Values indicate average and standard error. F) Media was collected, and protein extracted. Samples were incubated in either an Aβ40 or Aβ42 ELISA. Data were normalized to protein content and control samples. Data indicate average and standard error. G) Whole cell lysate samples were incubated in either an Aβ40 or Aβ42 ELISA. Data were normalized to protein content and control samples. Data indicate average and standard error. H) Whole cell lysate samples underwent western blotting to measure BACE1 protein expression normalized to total protein content. Data indicate average and standard error. **p < 0.005, ***p < 0.0005, ****p < 0.0001.
As a separate model of mitochondrial membrane potential depolarization, we examined cells treated with FCCP. FCCP-treated SH-SY5Y cells showed significant depolarization of the mitochondrial membrane potential and, similar to the ρ0 cells, significantly reduced levels of secreted Aβ40 and Aβ42 (Fig. 1E, F). Contrary to the ρ0 cells, though, the FCCP-treated cells showed a decreased Aβ42/Aβ40 ratio. Intracellular Aβ levels were inverse to what was observed in the media. Intracellular Aβ40 levels were higher and Aβ42 levels trended higher in SH-SY5Y cells treated with FCCP (Fig. 1G). Intracellular Aβ42/Aβ40 ratios did not change. BACE1 expression levels were unchanged in SH-SY5Y cells treated with FCCP (Fig. 1H). As observed in the SH-SY5Y ρ0 cells, FCCP mitochondrial membrane depolarization negatively correlated with plasma membrane hyperpolarization (Supplementary Figure 1).
Oligomycin, an ATP synthase inhibitor, hyperpolarizes the mitochondrial membrane potential and we indeed observed significant hyperpolarization of the mitochondrial membrane potential in oligomycin-treated SH-SY5Y cells (Fig. 2A). Oligomycin-treated SH-SY5Y cells showed decreased Aβ40 but increased Aβ42 secretion (Fig. 2B), with a marked increase in the Aβ42/Aβ40 ratio. Intracellular Aβ levels were inverse to what was observed in the media. Intracellular Aβ40 levels were unchanged but Aβ42 and Aβ42/Aβ40 levels were lower in SH-SY5Y cells treated with oligomycin (Fig. 2C). BACE1 expression levels trended higher in SH-SY5Y cells treated with oligomycin (Fig. 2D). Oligomycin-mediated mitochondrial membrane hyperpolarization induced depolarization of the plasma membrane (Supplementary Figure 1). Similar results were observed with starvation of SH-SY5Y cells. Starvation induced hyperpolarization of the mitochondrial membrane potential (Fig. 2E) and increased the secretion of both Aβ40 and Aβ42 (Fig. 2F). The proportional increase in Aβ42 exceeded the increase in Aβ40, which lead to an increase in the Aβ42/Aβ40 ratio. Intracellular Aβ levels were inverse to what was observed in the media. Intracellular Aβ40, Aβ42, and Aβ42/Aβ40 levels were lower in starved SH-SY5Y cells (Fig. 2G). BACE1 protein levels were not changed in starved SH-SY5Y levels (Fig. 2H). Consistent with other models, starvation-induced mitochondrial membrane potential hyperpolarization associated with depolarization of the plasma membrane potential (Supplementary Figure 1).
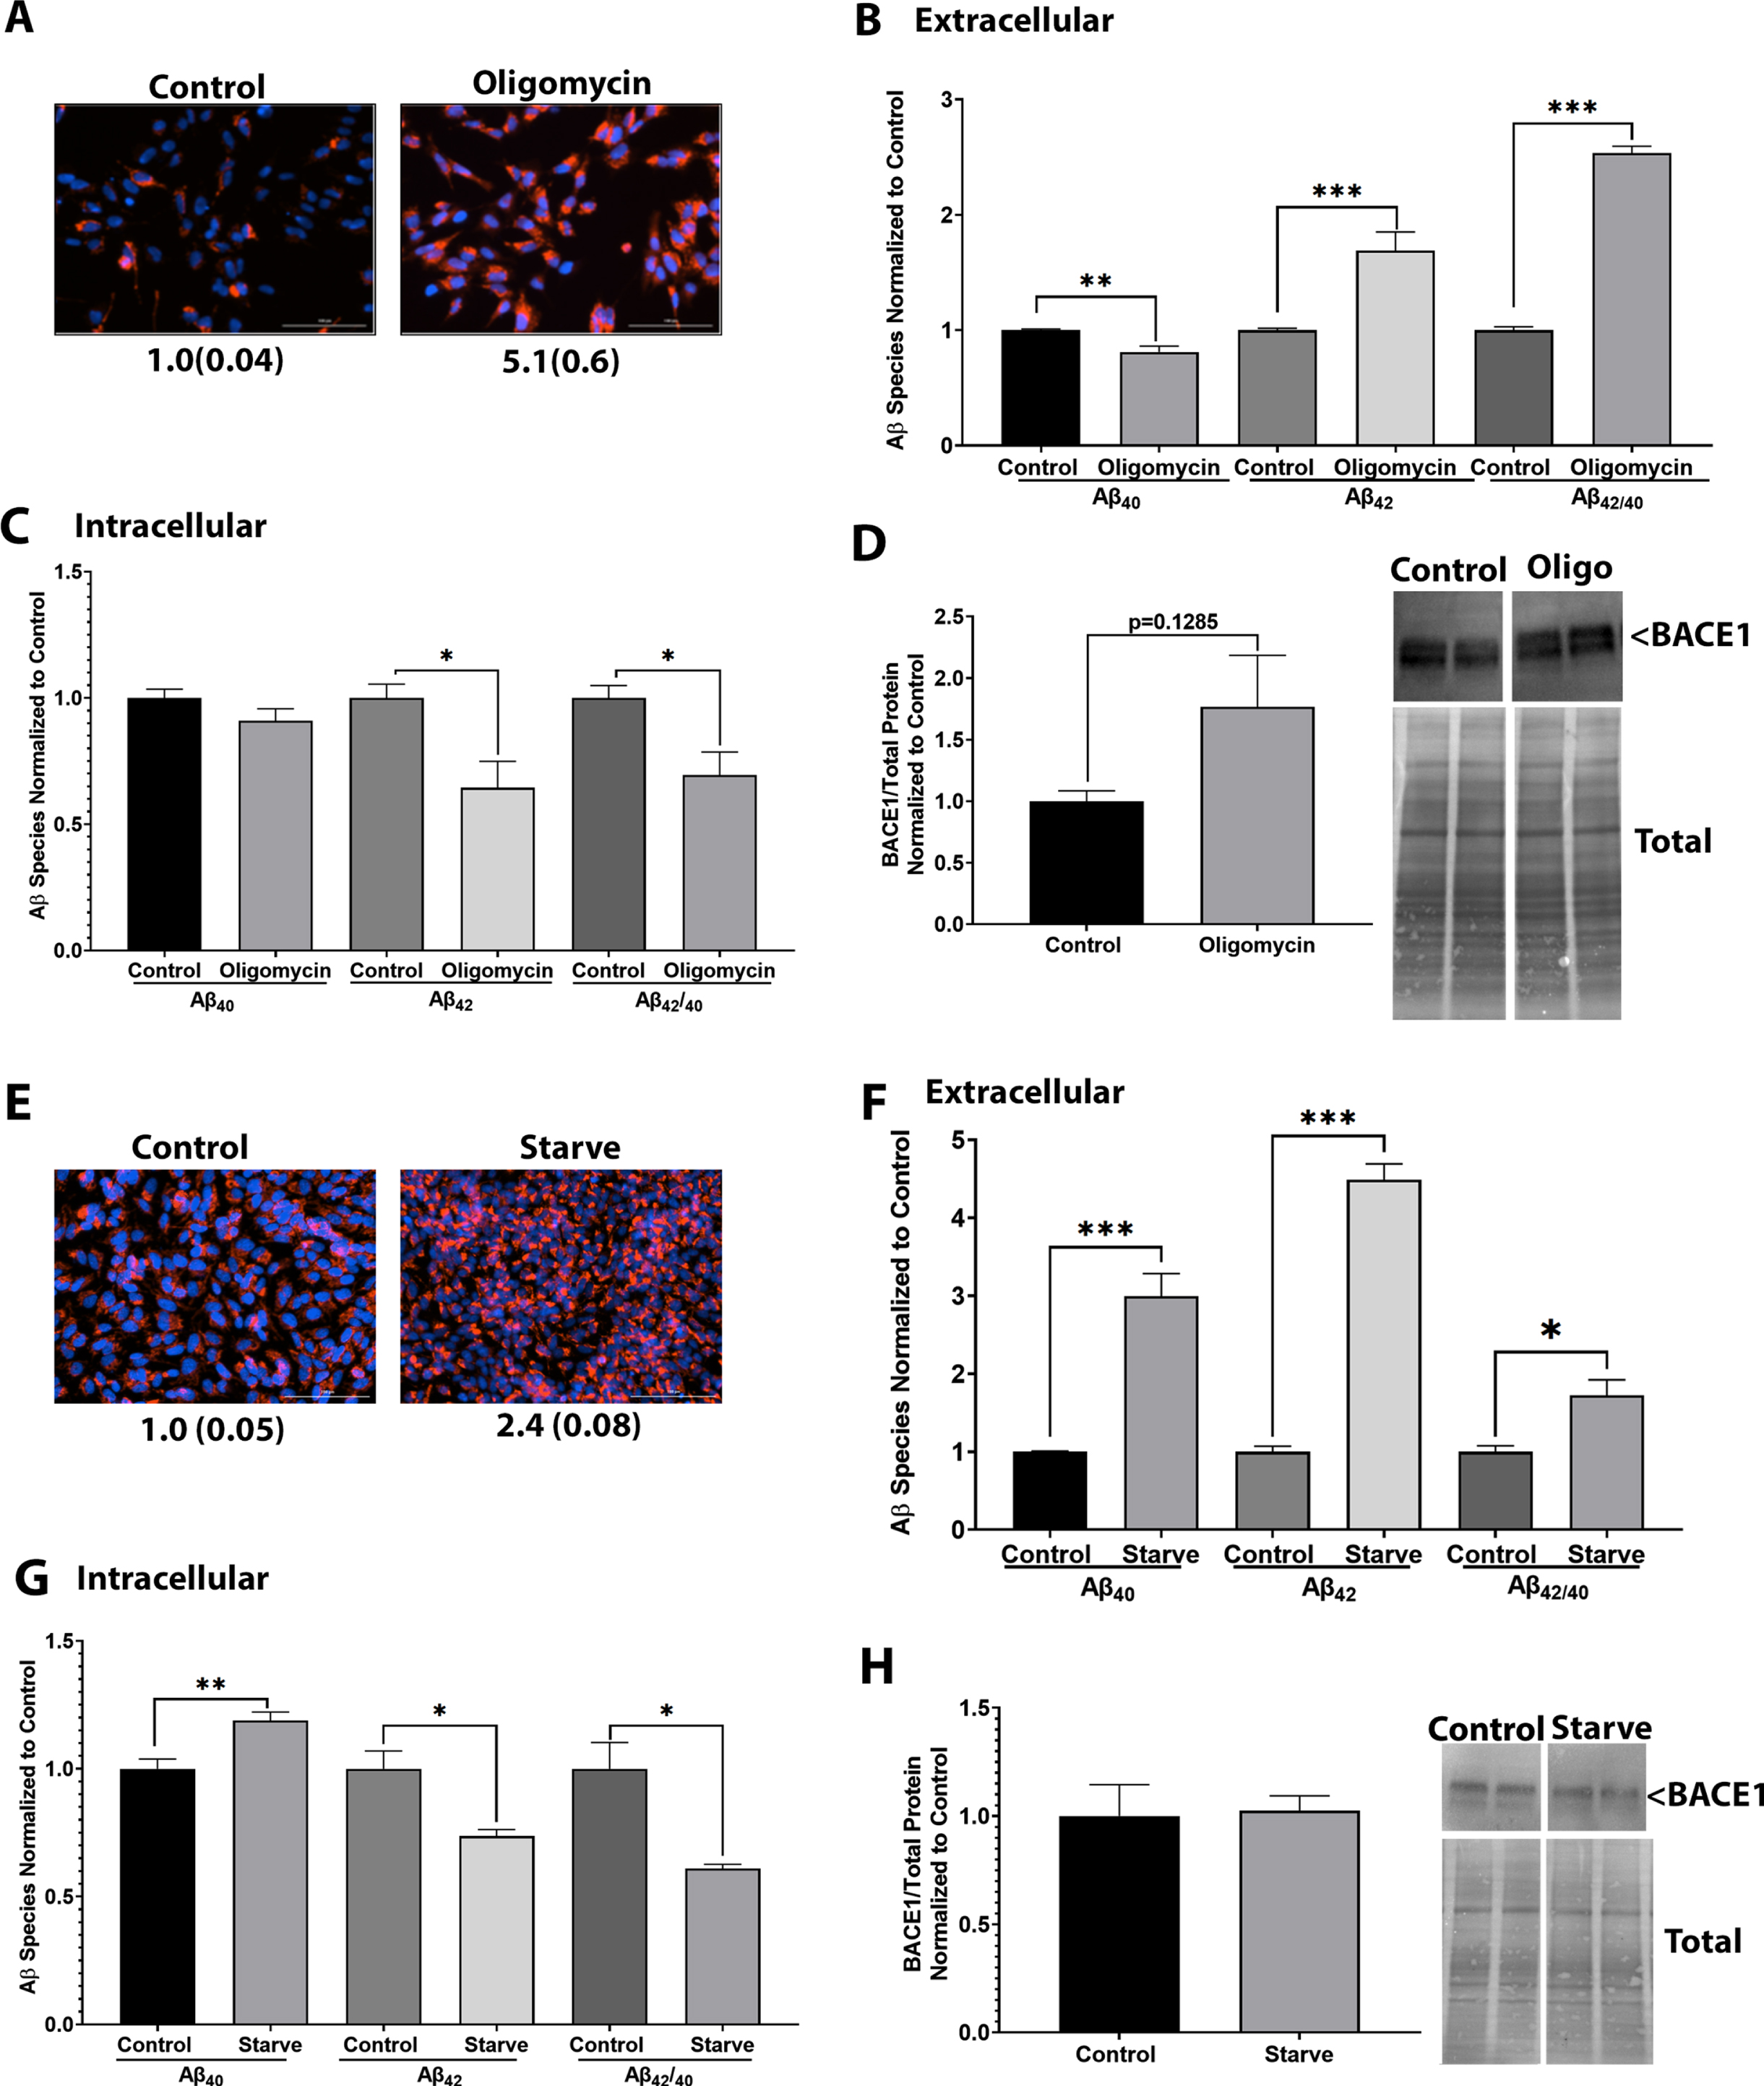
Mitochondrial membrane hyperpolarization increases Aβ42 secretion. For A–D, SH-SY5Y cells expressing WT AβPP were treated with 20μM oligomycin for 4 h. A) Cells stained with TMRE and Hoechst for 30 min. Fluorescent images were captured, and intensity was normalized to total cell number. Values indicate average and standard error. B) Media was collected, and protein extracted. Samples were incubated in either an Aβ40 or Aβ42 ELISA. Data were normalized to protein content and control samples. Data indicate average and standard error. C) Whole cell lysate samples were incubated in either an Aβ40 or Aβ42 ELISA. Data were normalized to protein content and control samples. Data indicate average and standard error. D) Whole cell lysate samples underwent western blotting to measure BACE1 protein expression normalized to total protein content. Data indicate average and standard error. For E-H, SH-SY5Y cells expressing WT AβPP were starved in HBSS for 4 h. E) Cells stained with TMRE and Hoechst for 30 min. Fluorescent images were captured, and intensity was normalized to total cell number. Numbers indicate average and standard error. F) Media was collected, and protein extracted. Samples were incubated in either an Aβ40 or Aβ42 ELISA. Data were normalized to protein content and control samples. Data indicate average and standard error. G) Whole cell lysate samples were incubated in either an Aβ40 or Aβ42 ELISA. Data were normalized to protein content and control samples. Data indicate average and standard error. H) Whole cell lysate samples underwent western blotting to measure BACE1 protein expression normalized to total protein content. Data indicate average and standard error. *p < 0.05, **p < 0.005, ***p < 0.0005, ****p < 0.0001.
AβPP localizes to mitochondria (Fig. 3A) and mitochondrial membrane potential associates with AβPP mitochondrial localization. SH-SY5Y cells with depolarized mitochondrial membrane potentials due to either FCCP or chronic mtDNA depletion had increased AβPP in their mitochondria-enriched fractions (Fig. 3B, C). SH-SY5Y cells with hyperpolarized mitochondrial membrane potentials due to either oligomycin or glucose starvation showed decreased AβPP mitochondrial localization (Fig. 3D, E). Pooled data from across all the conditions revealed inverse relationships between mitochondrial-localized AβPP and secreted Aβ42, and between mitochondrial-localized AβPP and secreted Aβ40 (Fig. 3F, G). In essence, as mitochondrial AβPP levels decline more Aβ42 and Aβ40 are secreted, and as mitochondrial AβPP levels increase less Aβ42 and Aβ40 are secreted. We also demonstrated a significant inverse relationship between mitochondrial AβPP localization and the secreted Aβ42/Aβ40 ratio. As the mitochondrial AβPP content rose, the ratio of secreted Aβ42/Aβ40 generally fell (Fig. 3H); this overall relationship was observed even though the relatively depolarized ρ0 cells showed an increased Aβ42/Aβ40 ratio.

Mitochondrial membrane potential alters AβPP localization. SH-SY5Y cells expressing WT AβPP were treated as indicated and mitochondria were isolated using nitrogen cavitation and trypsin treatment. A) SH-SY5Y cell mitochondrial or whole cell lysate (WCL) fractions. B) SY5Y (S) versus SY5Y ρ0 (ρ) cells. Data indicate average and standard error. Representative western blot images are shown. C) SH-SY5Y cells treated with vehicle (C) or 20μM FCCP (F) for 4 h. Data indicate average and standard error. Representative western blot images are shown. D) SH-SY5Y cells treated with vehicle (C) or 20μM oligomycin (O) for 4 h. Data indicate average and standard error. Representative western blot images are shown. E) SH-SY5Y cells starved (S) using HBSS for 4 h or kept in regular medium (C). Data indicate average and standard error. F) Correlation of mitochondrial-localized AβPP and secreted Aβ42. G) Correlation of mitochondrial-localized AβPP and secreted Aβ40. H) Correlation of mitochondrial-localized AβPP and secreted Aβ42/Aβ40. For F–H, correlations are from all manipulations (FCCP, ρ0, oligomycin, starve). *p < 0.05, **p < 0.005, ***p < 0.0005.
Based on these data we specifically examined the effects of AβPP mitochondrial targeting on Aβ production and mitochondrial membrane potential. Expression of a mitochondrial localization signal-incompetent AβPP construct, 3M AβPP, did not alter Aβ40 or Aβ42 production but did increase the Aβ42/Aβ40 ratio (Supplementary Figure 2). Western blot and electron microscopy data showed there was less mitochondrial AβPP in SH-SY5Y cells expressing 3M AβPP than there was in cells expressing WT AβPP (Supplementary Figure 2). When SH-SY5Y cells expressing either WT or 3M AβPP were treated with varying doses of FCCP we observed a consistent depolarization of the mitochondrial membrane potential (Fig. 4A). Similar to what we observed in Fig. 1, FCCP was able to reduce Aβ42 secretion in WT AβPP-expressing SH-SY5Y cells (Fig. 4B), but in 3M AβPP -expressing SH-SY5Y cells FCCP at any of the concentrations tested failed to reduce Aβ42 secretion (Fig. 4B). In SH-SY5Y cells treated with various concentrations of FCCP, with WT AβPP a significant correlation between mitochondrial membrane potential and Aβ42 secretion was observed, but no correlation was seen with 3M AβPP (Fig. 4C).

AβPP localization affects the relationship between mitochondrial membrane potential and Aβ42 secretion. For A–C, SH-SY5Y cells expressing WT or 3M AβPP were treated with 5μM, 10μM, or 20μM FCCP for 4 h. A) Cells stained with TMRE and Hoechst for 30 min. Fluorescent images were captured, and intensity was normalized to total cell number. Data indicate average and standard error. B) Media was collected, and protein extracted. Samples were incubated in an Aβ42 ELISA. Data were normalized to protein content and control samples. Data indicate average and standard error. C) Correlation of mitochondrial membrane potential with secreted Aβ42 in cells expressing either WT or 3M AβPP and treated with different concentrations of FCCP. For D-F, SH-SY5Y cells expressing WT or 3M AβPP were treated with 5μM, 10μM, or 20μM oligomycin for 4 h. D) Cells were stained with TMRE and Hoechst for 30 min. Fluorescent images were captured, and intensity was normalized to total cell number. Data indicate average and standard error. E) Media was collected, and protein extracted. Samples were incubated in an Aβ42 ELISA. Data were normalized to protein content and control samples. Data indicate average and standard error. F) Correlation of mitochondrial membrane potential with secreted Aβ42 in cells expressing either WT or 3M AβPP and treated with different concentrations of oligomycin. *p < 0.05, **p < 0.005, ***p < 0.0005, ****p < 0.0001.
An oligomycin-induced hyperpolarization of the mitochondrial membrane potential was achieved in SH-SY5Y cells expressing either WT or 3M AβPP (Fig. 4D). Similar to what we show in Fig. 2, oligomycin increased Aβ42 secretion in WT AβPP-expressing SH-SY5Y cells (Fig. 4E). However, in 3M AβPP-expressing SH-SY5Y cells none of the oligomycin concentrations tested significantly increased Aβ42 secretion (Fig. 4E). In SH-SY5Y cells treated with different concentrations of oligomycin a significant correlation between mitochondrial membrane potential and Aβ42 secretion was observed with expression of WT AβPP, but not with expression of 3M AβPP (Fig. 4F).
To verify our findings, we differentiated iPSCs into forebrain neurons. Supplementary Figure 3 characterizes the fidelity of our iPSC-derived neurons and shows robust levels of neuronal and synaptic protein markers (GAD67, MAP2, synaptophysin, and Nestin), and very low levels of two glial protein markers, S100β and glial fibrillary associated protein (GFAP) (Supplementary Figure 3). Gene expression analysis showed similar results. Our iPSC-derived neurons have no detectable GFAP mRNA, but high mRNA levels for neuronal markers such as microtubule associated protein 2 (MAP2), Nestin (NES) [29], Paired Box 6 (PAX6) [30], glutamate decarboxylase 1(GAD1) [31], and SOX1 [32, 33] (Supplementary Figure 3). The gene expression pattern observed in our iPSC-derived differentiated neurons is consistent with other published work [26].
iPSC-derived neurons treated with FCCP showed a depolarized mitochondrial membrane potential and reduced Aβ42 secretion (Fig. 5A, B). Similar to what was observed in SY5Y cells, intracellular Aβ40 and Aβ42 levels were higher, with unchanged Aβ42/Aβ40 (Fig. 5C). iPSC-derived neurons treated with oligomycin showed mitochondrial membrane potential hyperpolarization, increased Aβ42 secretion, and an increased medium Aβ42/Aβ40 ratio (Fig. 5D, E). Similar to what was observed in SY5Y cells, intracellular Aβ42 and Aβ42/Aβ40 levels were lower (Fig. 5F). In these cells, mtDNA depletion accomplished through seven days of exposure to ethidium bromide caused mitochondrial membrane potential depolarization (Fig. 5G, H). mtDNA-depleted iPSC neurons had reduced Aβ40 and Aβ42 secretion, and an increased Aβ42/Aβ40 ratio (Fig. 5I). Similar to what was observed in SY5Y cells, intracellular Aβ40, Aβ42, and Aβ42/Aβ40 levels were higher (Fig. 5J). A positive correlation between mitochondrial membrane potential and Aβ42 secretion was observed in this model (Fig. 5K). No changes to BACE1 expression were observed in the iPSC derived neuronal models (data not shown). Taken together, our findings from SH-SY5Y cells and iPSC-derived neurons suggest a relationship in which mitochondrial activity determines AβPP targeting and, subsequently, Aβ secretion (Fig. 6).
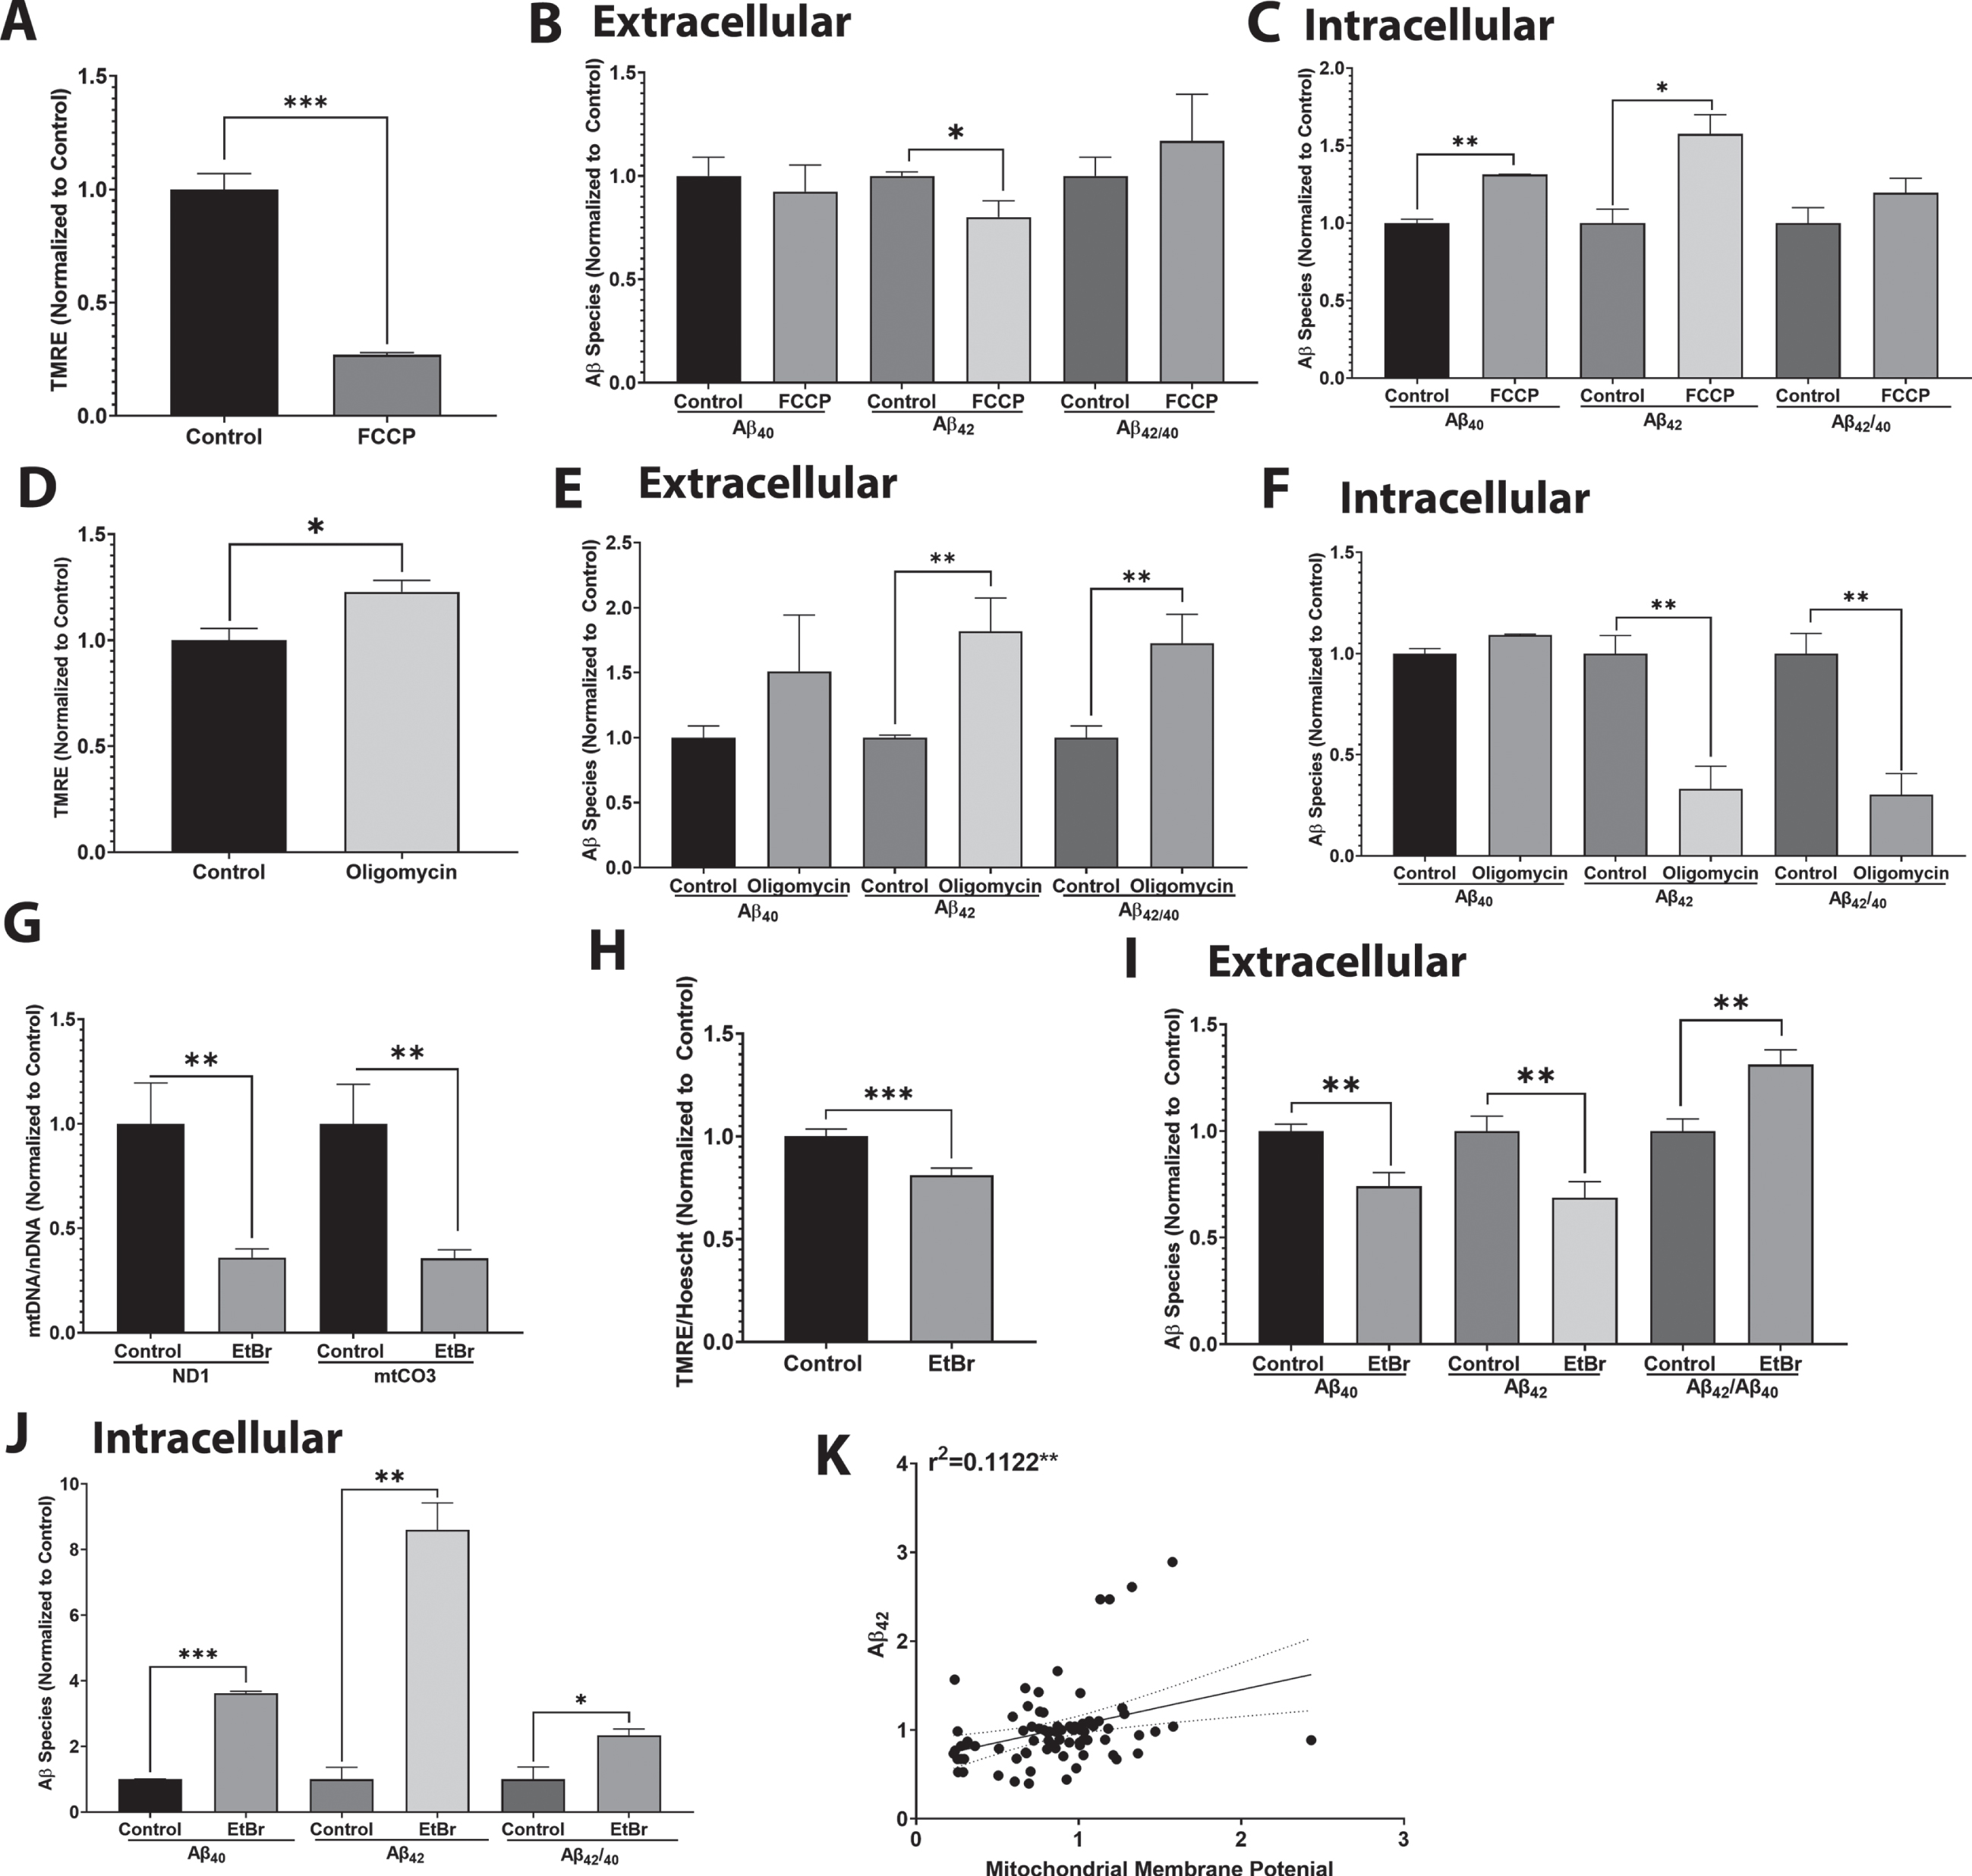
Mitochondrial membrane potential affects Aβ40 and Aβ42 secretion in iPSC-derived neurons. For A–C, iPSC derived neurons were treated with 20μM FCCP for 4 h. A) Cells stained with TMRE and Hoechst for 30 min. Fluorescent images were captured, and intensity was normalized to total cell number. Numbers indicate average and standard error. B) Media was collected, and protein extracted. Samples were incubated in either Aβ40 or Aβ42 ELISAs. Data were normalized to protein content and control samples. Data indicate average and standard error. C) Whole cell lysate samples were incubated in either an Aβ40 or Aβ42 ELISA. Data were normalized to protein content and control samples. Data indicate average and standard error. For D-F, iPSC-derived neurons were treated with 20μM oligomycin for 4 h. D) Cells stained with TMRE and Hoechst for 30 min. Fluorescent images were captured, and intensity was normalized to total cell number. Data indicate average and standard error. E) Media was collected, and protein extracted. Samples were incubated in either Aβ40 or Aβ42 ELISAs. Data were normalized to protein content and control samples. Data indicate average and standard error. F) Whole cell lysate samples were incubated in either an Aβ40 or Aβ42 ELISA. Data were normalized to protein content and control samples. Data indicate average and standard error. For G–J, iPSC-derived neurons were treated with 100 ng/mL ethidium bromide for seven days. G) DNA was isolated, and qPCR completed against 18S, ND1, and mtCO3. Data indicate average and standard error. H) Cells stained with TMRE and Hoechst for 30 min. Fluorescent images were captured, and intensity was normalized to total cell number. Data indicate average and standard error. I) Media was collected, and protein extracted. Samples were incubated in either an Aβ40 or Aβ42 ELISA. Data were normalized to protein content and control samples. Data indicate average and standard error. J) Whole cell lysate samples were incubated in either an Aβ40 or Aβ42 ELISA. Data were normalized to protein content and control samples. Data indicate average and standard error. K) Correlation of mitochondrial membrane potential and Aβ42 secretion in iPSC neurons. *p < 0.05, **p < 0.005, ***p < 0.0005.
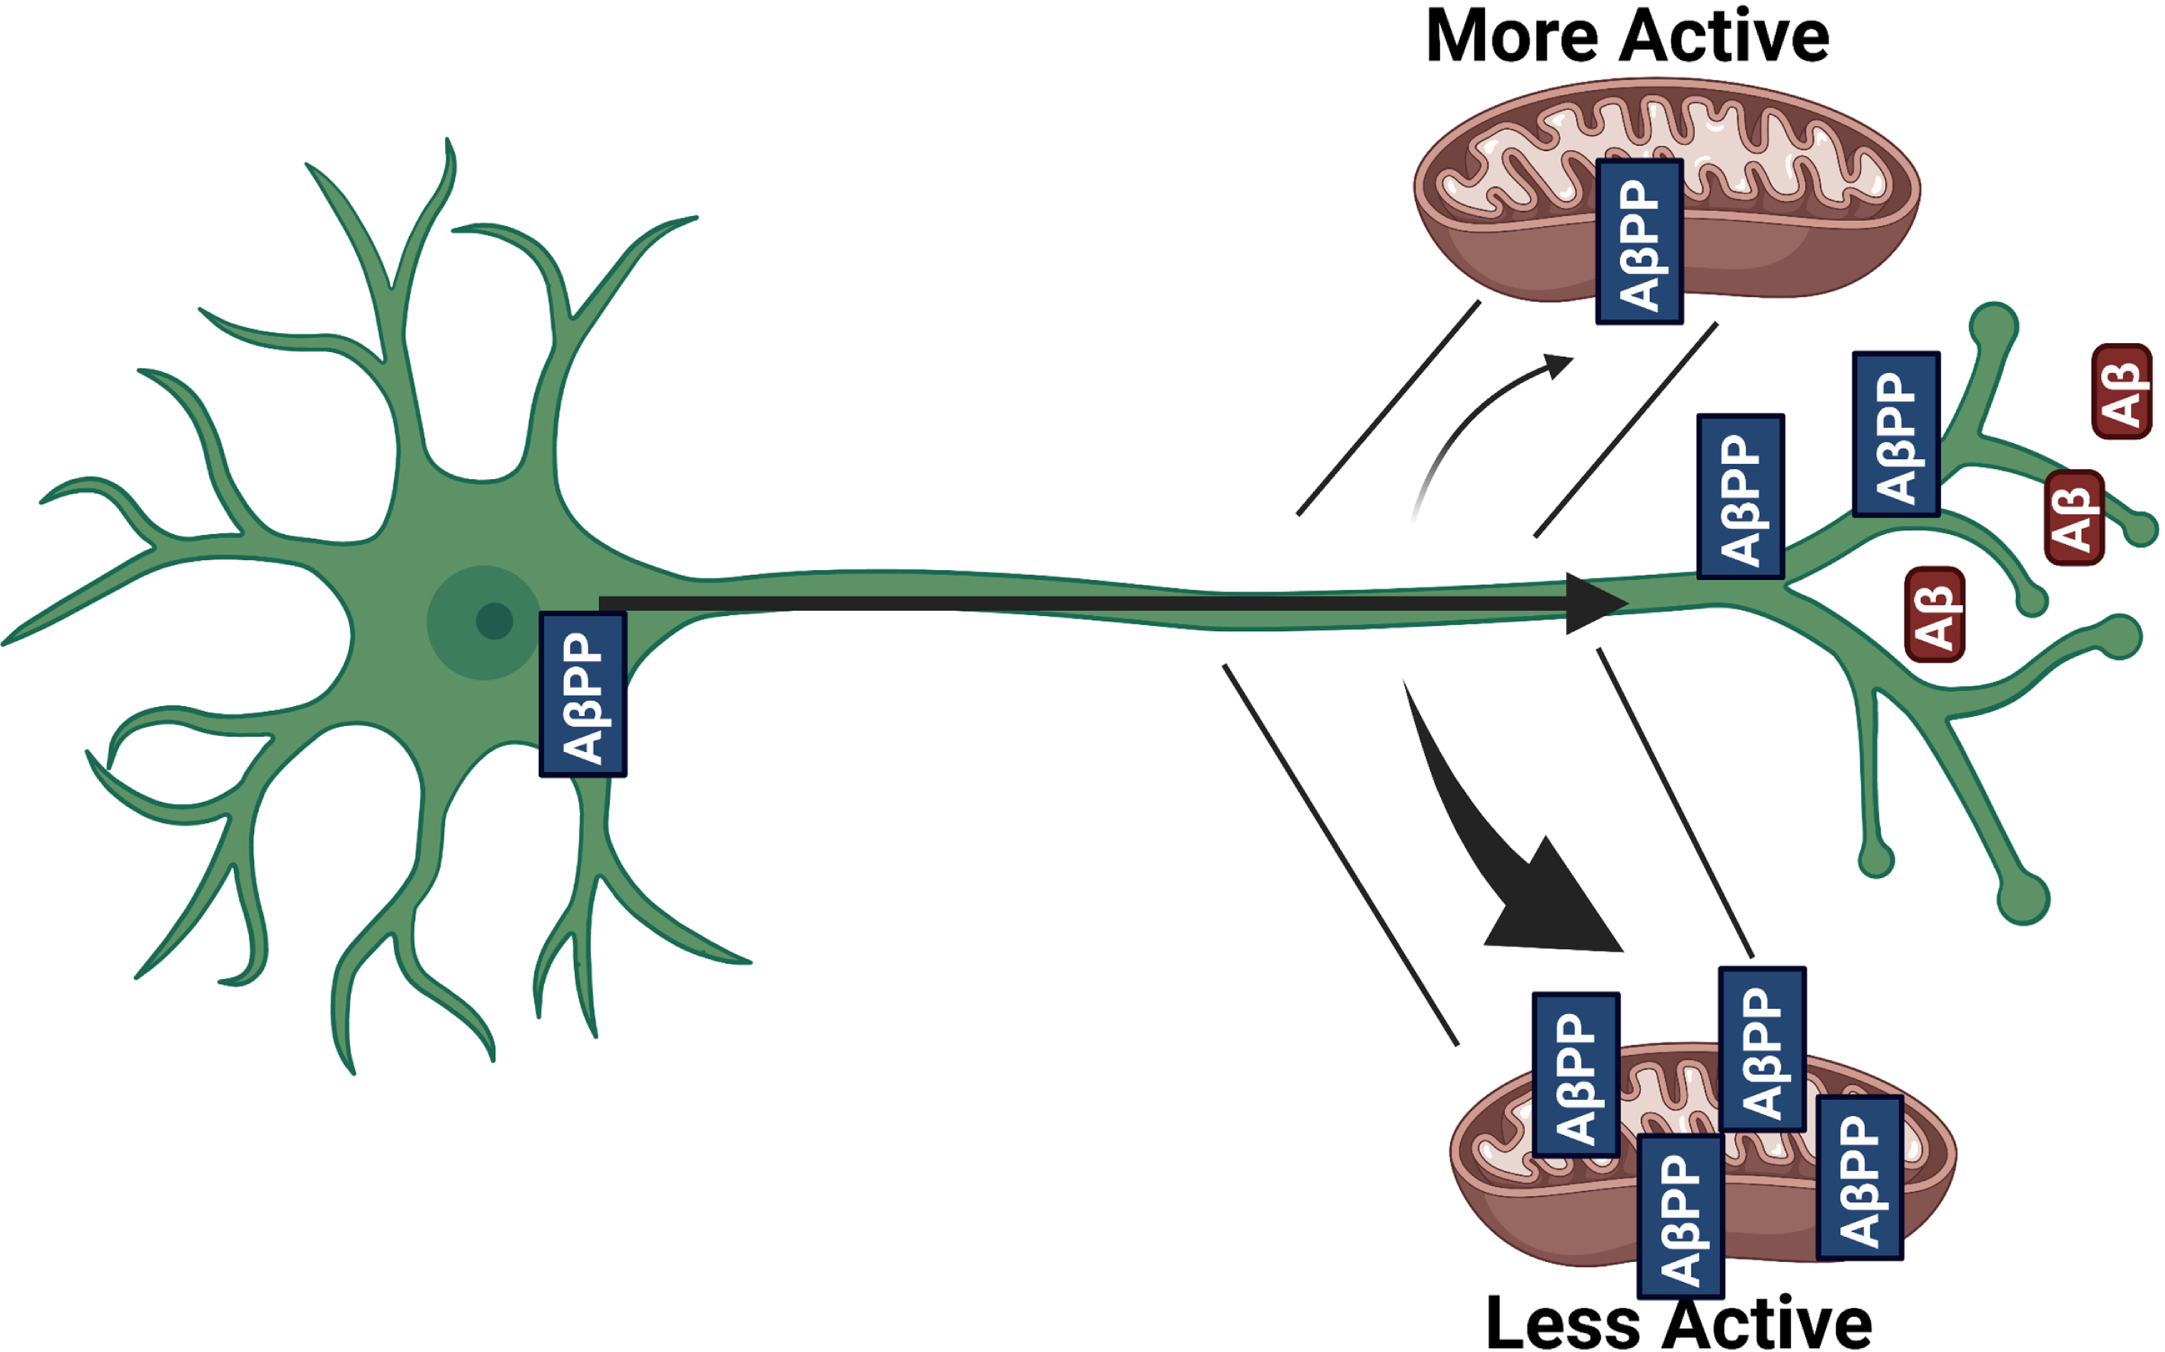
Schematic overview of findings. When mitochondrial activity (or membrane potential) is high there is reduced localization of AβPP to mitochondria and more Aβ production. When mitochondrial activity (or membrane potential) is low there is increased localization of AβPP to the mitochondria and reduced Aβ production. Created with biorender.com.
DISCUSSION
Prior studies found relationships exist between mitochondrial function and AβPP processing [4, 34–39]. Collectively, these studies provide a conflicting picture of what drives interactions between mitochondrial function, AβPP, and Aβ. Mouse models that feature perturbed mtDNA, generated either by targeting an endonuclease to the mitochondria or expressing a mutant version of the mtDNA polymerase γ, show opposite effects on Aβ production and deposition. Targeting an endonuclease to mitochondria, which cleaves mtDNA and reduces the number of intact mtDNA molecules, led to a reduction in brain Aβ plaques [39]. Conversly, expression of the D257A mtDNA polymerase γ mutation in mice, which causes the accumulation of mtDNA mutations and accelerated aging, increased brain Aβ burden [38]. In a separate mouse model, knockout of COX10, a farnesyltransferase required for COX assembly and function, also reduced brain fibrillar Aβ [35]. Because of these findings and other in vitro work [3, 40], we sought to determine which facet of mitochondrial function could best predict Aβ levels.
Using SH-SY5Y neuronal cells and iPSC-derived neurons we found that mitochondrial membrane potential predictably modulates Aβ secretion and intracellular Aβ accumulation. With mitochondrial membrane depolarization Aβ secretion declines and intracellular Aβ increases. Conversely, with mitochondrial membrane hyperpolarization Aβ secretion increases and intracellular Aβ decreases. Mitochondrial membrane potential did not predictably affect BACE1 expression. Protein expression does not correlate with functional levels, and this should be noted.
Mitochondrial membrane potential also predictably affects mitochondrial AβPP targeting. With mitochondrial membrane depolarization more AβPP localizes to mitochondria, and with mitochondrial membrane hyperpolarization less AβPP localizes to mitochondria. Our mitochondrial isolation protocols used trypsin to digest any proteins that were not within mitochondrial membranes, so our findings are unlikely to reflect contamination by non-mitochondrial proteins. An inverse correlation between mitochondrial AβPP and Aβ secretion was evident. These findings are of interest because studies of postmortem AD brains show increased amounts of mitochondrial AβPP [5, 41].
We also observed an inverse correlation between mitochondrial membrane potential and plasma membrane potential. Our data show that altering mitochondrial membrane potential affects plasma membrane potentiation. Through this relationship mitochondrial membrane potential could regulate synaptic function and ultimately Aβ secretion.
We further found that AβPP localization to mitochondria influenced the relationship between mitochondrial membrane potential and Aβ production. Altering the mitochondrial membrane potential minimally affected Aβ secretion in cells expressing 3M AβPP, which lacks a functional AβPP mitochondrial targeting sequence. Overall, AβPP localization appears critical to the relationship between mitochondrial membrane potential and Aβ secretion.
Positively charged amino acid motifs direct cytosol-generated proteins to negatively charged mitochondria [42]. It may, therefore, seem counterintuitive that depolarized mitochondria contain more AβPP than hyperpolarized mitochondria. Our study did not determine the route through which AβPP arrives at the organelle; we do not know whether it directly transfers from the endoplasmic reticulum or through endosomal transport. This is potentially relevant because endosomes move AβPP through the cell [43, 44], genetic studies implicate a role for endosome function in AD [45], and mitochondria influence endosome pathway dynamics [46]. It is also possible the AβPP overexpression approach we utilized somehow affected compartmentalization in SH-SY5Y cells, although our SH-SY5Y cell and iPSC neuron data were consistent, and our iPSC neuron experiments did not feature AβPP overexpression.
While it is tempting to speculate a physiologic role for mitochondrial AβPP, we cannot at this time clarify that role although other studies suggest it perturbs rather than preserves mitochondrial integrity [2, 47]. Some of those studies report the AβPP acidic domain arrests its full import [5], but we detected mitochondrial AβPP even after treating our mitochondrial isolates with trypsin. It therefore seems reasonable to consider the possibility that mitochondria entirely internalize at least some AβPP.
Aβ levels and Aβ42/Aβ40 ratios, measured in CSF and more recently in plasma, constitute the basis for a commonly used AD biomarker. The presence of reduced total CSF Aβ or low CSF Aβ42, or a low Aβ42/Aβ40 ratio in plasma, predicts the presence of brain amyloid plaques which in turn infers AD or at least a state of “Alzheimer’s continuum” [23, 24]. A popular explanation for AD-associated Aβ fluid level changes is that as plaques form in the brain they absorb secreted Aβ and especially the less soluble Aβ42 species, with a subsequent reduction in fluid Aβ and particularly Aβ42 [16, 17]. Our data indicate other factors, especially factors pertinent to mitochondrial function, may also contribute to this phenomenon. Our data suggest a model in which in the presence of bioenergetically active mitochondria, AβPP targeting facilitates the release or generation of extracellular Aβ, and in the presence of bioenergetically inactive mitochondria AβPP preferentially targets the mitochondria, and this secondarily reduces Aβ extracellular release or generation. This model is consistent with current depictions of mitochondrial-AβPP physical interactions, data showing excess mitochondrial AβPP and Aβ accumulation in AD brains [2, 48], transgenic mouse studies that show mitochondrial integrity and function alters Aβ plaque deposition [35, 49–52], transgenic mouse studies that indicate synaptic activity influences Aβ plaque deposition [53–57], human studies that show sleep-related fluctuations in CSF and parenchymal Aβ [58, 59], and a human study that shows interstitial Aβ levels fall during coma and rise with coma resolution [60].
We used two approaches to induce mitochondrial depolarization, mtDNA depletion, and FCCP. The Aβ42/Aβ40 ratio increased with mtDNA depletion and decreased with FCCP. This suggests other parameters that associate with a particular change in mitochondrial function additionally influence AβPP biology. In addition to providing potential insight into shifting Aβ42/Aβ40 ratios in AD, this raises questions about the genesis and etiology of reduced plasma Aβ42/Aβ40 ratios in AD individuals [18]. Specifically, in AD individuals changes in mitochondrial function and integrity exist beyond the brain and extend to at least some blood cells that also contain AβPP [14, 62]. It seems necessary to consider the possibility that a reduced plasma Aβ42/Aβ40 ratio directly reflects a change in AβPP biology outside the brain, which then indirectly rather than directly reflects changes in brain AβPP biology.
Finally, our data suggest Aβ or Aβ42/Aβ40 ratios may serve as a biomarker of mitochondrial function or integrity. AD therapeutic development efforts appear increasingly open to the idea of targeting mitochondrial function [63], and previously reported relevant clinical studies utilized fluid and imaging-based mitochondrial endpoints [64, 65]. This aspect of biomarker development, though, will no doubt undergo further maturation. Based on the findings we now report, we predict interventions that enhance mitochondrial function will increase fluid Aβ levels and Aβ42/Aβ40 ratios.
Footnotes
ACKNOWLEDGMENTS
This study was supported by the Peg McLaughlin fund, the University of Kansas Alzheimer’s Disease Center P30AG035982, and R00AG056600. The Electron Microscope Research Laboratory is supported, in part, by NIH/NIGMS COBRE grant 5P30GM122731. The JEOL JEM-1400 transmission electron microscope was purchased with funds from NIH grant 1S10RR027564.