
Abstract
Background:
The neurophysiological correlates of cognitive and motor symptoms in prodromal and overt dementia with Lewy bodies (DLB) are still to be elucidated.
Objective:
To evaluate if cognitive and motor features of patients with prodromal and overt DLB are associated with the impairment of specific neurotransmitter circuits, evaluated in vivo with transcranial magnetic stimulation (TMS).
Methods:
Fifty-one patients with DLB (twenty-five prodromal; twenty-six with dementia) underwent neuropsychological and clinical evaluation, with twenty-five patients having at least one follow-up evaluation. All patients were assessed with TMS at baseline, with protocols assessing cholinergic circuits (short latency afferent inhibition, SAI), GABAergic circuits (short interval intracortical inhibition, SICI), and glutamatergic circuits (intracortical facilitation, ICF).
Results:
Compared to HC, SICI, ICF, and SAI resulted significantly impaired in both prodromal and overt DLB, with the latter showing a reduced SICI and SAI also compared to prodromal DLB. There was a significant correlation between motor deficits, evaluated with the UPDRS-III, and the impairment of GABAergic (SICI) (r = 0.729, p < 0.001) and glutamatergic (ICF) (r –0.608, p < 0.001) circuits; global cognition, evaluated with the Mini-Mental State Examination, correlated with the impairment of cholinergic (SAI) circuits (r=–0.738, p < 0.001). Worsening of cognitive functions at follow-up was associated with reduced cholinergic functions at baseline (R2 = 0.53, p < 0.001).
Conclusion:
These results suggest that motor and cognitive dysfunctions in prodromal and overt DLB depend on specific and independent neurotransmitter circuits.
Keywords
INTRODUCTION
Dementia with Lewy bodies (DLB) is the second most frequent cause of progressive adult onset dementia [1] and is characterized by cognitive decline associated with different combinations of the core clinical characteristics of parkinsonism, REM sleep behavior disorder (RBD), fluctuations in alertness, and visual hallucinations [2]. Prodromal DLB refers to a predementia stage in which α-synuclein aggregation variably progresses several years before the onset of overt dementia [3, 4]. This stage is distinguished by a combination of motor signs and symptoms, autonomic dysfunction, RBD, and cognitive/behavioral disturbances [5], which may antedate dementia onset by more than 15 years, with a general conservation of functional independence with negligible disruption in day-to-day abilities [6].
As in Parkinson’s disease (PD), the degeneration which affects dopaminergic nigrostriatal projection neurons induces extensive changes in the functioning of cortico-basal ganglia motor loops, resulting in a dysfunctional motor output [7]. This has been associated with changes in motor cortex activity [8], secondary to alterations of both inhibitory and excitatory intracortical circuits which substantially depend on GABAergic and glutamatergic circuits, respectively [9]. In addition to motor symptoms, cholinergic deficits seem to be pivotal for the establishment of cognitive impairment in DLB, which seem to emerge as a result of cortical deafferentation secondary to the deterioration of projection fibers from the basal forebrain [10].
While these changes inevitably occur in the dementia phase of DLB, it is still unclear if these alterations arise before the onset of overt dementia and may be identifiable in the prodromal stage of the disease. This has steadily prevented a simple staging of DLB and has caused considerable difficulties in speculating the progression of the disorder, bearing in mind that the pace of functional decline may differ between subjects [11]. As expected, biomarkers of disease intensity and progression are fundamental for counselling patients and caregivers, for assessing future disease modifying therapies in similar cohorts, and to improve our understanding of the disease pathophysiology.
In the past decades, several neurophysiological techniques using transcranial magnetic stimulation (TMS) have been developed to indirectly assess several intracortical excitability measures, which have been shown to depend on specific neurotransmitters [12]. In DLB, TMS studies have shown an impairment in short interval intracortical inhibition and facilitation, and short latency afferent inhibition [13–20], which partly rely on GABAergic, glutamatergic, and cholinergic circuits, respectively [21]. However, these measures have not been extensively evaluated in the prodromal phase of DLB, and it is still unknown if the spectrum of different motor and cognitive symptoms are dependent on the impairment of specific intracortical excitability measures.
In the present study, we intended to assess intracortical excitability abnormalities in both prodromal and overt DLB, and to evaluate if TMS intracortical excitability measures could forecast the pace of both motor and cognitive decline at follow-up.
METHODS
Subjects
In the current analysis, we recruited subjects with prodromal DLB or overt DLB, in accordance with current clinical criteria [2, 4], from the Neurology Unit, Department of Clinical and Experimental Sciences, University of Brescia, Italy. In addition, a cohort of age-matched healthy controls (HC) were included.
Routine blood analyses, magnetic resonance imaging (MRI), and [123I]FP-CIT SPECT imaging were performed in all patients. A subgroup of patients underwent cerebrospinal fluid (CSF) analysis, including Aβ1-42, total-tau, and phopsho-tau181 (n = 14), as previously reported [22]. Orthostatic hypotension was evaluated with the “sit-to-stand test” [23].
We applied the following exclusion criteria: a) other causes of cognitive deficits or dementia other than DLB; b) cortical or subcortical lesions, or iron accumulation at MRI; c) additional neurological disease or medical disorders possibly related with cognitive decline; d) psychiatric or other neurological illnesses; e) recent traumatic event or acute fever.
At baseline, a standardized neurological examination was carried out, including the Movement Disorder Society-Unified Parkinson Disease Rating Scale, part III (UPDRS-III) [24], a full neuropsychological assessment including the Mini-Mental State Examination (MMSE), digit span forward and backward, the short story recall test, the Rey complex figure (copy and recall), phonemic and semantic fluencies, the clock-drawing test, and the trail-making test (part A and part B), and an evaluation of basic and instrumental activities of daily living [25, 26]. A subset of patients also underwent a clinical follow-up in order to evaluate cognitive, behavioral, and motor progression and/or conversion to dementia for prodromal cases (n = 25, of whom n = 14 prodromal DLB and n = 11 overt DLB).
HCs reported no cognitive complaints, with normal scores at the MMSE (≥27/30) and no history of psychiatric or neurological diseases.
Exclusion criteria included the following: a) past history of head injury, abuse of alcoholic substances, transient ischemic attack or stroke, epilepsy or medical disorders causing cognitive decline; b) ongoing usage of drugs that could influence TMS measures, c) having a pacemaker or any cardiac device, cochlear implants, or past surgery to the brain, such as cerebral aneurysm clipping.
All participants signed a written informed consent according to the Declaration of Helsinki. The local ethics committee of the ASST Spedali Civili di Brescia approved the study protocol.
Transcranial magnetic stimulation parameters
A figure-of-eight coil (with a diameter of 70 mm for each loop) connected to a Magstim Bistim2 apparatus (Magstim Company, Oxford, UK), was used to perform TMS, as already reported [27]. The current waveform of the magnetic stimuli was monophasic (100μs of rise time, returning back to 0 after 800μs). We recorded motor evoked potentials (MEPs) from the right first dorsal interosseous muscle (FDI) by applying surface electrodes (Ag/AgCl) placed in a belly-tendon montage, which were recorded using a Biopac MP-150 electromyograph (BIOPAC Systems Inc., Santa Barbara, CA, USA). The TMS coil was located roughly 2 cm anteriorly and 4 cm laterally to Cz, tangentially to the scalp with the coil handle pointed 45° laterally and posteriorly to the sagittal plane to detect the exact position of the target muscle on the contralateral primary motor cortex. We defined the “hot spot” as the location in which magnetic stimulation caused the largest MEP with minimal stimulator power. To acquire this, we gradually intensified stimulator power from 35% of the maximal stimulator output (MSO) in steps of 5% until we could record MEPs with roughly 0.7–1 mV amplitude. The position of the coil was changed 0.5 cm posteriorly, anteriorly, medially, and laterally, while evoking 3 MEPs at every location. When the site with the highest MEP was found, a felt tip pen was used to mark the position on the scalp to ensure a consistent positioning of the coil for the duration of the assessment [28].
We defined resting motor threshold (RMT) as the minimal stimulus intensity required to induce MEPs with at least 50μV amplitude, in 50% of 10 successive tests with full muscle relaxation, which was ensured by visually inspecting the lack of EMG activity at high-gain amplification. The relative frequency method was used to determine RMT, in which a starting stimulus intensity of 35% MSO was used, with the coil located above the motor “hot spot”, and the stimulus power was slowly intensified in steps of 5% MSO until TMS persistently induced MEPs with > 50μV peak-to-peak amplitudes in each test [29]. Afterwards, stimulus intensity was slowly decreased in steps of 1% MSO until there were < 5 positive responses out of 10 test.
A paired-pulse protocol was used to assess SICI, ICF, and SAI, utilizing a conditioning-test design. The test stimulus (TS) was set to induce a MEP of roughly 1 mv peak-to-peak amplitude, for all paradigms.
For SICI and ICF we set the conditioning stimulus (CS) at 70% of the RMT, applying several interstimulus intervals (SICI: 1, 2, 3 ms; ICF: 7, 10, 15 ms) [30, 31].
SAI was evaluated employing a CS consisting of an isolated pulse of electrical stimulation (200μs) delivered to the median nerve (right wrist), by a bipolar electrode (cathode positioned proximally). The power of the stimulus was sufficient to induce a visible twitch of the thenar muscles [32]. Several ISIs were implemented (0, +4 ms), which were defined in relation to the maximum latency of the N20 component of the median nerve somatosensory evoked potential.
For each ISI and for each protocol (SICI, ICF, and SAI), 10 different paired CS-TS and control TS were delivered in all participants in a pseudo randomized sequence, with an inter-trial interval of 5 s (±10%).
The amplitude of the conditioned MEP, induced after applying a paired CS-TS, was reported as ratio of the average control MEP amplitude. A randomized order was adopted for all stimulation protocols. We provided audio-visual feedback to confirm muscle relaxation throughout the whole testing session and trials were rejected if the amplitude at EMG was greater than 25μV before administering TMS pulses. We discarded < 5% of trials for each protocol. All participants could follow instructions correctly as well as achieving absolute muscle relaxation. If the data was extensively altered by muscle contraction, the protocol was recommenced, and the preliminary recording was discarded.
TMS administration by the operator was blinded to the subjects’ stage and TMS application was systematized for all patients, with stimuli being delivered in a randomized sequence, consequently reducing possible biases in TMS acquisition.
For the objective of the current work, we regarded as potential indicators each of the ensuing parameters: mean SICI (1, 2, 3 ms ISIs), mean ICF (7, 10, 15 ms ISIs), and mean SAI (0, +4 ms ISIs).
Statistical analysis
Clinical characteristics and neurophysiological parameters were compared by applying one-way ANOVA or chi-square test of independence, as appropriate. Post hoc tests with Bonferroni correction for multiple comparisons were conducted to analyze differences between groups when a significant main effect was reached. Assumption of sphericity was checked with Mauchly’s test, while in case of sphericity violation, Greenhouse–Geisser epsilon corrections were applied.
We investigated any correlations between neurophysiological measures, demographic and clinical characteristics of both prodromal and overt DLB (considered as a single group) with Pearson’s correlation coefficient. Subsequently, linear regression analyses were applied to identify the relationship between functional decline and each considered variable, in patients with follow-up evaluations. Lastly, we applied a stepwise multiple regression analysis to characterize the most suitable explanatory variable/s for functional decline. The regression equation for the examples reported in the Results section can be expressed in the following form: predicted ΔMMSE = b0 + (b1×mean SAI); predicted ΔUPDRS-III = b0 + (b1×age) + (b2×mean SICI), where b0 is the intercept (also known as constant) and b1 through b2 are the slope coefficients (one for each variable) [33].
Nomograms were generated with the Python open-source software PyNomo [34]. Statistical significance was assumed at p < 0.05 and corrected for multiple comparisons. SPSS 21.0 software was used for statistical analysis.
RESULTS
Participants
Twenty-five prodromal DLB (age 71.4±6.6), 26 overt DLB (age 73.0±6.1), and 29 age-matched HC (age 71.9±6.1) were enrolled in the current study. Demographic and clinical characteristics are described in Table 1.
Demographic and clinical characteristics of included subjects
Demographic and clinical characteristics, and neurophysiological parameters are expressed as mean±standard deviation; SICI, ICF, LICI and SAI are represented as ratio of mean conditioned and unconditioned (i.e., control) motor evoked potential amplitude. DLB, dementia with Lewy bodies; HC, healthy controls; n, number; F, female; MMSE, Mini-Mental State Examination; UPDRS-III, Unified Parkinson’s Disease Rating Scale part III; TMS, transcranial magnetic stimulation; RTM, resting motor threshold; SICI, mean short interval intracortical inhibition (1, 2, 3 ms) expressed as ratio of unconditioned motor evoked potential; ICF, mean intracortical facilitation (7, 10, 15 ms) expressed as ratio of unconditioned motor evoked potential; SAI, mean short latency afferent inhibition (0, +4 ms) expressed as ratio of unconditioned motor evoked potential; MSO, maximum stimulator output. §CSF analysis performed in a subset of patients (n = 14); *p < 0.05 versus HC; †p < 0.05 versus prodromal DLB, ‡p < 0.05 versus overt DLB using one-way ANOVA or chi-square tests, as appropriate (post hoc tests with Bonferroni correction for multiple comparisons, only after a significant interaction).
Neurophysiological measures in prodromal and overt DLB
SICI, ICF, and SAI are reported in Fig. 1 for each different group. A significant interaction was observed at the one-way ANOVA for SICI [F(2,77) =40.1, p < 0.001, partial η2 = 0.51], ICF [F(2,77) =98.4, p < 0.001, partial η2 = 0.72], and SAI [F(2,77) =56.0, p < 0.001, partial η2 = 0.59]. Post hoc differences between groups, corrected for multiple comparisons, are reported in Fig. 1. In brief, in comparison to HC, SICI, ICF, and SAI resulted significantly impaired in both prodromal and overt DLB, with the latter showing a reduced SICI and SAI also compared to prodromal DLB. We did not observe a significant difference in ICF between prodromal and overt DLB.

Neurophysiological parameters in prodromal DLB, overt DLB, and healthy controls. DLB, dementia with Lewy bodies; SICI, mean short interval intracortical inhibition (ISI 1, 2, 3 ms); ICF, mean intracortical facilitation (ISI 7, 10, 15 ms); SAI, mean short latency afferent inhibition (ISI 0, +4 ms); ISI, interstimulus interval; data are represented as a ratio to the unconditioned motor evoked potential amplitude; error bars represent standard errors. *p < 0.05 post hoc test corrected for multiple comparisons after significant interaction at the one-way ANOVA.
Association of neurophysiological outcomes and clinical features
We assessed the relationship between baseline clinical features and neurophysiological outcomes (i.e., mean SICI, ICF, and SAI) (see Table 2).
Pearson’s correlations between neurophysiological parameters and demographic-clinical characteristics of both prodromal and overt DLB
MMSE, Mini-Mental State Examination; UPDRS-III, Unified Parkinson’s Disease Rating Scale part III; SICI, mean short interval intracortical inhibition (ISI 1, 2, 3 ms); ICF, mean intracortical facilitation (ISI 7, 10, 15 ms); SAI, mean short latency intracortical inhibition (ISI 0, +4 ms); ISI, interstimulus interval; significant values are reported in bold-face.
MMSE scores were significantly associated with SAI (r = –0.738, p < 0.001) (see Fig. 2A), while UPDRS-III scores were significantly associated with SICI (r = 0.729, p < 0.001) (see Fig. 2B) and ICF (r = –0.608, p < 0.001) (see Fig. 2C). Neurophysiological measures were independent of age and disease duration (see Table 2). We did not observe significant associations between TMS measures, CSF analytes, and orthostatic hypotension.

Significant associations between A) SAI and MMSE scores, B) SICI and UPDRS-III scores, and C) ICF and UPDRS-III scores. DLB, dementia with Lewy bodies; SICI, mean short interval intracortical inhibition (ISI 1, 2, 3 ms); ICF, mean intracortical facilitation (ISI 7, 10, 15 ms); SAI, mean short latency afferent inhibition (ISI 0, +4 ms); ISI, interstimulus interval; MMSE, Mini-Mental State Examination; UPDRS-III, Unified Parkinson’s Disease Rating Scale; data are represented as a ratio to the unconditioned motor evoked potential amplitude.
Prediction of functional decline with neurophysiological outcomes
We applied a linear regression analysis to discern the effect of demographic, clinical, and neurophysiological outcomes on functional decline, assessed with the ΔMMSE and ΔUPDRS-III scores at 1 year follow-up compared to baseline. This was assessed in participants with a follow-up evaluation (n = 25, of which n = 14 prodromal DLB and n = 11 overt DLB).
For ΔMMSE scores, at the multiple regression analysis, counting all variables with a p < 0.100 at univariate analysis, only SAI (β= –11.04, p < 0.001) significantly predicted cognitive decline at 1-year follow-up (p < 0.001, adjusted R2 = 0.53) (see Table 3). Including only SAI in the linear regression analysis model, it accounted for 64.3% of the variation in ΔMMSE scores at 1 year with an adjusted R2 = 0.63, a large effect size in accordance with Cohen [35]. Accordingly, the projected functional decline at 1 year may be computed with the formula: projected ΔMMSE at 1 year = 5.93 + (–11.40×mean SAI). For instance, with an average SAI of 0.60, there will be a projected decrease in MMSE scores of –0.9 (95% CI, –1.9 to 0.0) points every year; with an average SAI of 0.8 a projected decrease of –3.2 (95% CI –3.8 to –2.5) points every year, while with an average SAI of 1.0 a projected decrease of –5.5 (95% CI –6.5 to –4.5) points every year (see Fig. 3).
Univariate linear regression model and multivariate regression model for predictors of functional decline (ΔMMSE and ΔUPDRS-III scores at 1 year compared to baseline)
ΔMMSE, Mini-Mental State Examination difference at 1-year follow-up; ΔUPDRS-III, Unified Parkinson’s Disease Rating Scale part III difference at 1-year follow-up; RMT, resting motor threshold; MSO, percentage of maximal stimulator output; SICI, mean short interval intracortical inhibition (ISI 1, 2, 3 ms); ICF, mean intracortical facilitation (ISI 7, 10, 15 ms); SAI, mean short latency afferent inhibition (ISI 0, +4 ms); ISI, interstimulus interval; B, unstandardized regression coefficient; SE B , standard error of the coefficient; β, standardized coefficient.
For ΔUPDRS-III scores, at the multiple regression analysis, including all variables with a p < 0.100 at univariate analysis, both age (β= 0.31, p = 0.045) and SICI (β= 6.99, p = 0.012) significantly predicted motor deterioration at 1-year follow-up (p = 0.001, adjusted R2 = 0.52) (see Table 3). Including age and SICI in the linear regression analysis model, it accounted for 54.9% of the variation in ΔUPDRS-III scores at 1 year with an adjusted R2 = 0.55, a large effect size in accordance with Cohen [35]. Accordingly, the projected motor decline at 1 year may be computed with the formula: projected ΔUPDRS-III at 1 year = –24.68 + (0.31 × age) + (6.94×mean SICI).
For example, for a 70-year-old patient with a mean SICI of 0.80, there will be a projected increase in UPDRS-III scores of 1.9 (95% CI, –0.1 to 3.8) points per year; for an 80-year-old patient with a mean SICI of 0.90, a predicted increase of 4.6 (95% CI 2.3 to 6.9) points every year (see Fig. 3).
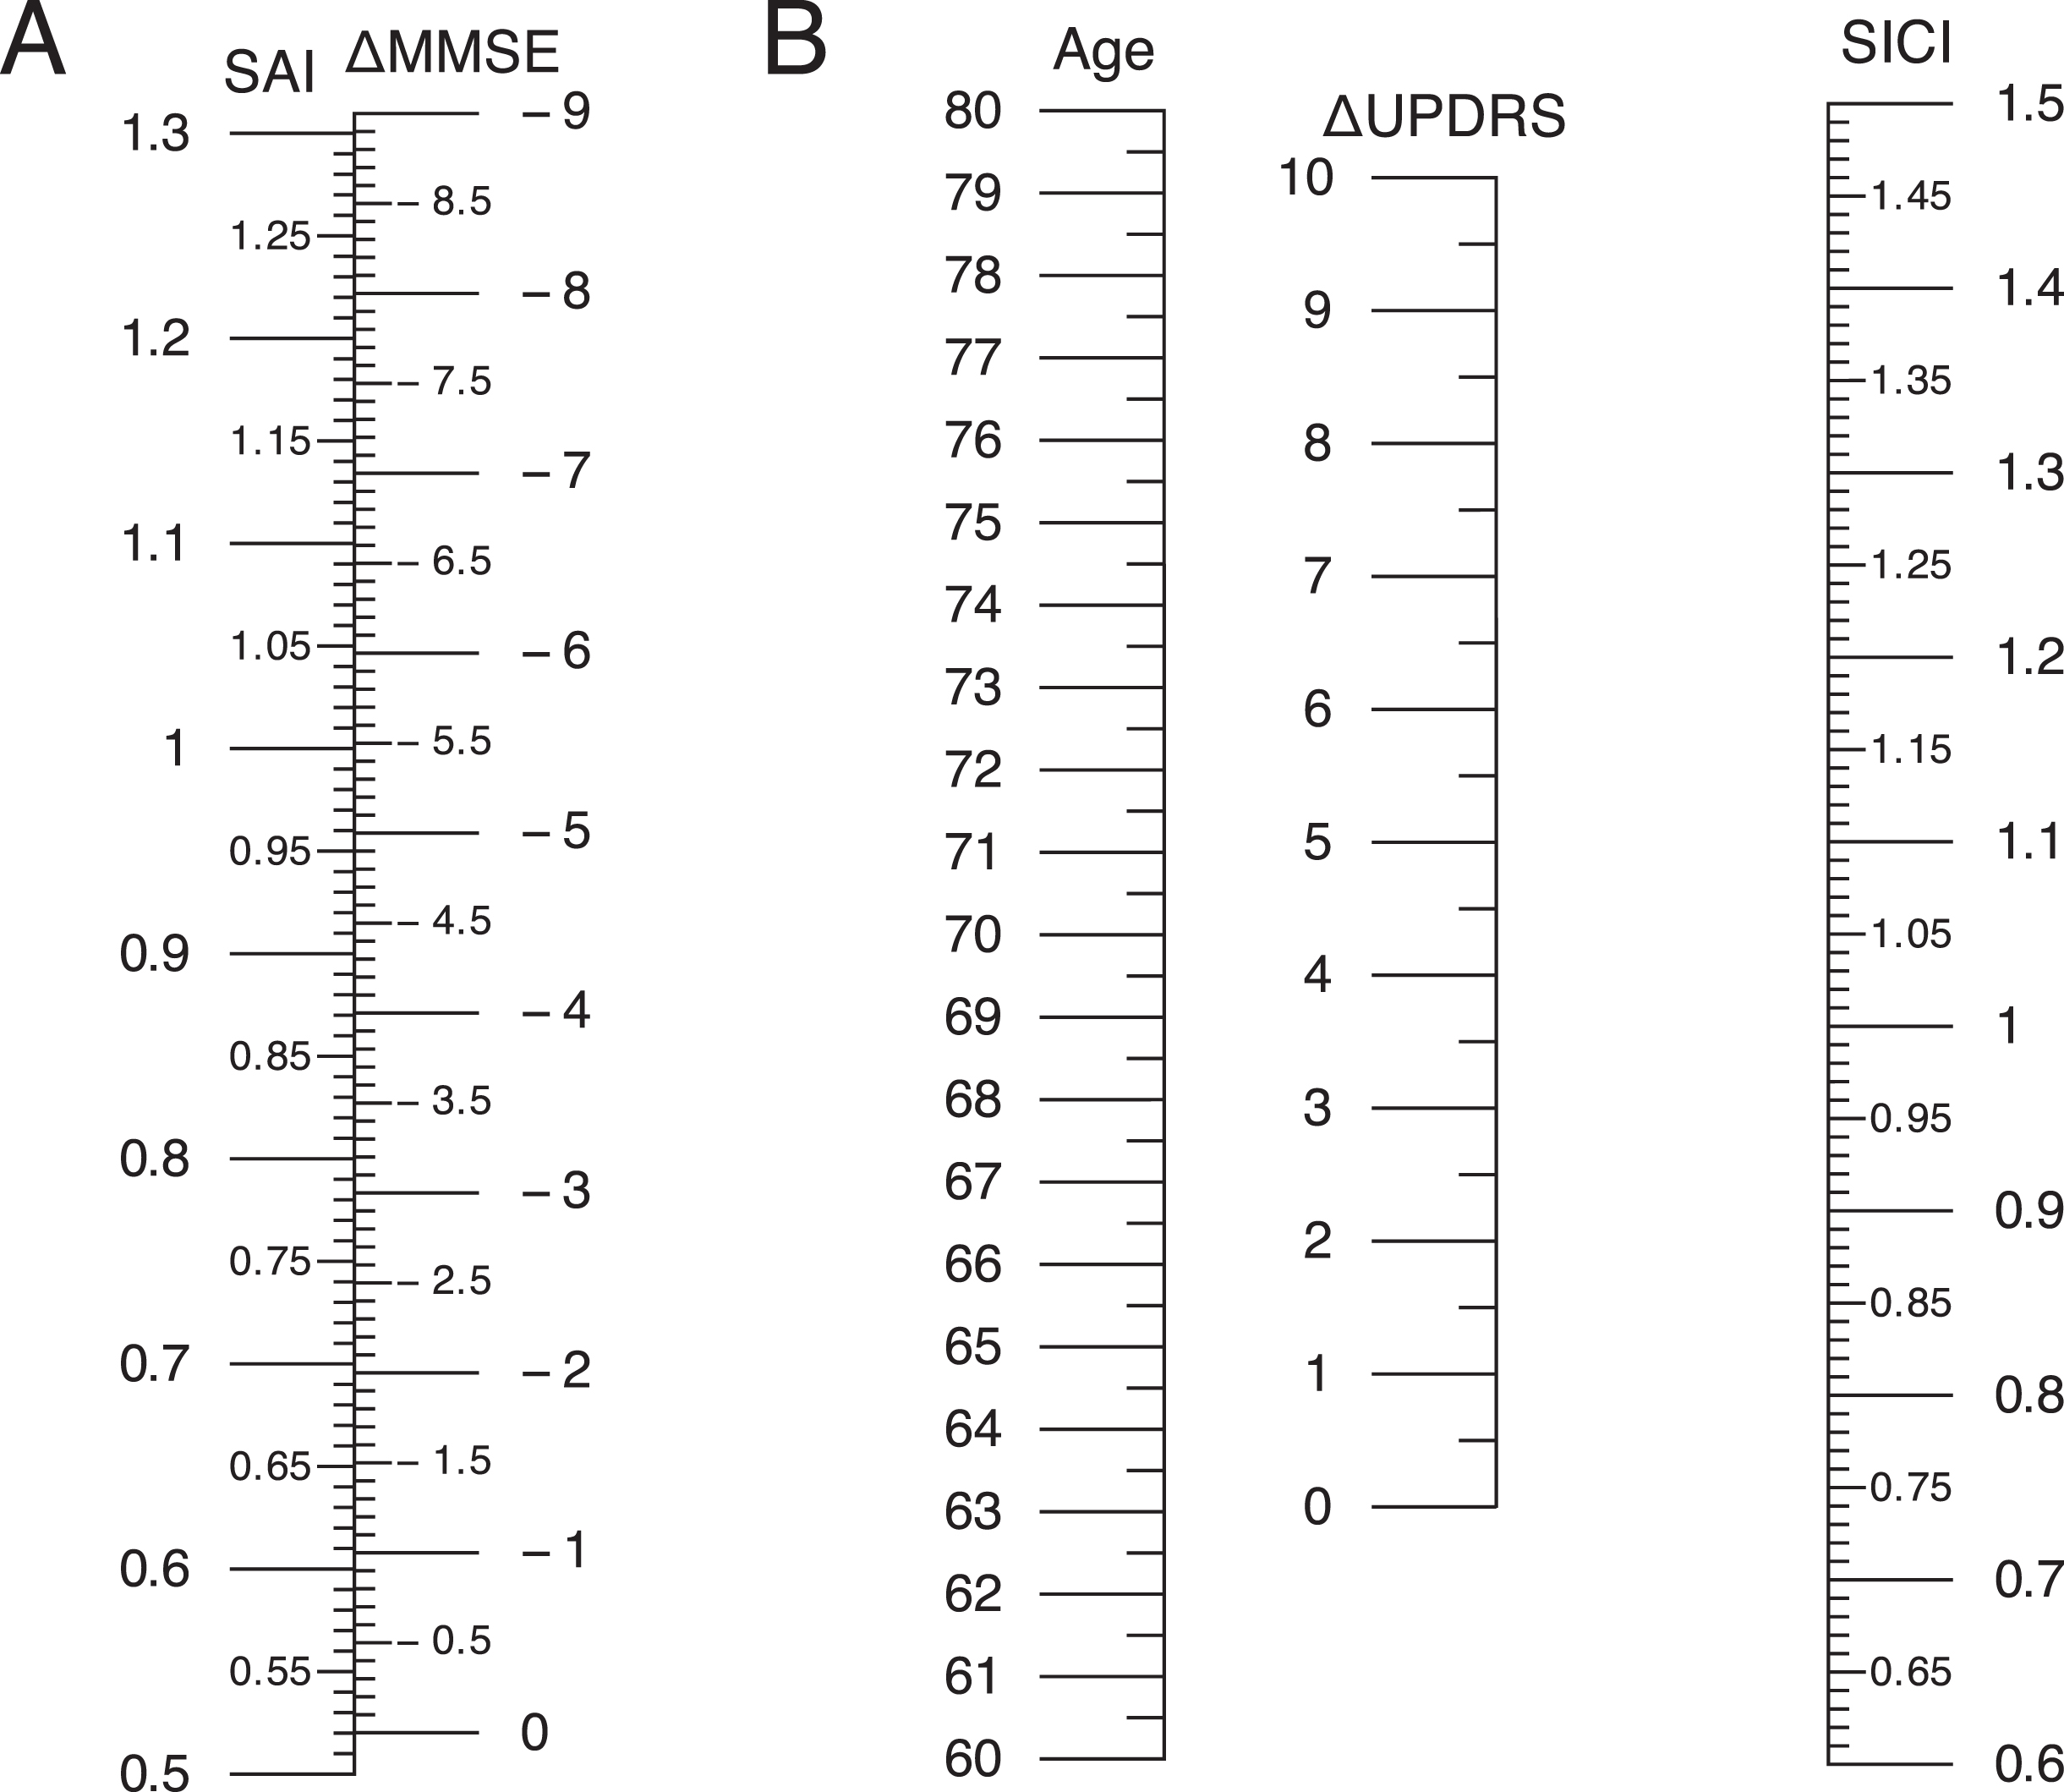
Nomograms for predicted values of A) ΔMMSE and B) ΔUPDRS-III scores at 1 year according to baseline parameters. For B), scores are obtained by intersection of a line through both age and SICI values. SICI, mean short interval intracortical inhibition (ISI 1, 2, 3 ms); SAI, mean short latency afferent inhibition (ISI 0, +4 ms); ISI, interstimulus interval; MMSE, Mini-Mental State Examination; UPDRS-III, Unified Parkinson’s Disease Rating Scale.
DISCUSSION
In the present work we found a specific impairment of several neurophysiological measures in both prodromal and overt DLB patients compared to healthy controls. These observations extend previous observations in overt DLB showing an impairment of SICI, ICF, and SAI, which largely, but not exclusively, rely on GABAergic, glutamatergic, and cholinergic circuits, respectively. Moreover, these changes seem to antedate the onset of dementia in patients with prodromal DLB. Importantly, SICI and ICF were reduced compared to HC even in the early prodromal stages with minimal motor impairment. These results propose for an early disinhibition of the motor cortex in the evolution of DLB, possibly even before the onset of motor features. These observations are in line with recent findings in the early phases of PD [9], in which cortical disinhibition, evaluated by reduced SICI, is an early and prominent feature. This could be a collateral outcome of dopamine depletion caused by impaired thalamic inputs to the motor cortex [36, 37] in reaction to dysfunctional basal ganglia output [38]. Indeed, motor impairment, evaluated with the UPDRS-III, positively correlated with the impairment of both SICI and ICF in both prodromal and overt DLB.
As supposed, SAI, which is a marker of cholinergic transmission, was impaired early in the prodromal phase of DLB, with a significant greater impairment in overt DLB. This supports the hypothesis that cholinergic dysfunction is an early feature of DLB [10], even before the onset of overt dementia, reflecting the degree of cognitive impairment, as reported to a minor extent in PD [39, 40] and PD dementia [39, 41]. Moreover, recent neuropathological studies revealed a positive correlation between disease duration prior to dementia and the severity of cortical alpha-synuclein pathology and cholinergic deficits [42]. This could be explained by longstanding substantia nigra degeneration triggering also the deterioration of the nucleus basalis of Meynert, whose trophic preservation depends on the input of dopaminergic ascending pathways [43]. Indeed, global cognition, evaluated with the MMSE, inversely correlated with the impairment of SAI in both prodromal and overt DLB.
The conversion to dementia and, generally speaking, the prediction of functional decline is an important target for clinicians to achieve in clinical setting. In other neurodegenerative diseases such as frontotemporal dementia [44] and Alzheimer’s disease (AD) [45, 46], different TMS measures have been found as good predictors of decline in larger cohorts, respectively SICI and LICI for frontotemporal dementia patients and LTP for AD patients. Predicting the clinical course of the disease or progression in DLB remains problematic and biomarkers of disease intensity and progression are crucial for counselling patients and caregivers, for assessing possible disease modifying treatments in uniform groups, and to increase our understanding of disease pathophysiology.
Only few studies have identified markers of cognitive progression in DLB, identifying specific clinical features or plasma neurofilament light as promising predictors of functional decline [25, 47]. However, several of these observations have not been confirmed, while others have been shown to explain only a minimal difference in disease progression. Conversely, in this work we have found that intracortical excitability measures acquired by TMS may forecast more than 60% of the difference in MMSE scores and more than 50% of UPDRS-III scores at 1 year, showing to be potential valuable indicators of disease progression. However, considering the small sample size adopted in this study, these findings should be taken cautiously and confirmed in larger cohorts. This is of primary relevance for advising patients and caregivers about the pace of functional decline, which is still conjectural in current clinical practice. These finding are also in line with recent data showing that longitudinal Aβ accumulation among patients with DLB could be used to track clinical disease progression [48] and, considering that CSF Aβ levels are reduced in DLB patients [49] and that SAI is associated with CSF Aβ levels in AD patients [50], it could be argued that also in DLB patients amyloid pathology might play a role in driving cognitive impairment.
Parallelly, a recent study has observed a correlation between SAI and both CSF Aβ levels and UPDRS scores in AD patients [51], suggesting that the degeneration of the cholinergic system mediated by amyloid, may account for early AD-related motor impairment. All these findings suggest that TMS measures combined with clinical scales might also aid in the interpretation of the different degree of impairment of the motor pathways in neurodegenerative diseases, as shown by SICI in DLB, while driven by amyloid and shown by an impairment of SAI in AD.
We acknowledge that this study entails some limitations. First, although the diagnosis was supported by MRI and SPECT imaging, we did not have pathological confirmation, particularly in prodromal DLB cases. Secondly, the forecast of functional decline using TMS variables was not carried out on the whole group of DLB patients, and pharmacological effects of anticholinesterase inhibitors or dopaminergic medications were not assessed. Thirdly, we did not evaluate the possible combined effect of TMS measures with a thorough neuropsychological evaluation in predicting cognitive decline. Fourthly, CSF analyses were performed only in a subgroup of patients and correlations were limited by sample size. Lastly, this study was performed in a single center, and larger multicenter studies and with longer follow-up evaluations should confirm these findings.
Notwithstanding, our findings propose that the variance of intracortical excitability measures, assessed indirectly with TMS, is related to a higher disease severity and with a worse prognosis in patients with both prodromal and overt DLB. The assessment of intracortical excitability measures, non-invasively and in vivo using TMS, may provide not only pertinent prognostic knowledge but may be applied in patients’ stratification for clinical trials and to assess the effects of new disease modifying therapies.