
Abstract
Background:
Mild cognitive impairment (MCI) individuals with neuropsychiatric symptoms (NPS) are more likely to develop dementia.
Objective:
We sought to understand the relationship between neuroimaging markers such as tau pathology and cognitive symptoms both with and without the presence of NPS during the prodromal period of Alzheimer’s disease.
Methods:
A total of 151 MCI subjects with tau positron emission tomographic (PET) scanning with 18F AV-1451, amyloid-β (Aβ) PET scanning with florbetapir or florbetaben, magnetic resonance imaging, and cognitive and behavioral evaluations were selected from the Alzheimer’s Disease Neuroimaging Initiative. A 4-group division approach was proposed using amyloid (A–/A+) and behavior (B–/B+) status: A–B–, A–B+, A+B–, and A+B+. Pearson’s correlation test was conducted for each group to examine the association between tau deposition and cognitive performance.
Results:
No statistically significant association between tau deposition and cognitive impairment was found for subjects without behavior symptoms in either the A–B–or A+B–groups after correction for false discovery rate. In contrast, tau deposition was found to be significantly associated with cognitive impairment in entorhinal cortex and temporal pole for the A–B+ group and nearly the whole cerebrum for the A+B+ group.
Conclusion:
Enhanced associations between tauopathy and cognitive impairment are present in MCI subjects with behavior symptoms, which is more prominent in the presence of elevated amyloid pathology. MCI individuals with NPS may thus be at greater risk for further cognitive decline with the increase of tau deposition in comparison to those without NPS.
INTRODUCTION
The prodromal period of Alzheimer’s disease (AD) referred to as mild cognitive impairment (MCI) due to AD is a transitional stage, which provides the opportunity to prevent the further deterioration of disease [1–3]. However, accurate diagnosis of MCI is a complex topic because of its heterogeneity. Widely varying progression rates of the disease may occur within MCI individuals that have diverse clinical symptoms [4]. Recently, MCI diagnosis has been improved by utilizing neuropsychological assessment [5, 6], blood-based biomarkers [7], or considering more than one impaired scores [8]. Among the most prevalent events over the disease course of AD, the specific role of neuropsychiatric symptoms (NPS) during the prodromal MCI period, however, has been relatively understudied.
The clinical symptoms of MCI individuals with NPS have been well characterized in previous observational studies. Depression, apathy, and anxiety are the most frequently observed symptoms in people with MCI due to AD [9, 10]. MCI subjects with behavior symptoms exhibited greater impairment in cognition and daily function compared to those without behavior abnormalities [11]. Across the AD continuum, NPS tend to be more prevalent with the progression of disease stages, and peak in prevalence in the more moderate disease stages [12]. For example, symptoms of delusions and hallucinations, apathy, and sleep problems increased in frequency as disease progresses, and were found to be associated with higher risk of conversion from MCI to dementia [13–15]. The presence of delusions, agitation/aggression, and aberrant motor behavior has been regarded as the predictor of progression from MCI to probable AD [16]. Treating the symptoms such as depression and apathy, on the other hand, could possibly delay the deterioration of the disease [17]. Recently, improved diagnostic accuracy for the MCI individuals has been optimized using multimodal behavioral analysis [18]. These results indicate that MCI individuals with behavior symptoms are more likely to develop dementia, but the biological underpinnings of these observations remain unclear.
While neuroimaging has been widely used in AD research and provided an in vivo window to examine the biological changes such as cortical thickness and misfolded tau and amyloid-β (Aβ) proteins during disease progression, not much is known about the variation of neuroimaging markers in MCI individuals with NPS. Non-AD specific biomarkers such as cortical atrophy, white matter lesions, and connectivity deficits were commonly used in previous studies. For example, frontal cortices were the brain regions whose atrophy was the most associated with NPS in AD patients [19–21]. Abnormal functional connectivity between the frontal regions and amygdala was revealed in AD patients with depression [22]. The increase of NPS such as delusion, hallucination, agitation, depression, and irritability was significantly associated with white matter hyperintensities of the temporal and frontal lobes in subjects with MCI due to AD [23]. Connectivity changes of the superior longitudinal fasciculus between the frontal and temporal/parietal lobe was observed in MCI and AD individuals with NPS [24]. In addition, a limited number of investigations suggested that there was some degree of association between behavior symptoms and AD specific biomarkers such as Aβ plaques [25]. Delusion, apathy, and depression were the most prevalent NPS associated with Aβ plaque burden and neurofibrillary tangles [26]. Strong associations were observed between behavior performance and tau positron emission tomographic (PET) signals in the parietal association area, superior frontal, temporal, and medial occipital lobes of aging and dementia due to AD [27]. While these previous studies provided valuable information about NPS at the moderate to severe stage of AD, there is a lack of detailed characterization of how neuroimaging patterns vary with respect to NPS during the disease progression of MCI patients.
As a systematic approach to organize neuroimaging markers in AD research, the amyloid/tau/neuro-degeneration (AT[N]) framework was proposed recently as a dichotomous method for the classification of individuals across the clinically normal to dementia spectrum [28–30]. Due to the fluctuation of NPS in the course of AD, the relationship between the alterations of neuroimaging markers and the severity of NPS had been challenging to delineate directly [31, 32]. To overcome this difficulty, we will follow the approach of the AT[N] framework and classify MCI individuals into several subsets based on the dichotomous measures of NPS [33] and Aβ plaques. Tau pathology patterns as well as the association patterns between tau deposition and cognitive performance will then be characterized for each group. We hypothesize that tau deposition exhibits anatomically diverse patterns for MCI individuals with different amyloid and behavioral profiles. There may be an enhanced association between cognitive impairment and tauopathy in the presence of behavior symptoms, especially with the elevated amyloid pathology for subjects in the prodromal stage. The delineation of NPS in MCI may provide additional information regarding the risk of disease progression and lead to improved screening tools for patient selection in clinical trials.
MATERIALS AND METHODS
Participants and grouping strategy
In the current study, we used data from elderly MCI subjects of the multi-center Alzheimer’s Disease Neuroimaging Initiative (ADNI) study (https://adni.loni.usc.edu). The ADNI was launched in 2003 as a public-private partnership, led by principal investigator Michael W. Weiner, MD. Among the goals of ADNI is to test whether serial MRI, PET, other biological markers, and clinical and neuropsychological assessment can be combined to measure the progression of MCI and early AD [34]. The diagnostic criteria in ADNI was previously described [35]. Informed written consent was obtained from all participants at each site. Subjects underwent both 18F-AV-1451 PET and structural T1 scans in the latest visit were first screened. Subjects with amyloid florbetapir (AV-45) or florbetaben (FBB) PET scans within the time interval of one year before/after to the acquisition time of tau PET scans were then selected. The behavioral performance of each subject was assessed by the total Neuropsychiatric Inventory (NPI) score based on 12 domains and the cognitive performance was assessed by the total Alzheimer’s Disease Assessment Scale cognition 13 (ADAS-Cog-13) score based on 13 cognitive domains. The time interval between the acquisition of tau PET scans and clinical scores were less than three months. Since we focus on late-onset MCI, only participants with age > 65 years and complete cognitive and behavioral assessments were included. By June 11, 2019, 151 participants meeting the above requirements were selected from ADNI-2 and ADNI-3.
Score of each behavioral domain of NPI is acquired based on the subjective perception from caregivers and calculated as the product of severity and frequency, which is discontinuous as compared to other clinical scores [36]. In addition, the neuropsychological testing in ADNI is not a mechanical process. The psychometrist must simultaneously administer tests, observe, and assess participant behavior, and make necessary adjustments during an actual test session. Subjects with severe behavior abnormalities were excluded from ADNI to reduce the impact on the assessment of cognitive performance. As shown in Fig. 1, a large number of the subjects have a total NPI score of 0 and most subjects were scored less than 5. This “floor” effect of the NPI score may lead to insufficient statistical power to detect its association with imaging markers [37, 38]. Following the dichotomous classification approach of the AT[N] framework, we thus adopt a binary grouping approach to categorize the behavior status of the subjects with a threshold of zero to the total NPI score (behavior normal/abnormal: B–/B+). To analyze the impact of behavioral status in the context of AD spectrum, we combine it with the amyloid status (amyloid negative/positive: A–/A+) of these MCI subjects, which was calculated by ADNI with a cutoff of 1.11 for AV-45 tracer and 1.08 for FBB tracer. Four groups were finally generated with both amyloid and behavior profiles: A–B–, A–B+, A+B–, and A+B+.
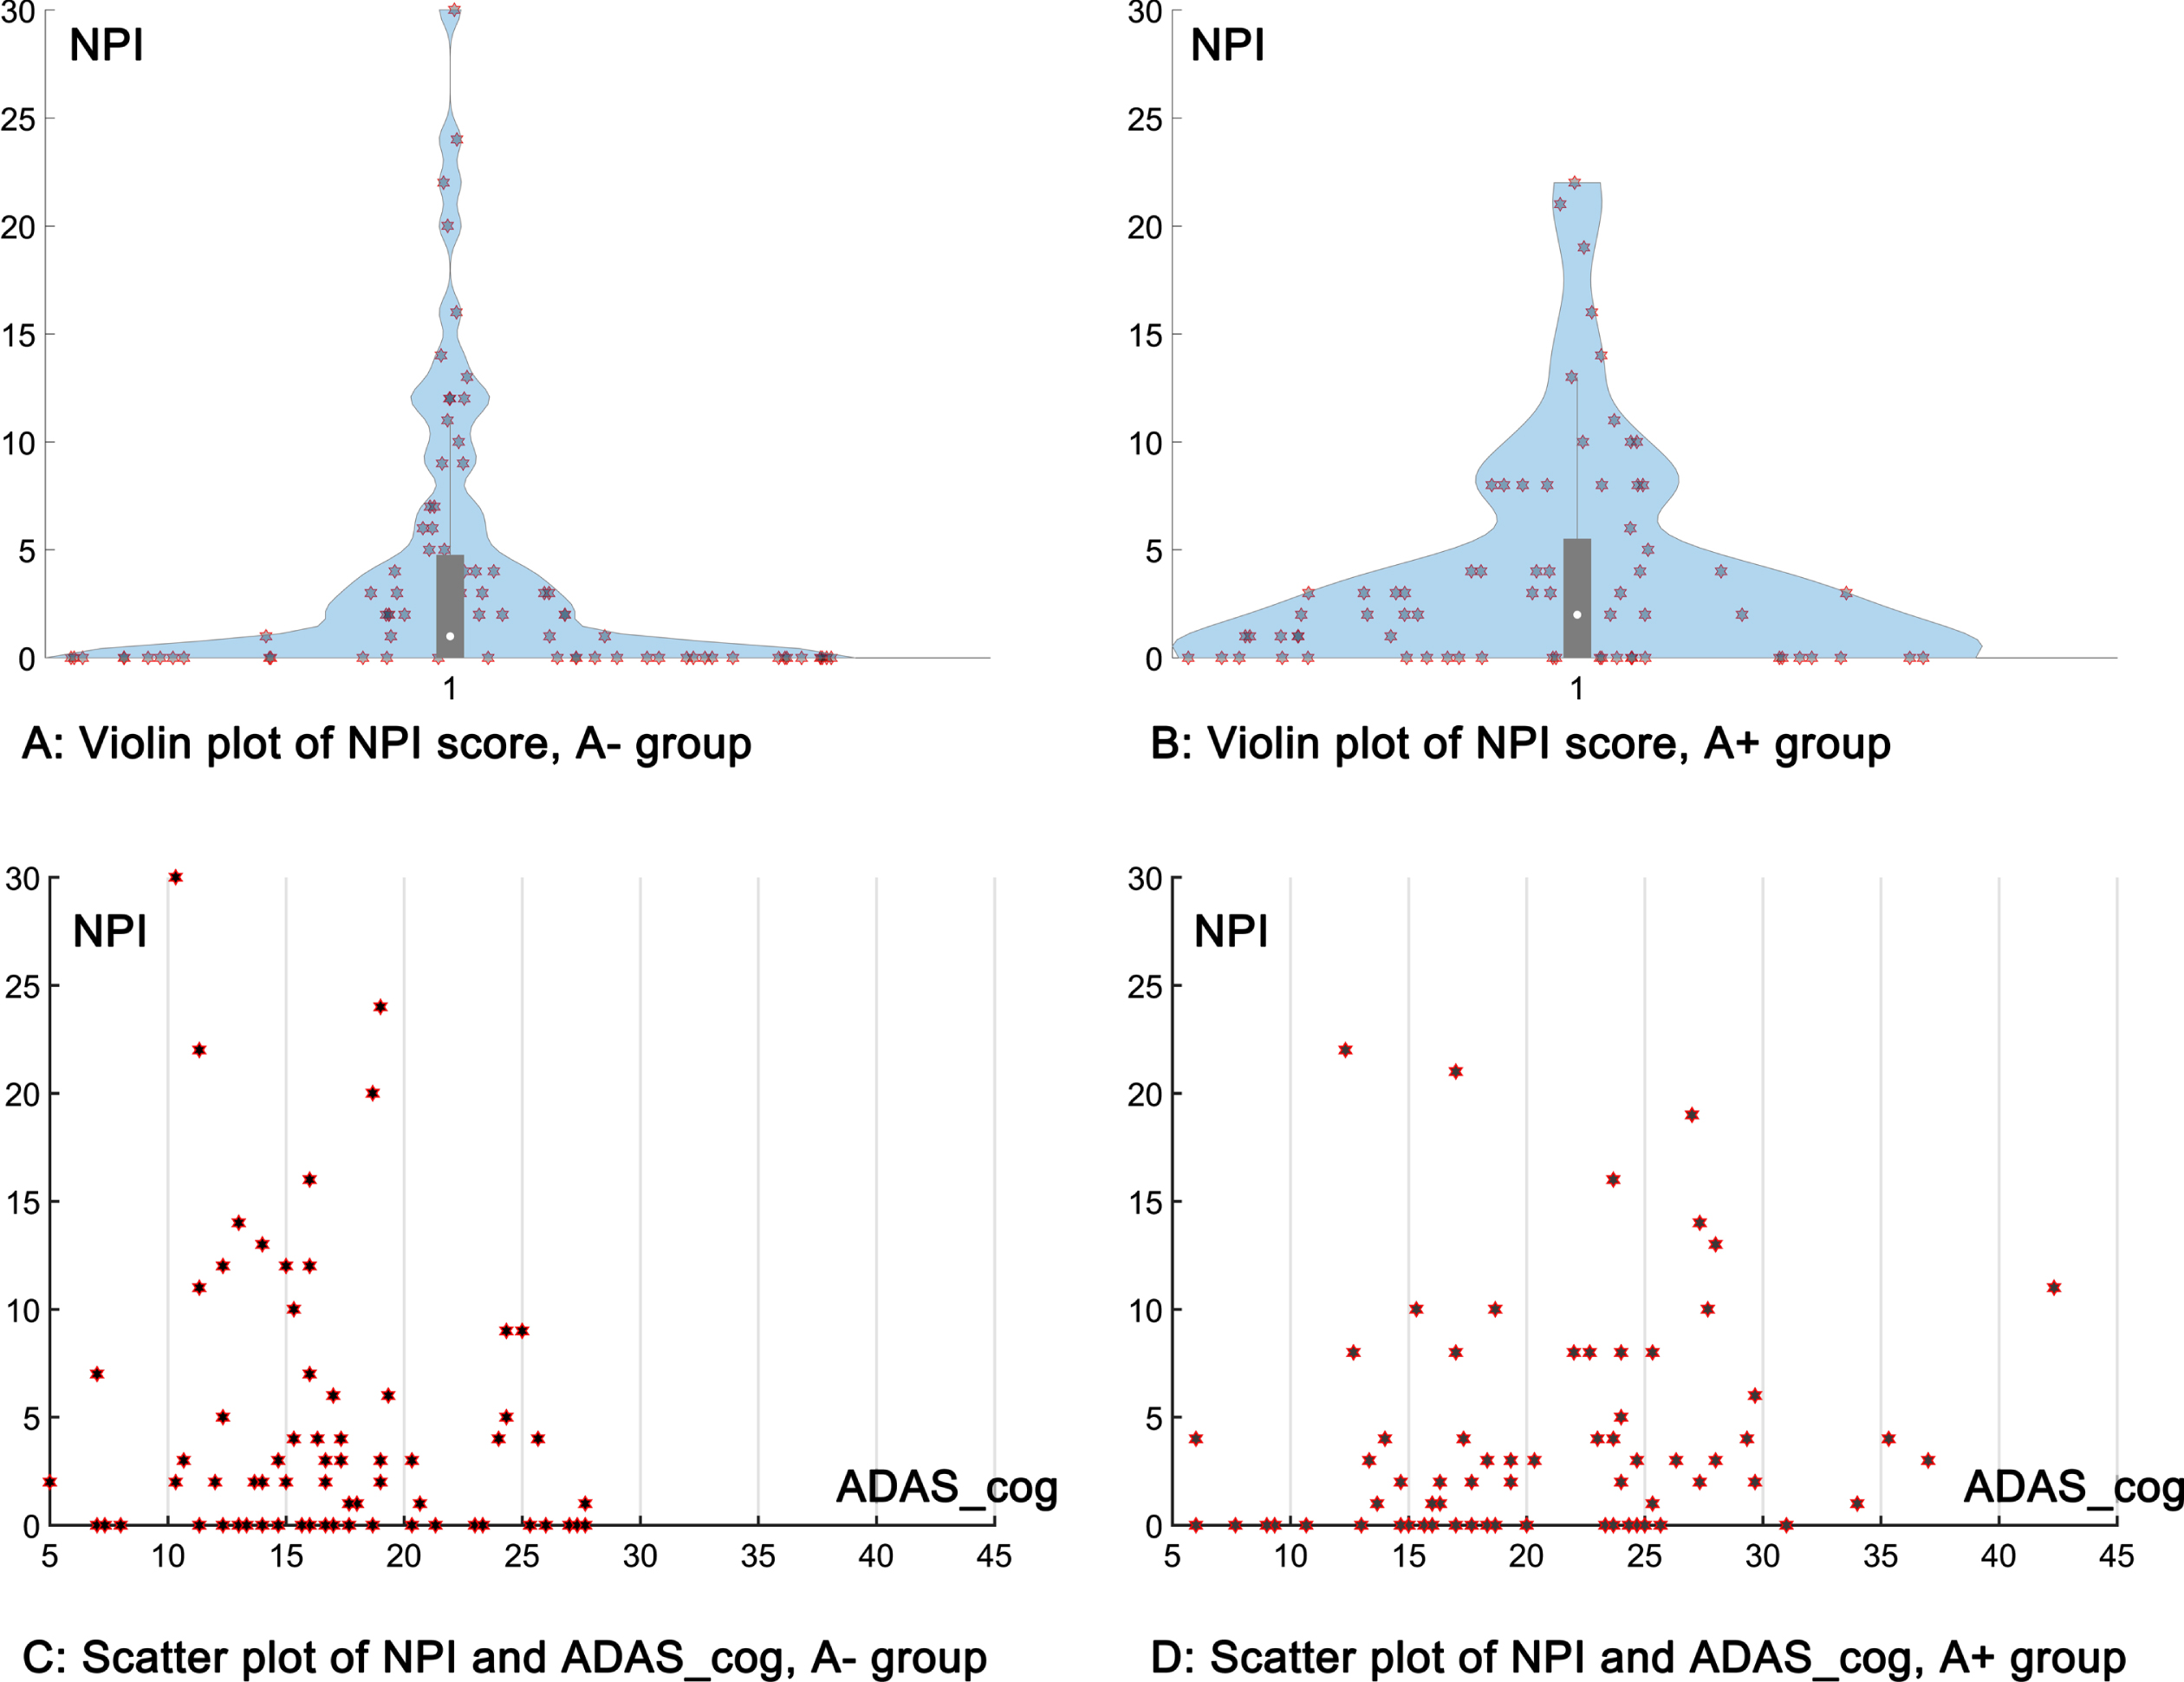
Distribution of the NPI total score for the current cohort. A) The violin plot of NPI total score for the A–group; B) the violin plot of NPI total score for the A+ group; C) the scatter plot of NPI total score and ADAS_cog 13 total score for the A–group; D) the scatter plot of NPI total score and ADAS_cog 13 total score for the A+ group.
T1-weighted MRI acquisition and processing
All subjects were scanned by 3.0 T MRI scanners using a 3D MP-RAGE or IR-SPGR T1-weighted sequences. The detailed protocol can be found online (https://adni.loni.usc.edu/methods/documents/mri-protocols). These T1-weighted MRI images were processed with the FreeSurfer software (version 6.0) (https://surfer.nmr.mgh.harvard.edu/), which automatically segmented the MRI into 34 cortical regions of interest (ROIs) in the native space of each subject using the Desikan-Killiany atlas [39].
Tau PET image acquisition and processing
The radiochemical synthesis of 18F-AV-1451 were overseen and regulated by Avid Radiopharmaceuticals and distributed to qualifying ADNI sites. PET imaging was performed at each ADNI site according to standardized protocols. These images all passed the quality control and were realigned, averaged, resliced to an isotropic voxel size of 1.5 mm, and smoothed to 8 mm3 resolution.
All preprocessed tau PET scans from ADNI were then further processed with PetSurfer [40] in FreeSurfer (version 6.0). A high-resolution segmentation was first created using the Desikan-Killiany Atlas [39] to derive the ROIs for partial volume correction. The PET scan was then registered to the structural T1-weigthed MRI space. The Mueller-Gaertner approach [40, 41] was applied to correct the partial volume effects and the full-width/half-max kernel of the point-spread function used for smoothing was 8×8×8 mm3. Standardized uptake value ratio (SUVR) images were calculated for each subject using the whole cerebellum grey matter as the reference region and then mapped to cortical surface. Mean SUVRs of 34 cortical ROIs on each hemisphere were finally calculated.
Statistical analysis
To assess the association of cognitive performance and tau SUVR, Pearson’s correlation test between the total score of ADAS-Cog 13 and regional mean SUVR of AV-1451 was first conducted on two groups (A+ and A–) and then on four groups (A–B–, A–B+, A+B–, and A+B+) at the level of cortical ROIs. As a sensitivity analysis, to confirm the influence of AD-related factors, we also conducted linear regression analysis with the total score of ADAS-Cog-13 as the response variable and the regional mean SUVR of AV-1451 as the predictor, adjusting for age, gender, education, and APOE allele ɛ4 carrier status (Supplementary Material). For all statistical tests across cortical regions, the false discovery rate (FDR) correction was applied for the correction of multiple comparisons. An adjusted p-value of p < 0.05 (-log10(p) > 1.3) was considered as statistically significant in all analyses.
RESULTS
Study cohort characteristics
Demographic and clinical characteristics of the study cohort are presented in Table 1. There were no significant differences in demographic or cognitive characteristics within the A–groups (A–B–versus A–B+). Within the A+ groups, the A+B+ group was more impaired than the A+B–group based on the ADAS-Cog-13 score (T-test, p = 0.0204). It is worth noting that there is no significant difference in age and education between subjects with and without behavioral changes for either the A–or the A+ groups.
Demographic Information of the MCI subjects
For the whole cohort, all subjects have NPI total score, ADAS-cog-13 score, MMSE score, and Amyloid state information. 15 subjects have no APOE genetic information. Values are given as mean±standard deviation. Two tailed student t-tests were conducted for comparisons between conditions. A–, amyloid negative; A+, amyloid positive; B–, behavior normal; B+, behavior abnormal; M, male; F, female; APOE, apolipoprotein E; NPI, Neuropsychiatric Inventory; MMSE, Mini-Mental State Examination; ADAS-cog-13, Alzheimer’s Disease Assessment Scale cognition 13; n.s., no significance.
Patterns of tau deposition based on amyloid status (A–and A+ groups) and the association with cognitive scores
Mean tau SUVR of 34 cortical regions of both hemispheres based on amyloid status (A+/A–) are plotted in Fig. 2. Significantly elevated regional mean tau SUVR is observed in nearly the whole cerebrum for the A+ subjects as compared to the A–subjects based on the two tailed student t-test (FDR correction, –log10(p) > 1.3).
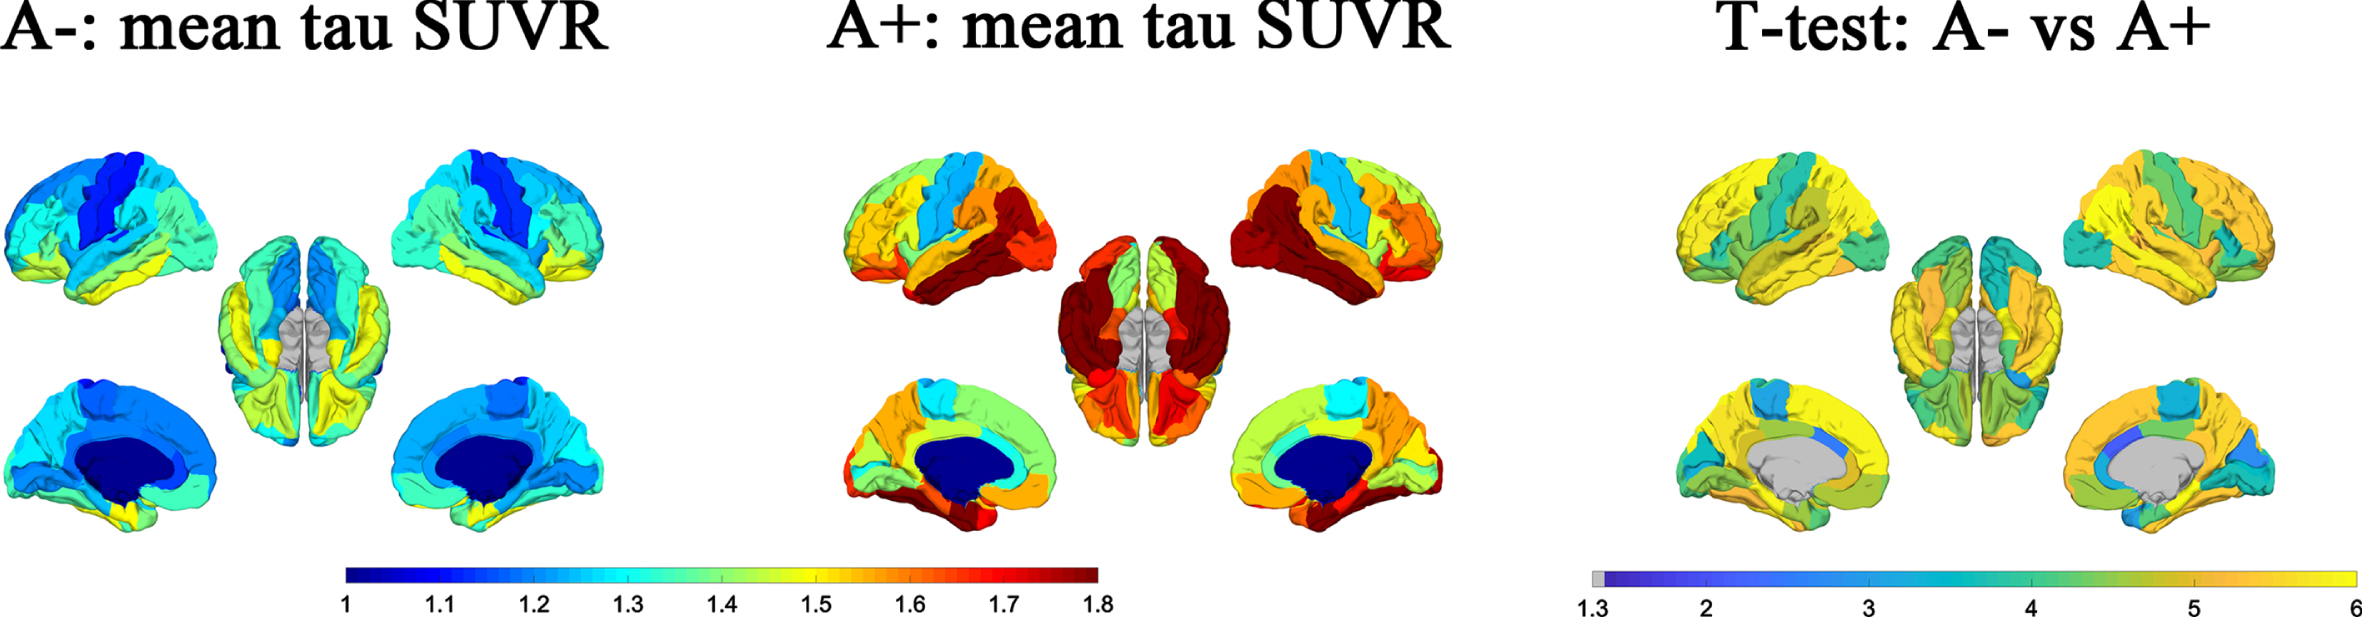
Maps of the regional mean tau SUVR of each group (A–and A+) are shown in the first two columns. The p-value map (–log10(p)) of t-test for the difference in regional mean tau SUVR between the subjects of A–and A+ group was shown in the third column. FDR corrected p-values with –log10(p) > 1.3, i.e., p < 0.05 was treated as statistically significant.
The statistical results (p-value maps) for the association between tau SUVR and ADAS-Cog-13 based on their amyloid status (A+/A–) are shown in Fig. 3. For the A–group, the ADAS-Cog-13 score is significantly associated with cortical tau SUVR in the temporal pole and the entorhinal cortex in both hemispheres after FDR correction. The associated regions extended into nearly the whole cerebrum for the A+ group. Statistical results are similar when we conducted the multivariable regression analysis with adjustment for age, gender, education, and APOE status (Supplementary Figure 1).
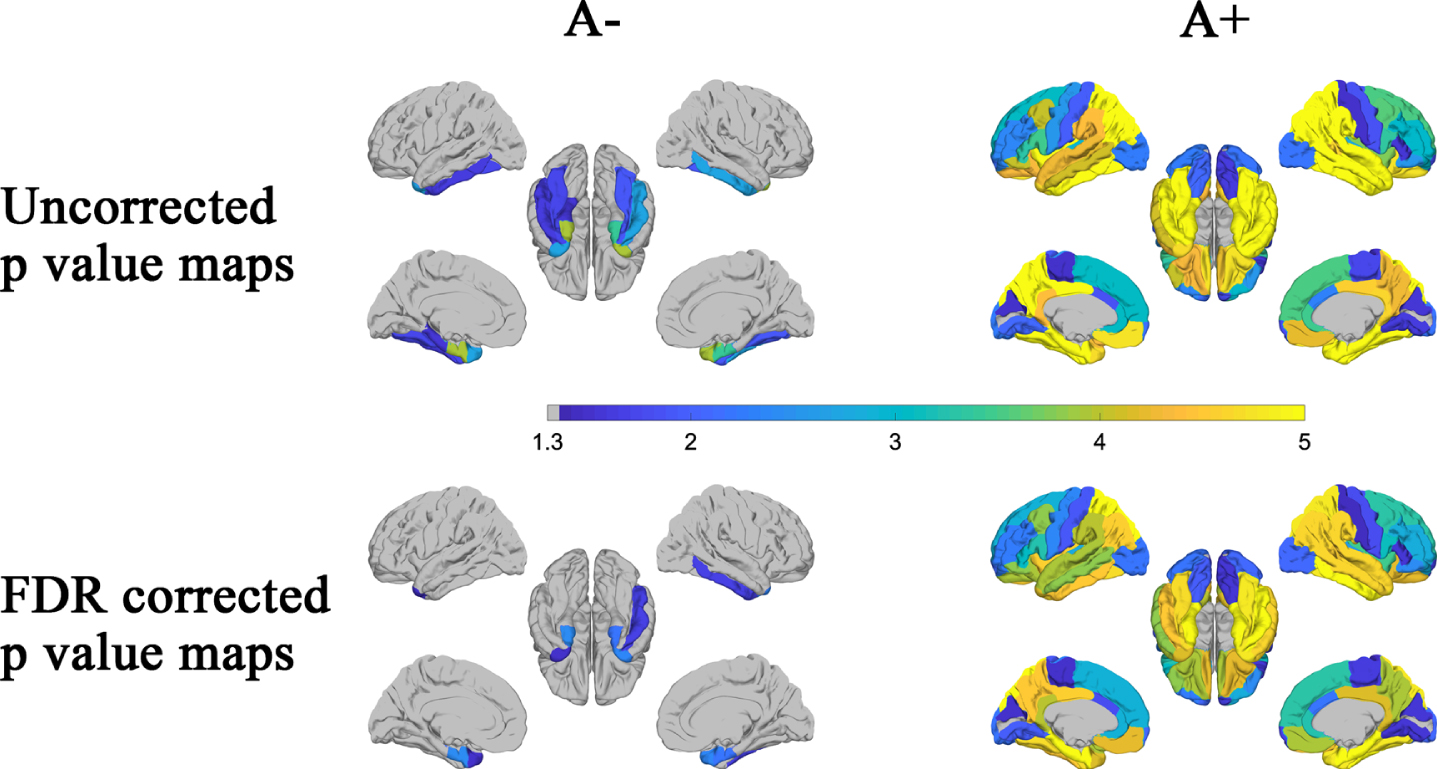
Based on the amyloid status (A–and A+ groups), associations between regional mean tau SUVR and ADAS-Cog-13 score were identified using Pearson’s correlation. The p-value maps (–log10(p)) were shown in the first (uncorrected) and second (FDR corrected) rows. p-values with –log10(p) > 1.3, i.e., p < 0.05 was considered as statistically significant.
Patterns of tau deposition according to amyloid and behavioral profiles and the association with cognitive scores
Mean tau SUVR of the cortical regions based on the 4-group division (A–B–, A–B+, A+B–, and A+B+) are plotted in Fig. 4. T-test results of the regional tau SUVR between each group are shown in the second row. After FDR correction, there is no significant difference between subjects with and without behavior symptoms within either the A–or the A+ group (A–B–versus A–B+ and A+B–versus A+B+). It is worth noting that there is significant difference between the A–B+ group and A+B–group, and the significant regions are displayed in nearly all the brain regions except for the entorhinal cortex and temporal pole.
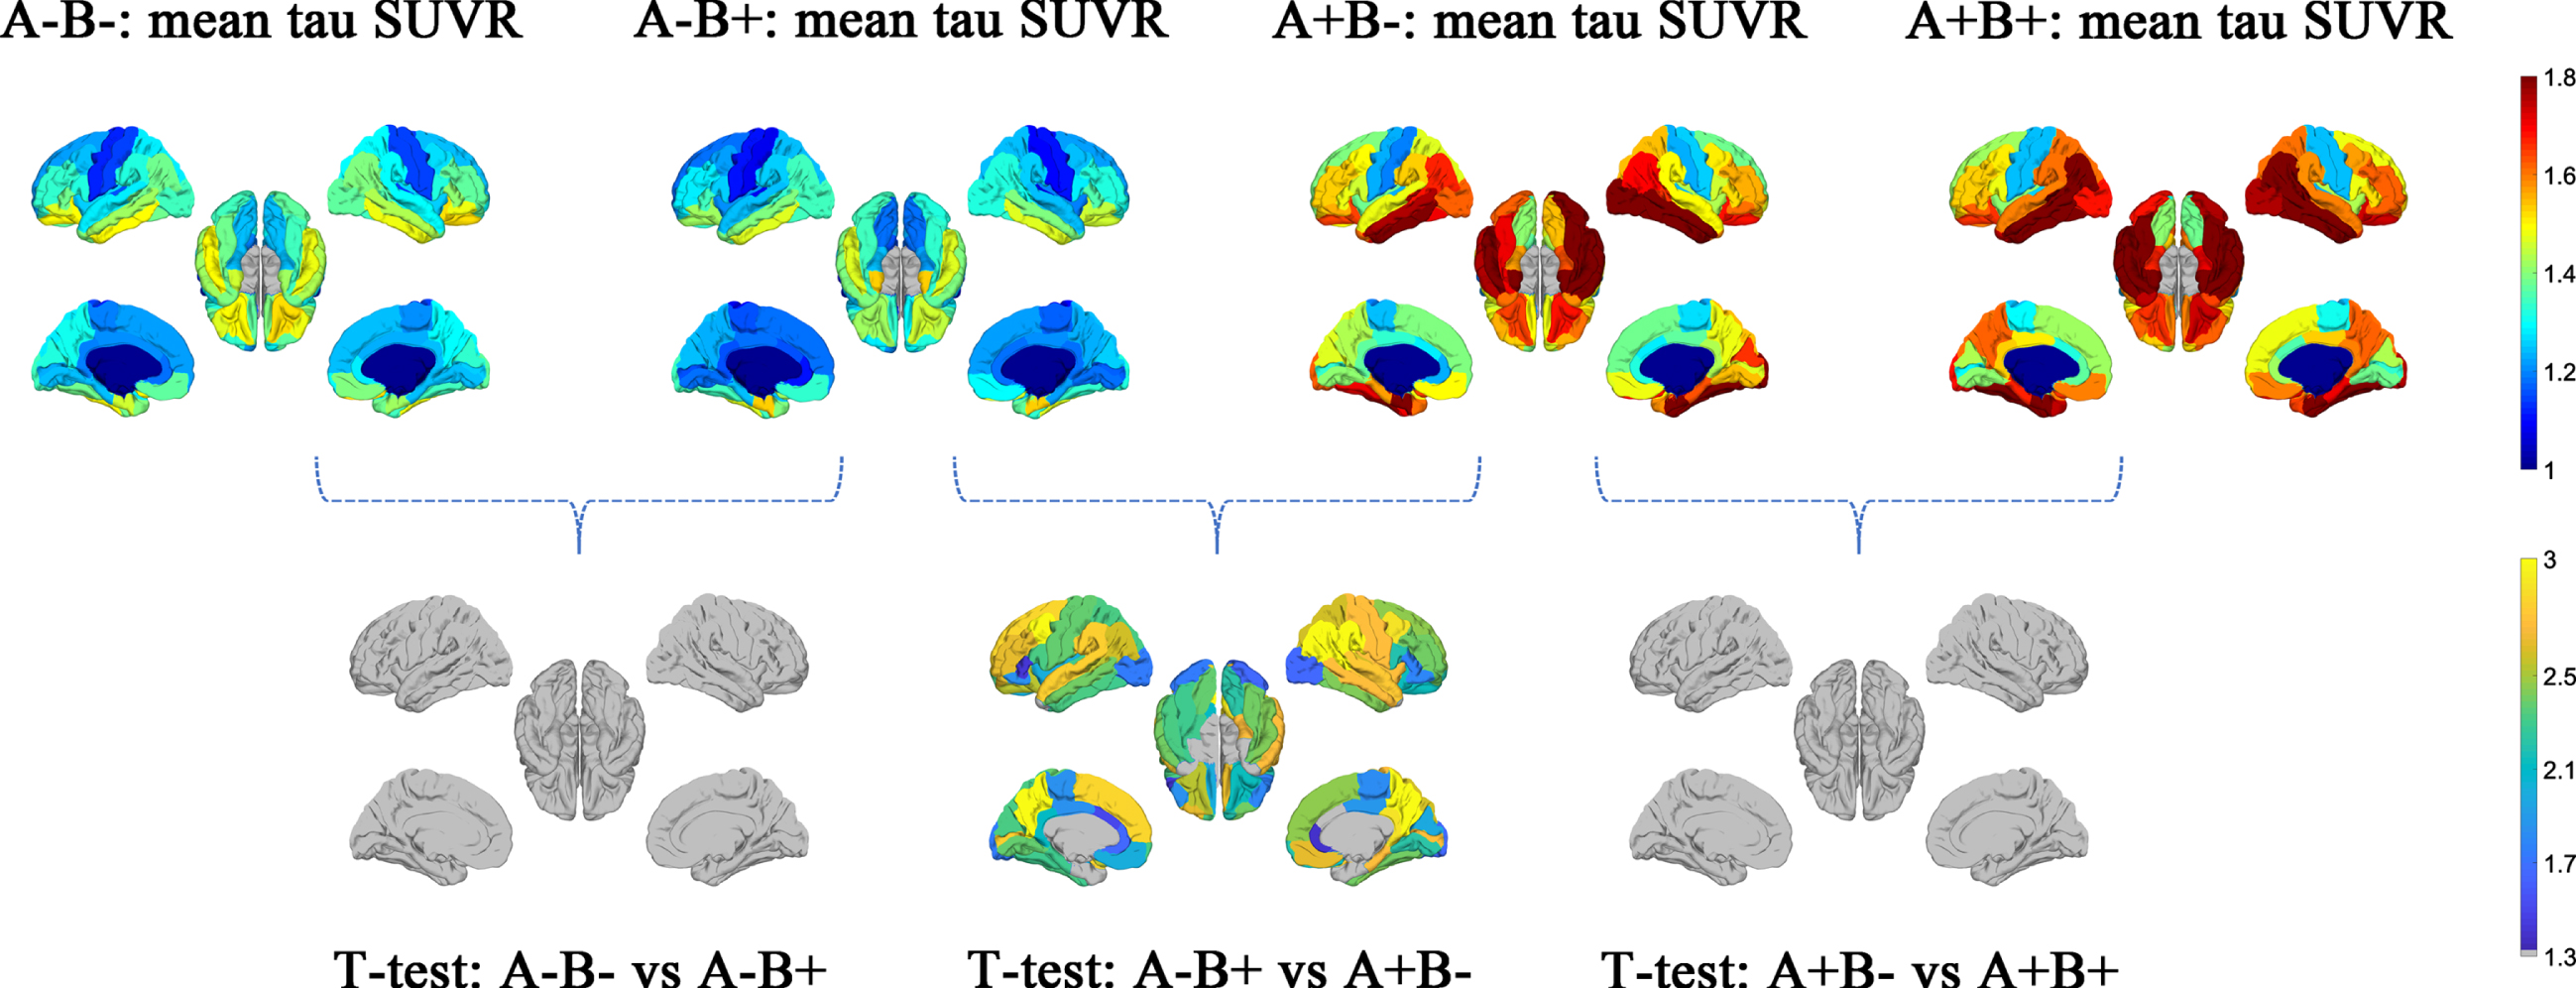
Based on the amyloid (A–and A+) and behavior (B–and B+) status, maps of the regional mean tau SUVR of each group were shown in the first row. The p-value maps (–log10(p)) of t-test were shown in the second row. FDR corrected p-values with –log10(p) > 1.3, i.e., p < 0.05 was considered as statistically significant.
The statistical results (p value maps) between tau SUVR and cognitive scores according to amyloid and behavioral profiles are plotted in Fig. 5. Among the A–subjects, no association is found in either hemisphere between cognitive scores and tau SUVR for the A–B–group, while significant association is discovered in the temporal pole on both hemispheres for the A–B+ group after FDR correction. Among the A+ subjects, there is still no significant association between the tau SUVR and cognitive scores in either hemisphere for subjects without behavior symptoms (A+B–group) after FDR correction. On the contrary, for the A+B+ group, regions with significant associations spread into nearly the whole cerebrum on both hemispheres. Within both A–and A+ groups, it is worth noting that regions with significant association increased significantly (with or without FDR correction) when the behavior status of the MCI subjects switches from normal (B–) to abnormal (B+). Similar statistical results are obtained when we conducted the multivariable regression analysis with adjustment for age, gender, education, and APOE status (Supplementary Figure 2).
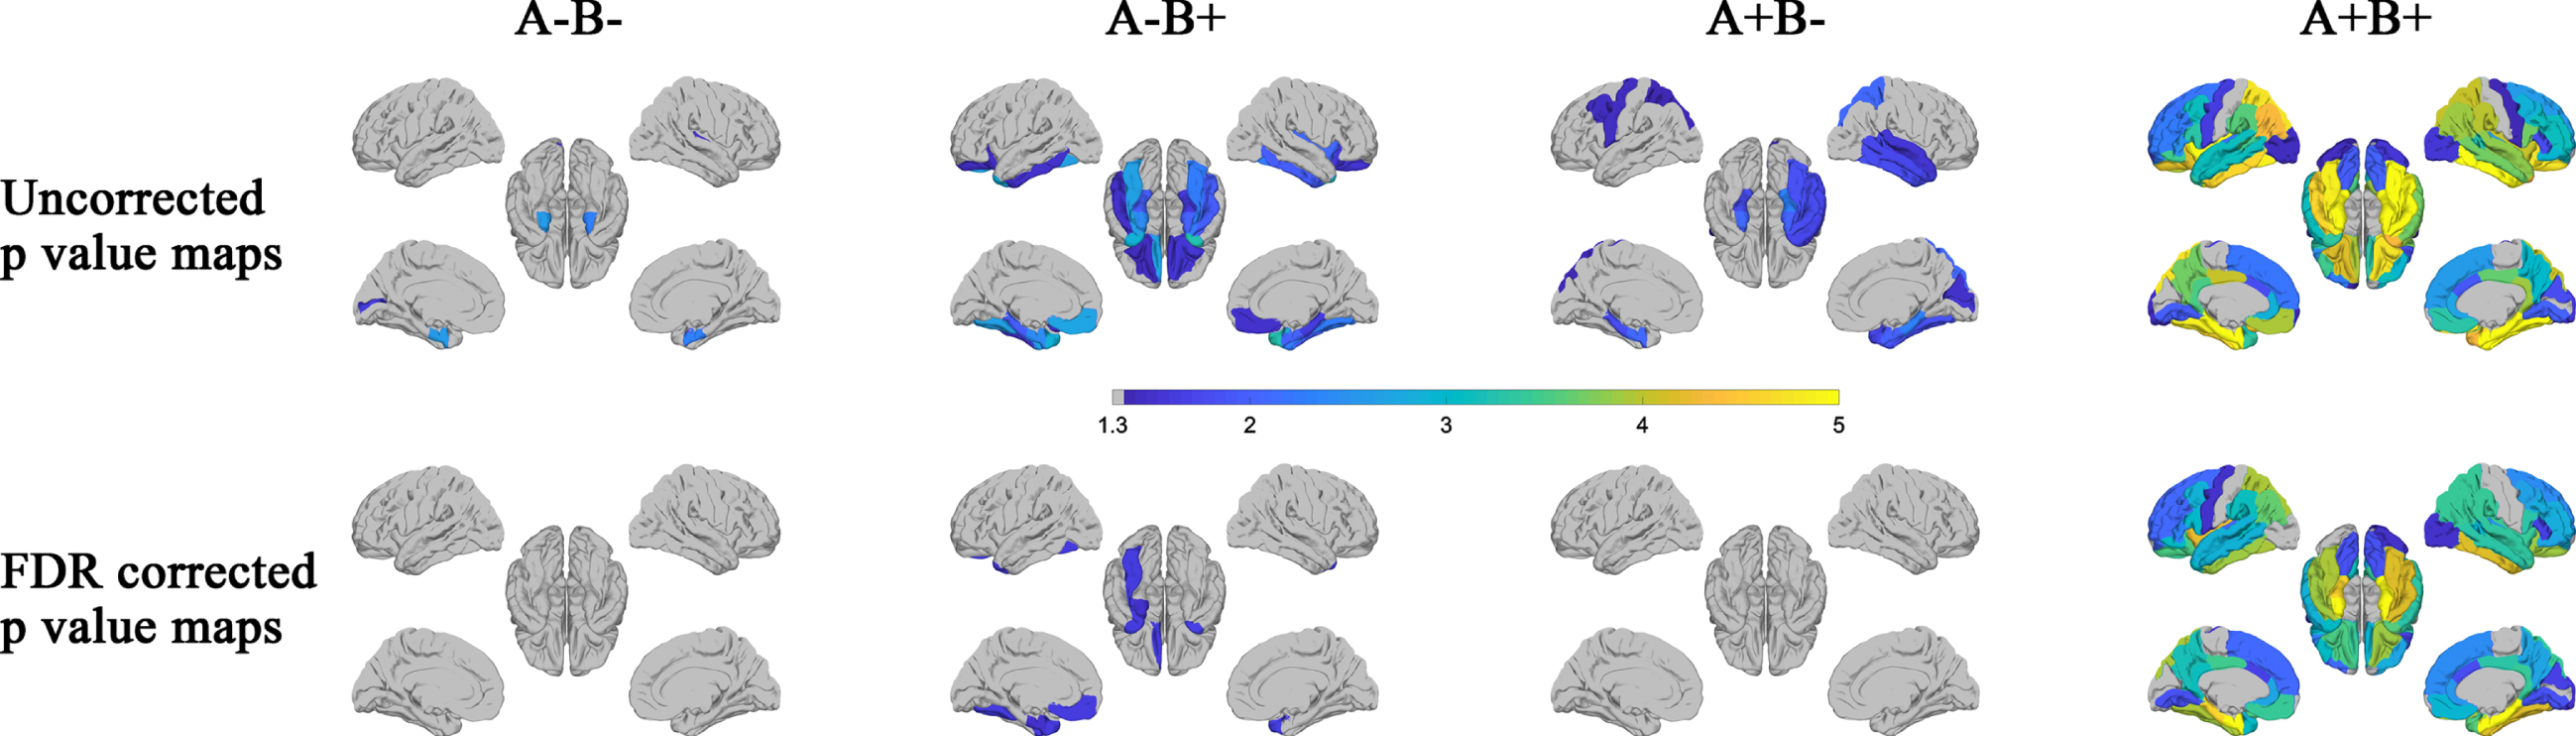
Based on the amyloid (A–and A+) and behavior (B–and B+) status, statistically significant associations between regional mean SUVR and ADAS-Cog-13 score were identified using Pearson’s correlation for each group. The p-value maps (–log10(p)) were shown in the first (uncorrected) and second (FDR corrected) rows. p-values with –log10(p) > 1.3, i.e., p < 0.05 was considered as statistically significant.
DISCUSSION
The prodromal period is the stage in which the common AD pathology may coexist with other age-related pathologies, which could be reflected by diverse cognitive and behavioral symptoms. Using AD-related markers to distinguish the diverse patterns of MCI is essential for clinical diagnosis and treatment, as well as confirming which MCI patients should be included in different clinical trials [42]. In the current study, we included 151 MCI subjects from ADNI and demonstrated the association between cognitive performance and tau deposition of four sub-groups based on their amyloid status and the presence or absence of behavioral symptoms (A–B–, A–B+, A+B–, and A+B). Enhanced association between tau deposition and cognitive scores was found for subjects in the sub-groups with behavior symptoms, especially in the presence of elevated amyloid status. Based on the current neuroimaging study, MCI individuals with NPS may be at greater risk for further cognitive decline with the increase of tau deposition in comparison to those without NPS.
Aβ is the first biomarker reported to become abnormal in carriers of autosomal dominant AD [43, 44]. Positive amyloid biomarkers have been associated with long-term increased risk of incident dementia, especially for individuals with MCI [45, 46]. Across the normal aging to clinical dementia spectrum, there is a strong association of elevated tau deposition in both medial temporal lobe structures and the whole neocortex with positive amyloid status [47, 48]. In our study, as expected, higher tau SUVR values were found in the A+ group relative to the A–group for the MCI subjects. The distribution of regions with significant associations between tau SUVR and cognitive impairment increase significantly from the A–group to the A+ group. Our results thus confirm the increased disease severity and enhanced association between tauopathy and cognitive impairment for subjects with elevated Aβ pathology in the MCI cohort.
However, there may contain several distinct disease patterns of the MCI individuals even if they are under the same amyloid status. For example, vascular disease and depression may account for the AD like phenotype for the amyloid negative subjects that have been diagnosed as MCI [49]. Suspected non-AD pathology was also observed in a MCI cohort with elevated amyloid pathology [50]. To observe the heterogeneity of MCI, traditional methods have been proposed to define the subtypes of MCI as amnestic, non-amnestic, single-domain, and multi-domain [51, 52]. Diverse patterns of clinical characteristics and rates of disease conversion were observed among these subtypes [53]. However, longitudinal studies demonstrated that both amnestic and non-amnestic MCI exhibit approximately equal proportions of “pure” AD pathology or other pathologies at autopsy [54]. Traditional subtyping of MCI may be insufficient to characterize the underlying neuropathologic substrates of “amnestic” and “non-amnestic” cognitive impairment profiles. As a consequence, empirically-derived subtypes of MCI based on neuropsychological scores or the combination of multiple impaired scores were proposed to identify homogenous subgroups reflecting potentially common etiology and probable outcomes [4, 5]. Phenotype harmonization consortium based on the cognitive composite scores including memory, executive function, language, and visual-spatial have been developed previously for the accurate diagnosis of AD patients, which may also have the potential to classify the subtypes of MCI [55–57].
In our current study, we proposed a dichotomous grouping approach based on the NPS and amyloid status to consider the heterogeneity within MCI subjects. As the most prevalent co-occurring events over the disease course of AD, NPS including depression, anxiety, and apathy are common in MCI and subjects with these symptoms may represent a higher risk of cognitive decline and disease progression [58]. NPS were also found to be correlated with increased neurofibrillary tangles and amyloid plaques, which are specific biomarkers of AD [59]. For instance, tau deposition in the entorhinal cortex and inferior temporal lobe was found to be modestly associated with depressive symptoms [60]. The accumulation of tau in the brainstem early during the course of AD may affect sleep [61]. The AT[N] framework provides a formal descriptive classification scheme to describe the staging of AD spectrum [29]. Clinical information such as behavior status could be used to supplement and enhance the application of AT[N] in cognitive aging and dementia research [29]. As can be seen from Fig. 5, cognitive impairment is associated with tau SUVR in the entorhinal cortex and temporal pole in both hemispheres for A–B+ group, while no association is detected for A–B–groups after FDR correction. In contrast, the regions with significant association for the A+B+ group extended into nearly the whole cerebrum, while there was no region with such an association in the A+B–group. Additionally, amyloid positive subjects with behavior symptoms (the A+B+ group) are more impaired than those without behavior symptoms (the A+B–group) as assessed by the ADAS-Cog-13 score. Our results demonstrate that the relationship between tau deposition and cognitive impairment is enhanced in subjects with abnormal behavior status in both the A–and A+ groups, and the enhancement is more prominent for amyloid-positive subjects. Similar to the AT[N] framework, current grouping strategy provides a perspective to identify the homogenous subgroups reflecting common etiology and probable outcomes other than requiring individuals to conform to predetermined criteria (i.e., amnestic, or non-amnestic). MCI individuals with NPS may be at greater risk for further cognitive decline with the increase of tau deposition in comparison to those without NPS.
It is worth noting that the MCI subjects in the A–B+ group show no significant difference in the cognitive scores as compared to the A–B–group. However, significant association between tau deposition and cognitive performance is observed in a number of cortical areas (mostly in the temporal lobe) for the A–B+ group, while no significant association is found in any cortical ROI for the A–B–group after FDR correction. Aged individuals with neurofibrillary tangles but in the absence of amyloid plaques is recommended as primary age-related tauopathy (PART) [62]. It is recognized as a distinct clinical entity that lies on the Alzheimer pathologic spectrum. However, the definitive characterization of the boundary between the PART and other tauopathies including typical AD is challenging. The positive correlation between cognitive scores and the tau SUVR in the temporal lobe for the A–B+ group may represent subtle behavioral changes occurring in the context of PART. Future studies would be required to understand the specific role of behavior symptoms in PART.
Our results also have potential implications regarding patient screening in AD clinical trials. The multifactorial causes of dementia are a challenge for both diagnosis and treatment as various neuropathologic processes contribute to cognitive impairment. For the confirmation of the disease status of a patient, the amyloid and tau pathologies, as well as other possible comorbidities such as vascular changes and Lewy body pathology, should be considered collectively. As can be seen in the current study, the A–B+ group in our MCI cohort may contain subjects with non-AD neuropsychiatric disorders or subjects with high risk in conversion to AD, which cannot be regarded simply as controls even if they are amyloid negative in clinical trials with MCI subjects. On the other hand, subjects in the A+B–group exhibit distinct association pattern of the tauopathy with cognitive decline compared to those in the A+B+ group. We propose that groups A+B–and A+B+ thus should not be treated equally in clinical trials. Our study provides imaging support for the notion that the presence of behavioral symptoms combined with the presence of specific biomarkers (Aβ pathology, etc.) might be used as an enrichment strategy for the enrollment of MCI subjects in AD clinical trials.
There are several limitations that must be acknowledged in the current study. The relatively small sample size of the MCI cohort makes it impossible to disentangle how each type of behavior domain of the NPI might influence the association between tau deposition and cognitive performance. Because subjects with severe NPS were excluded from the ADNI project, persons with high NPI scores were not well represented in the current study. As can be seen from Table 1, about 2/5 of the entire cohort have a total NPI score of 0. This leads to a very limited sample size of subject with non-zeros NPI scores. We thus did not further distinguish between participants with minimal behavioral symptoms and those with more severe symptoms in our analysis and instead used the NPI total score as a dichotomous (–/+) measure to profile the cohort and delineate the association between tau SUVR pattern and cognitive impairment under different amyloid and behavior status. Because the NPI scale was originally developed to assess NPS in AD patients at the dementia stage, one possible limitation of our approach is that NPI alone maybe insufficient in the detection of behavior abnormality in the MCI population. New scales such as Mild Behavioral Impairment have been recently proposed to measure NPS in MCI population and should be considered in future studies [63, 64].
The inclusion criteria for the current study are that all subjects should undergo T1-weighted MRI, tau PET, and amyloid PET scans, as well as have the ADAS-cog-13 and NPI total scores. However, complete scans of tau PET images were not acquired on all subjects for each visit, thus limiting our ability to perform longitudinal analysis and examine whether subjects with behavior symptoms suffer a higher risk of disease conversion than those without behavior symptoms. In addition, subjects in the A–B+ group are likely to represent a complex and heterogenous group, including PART, in which the presence of NPS was hard to interpret. It likely represents the influence of various neuropsychiatric disorders including AD in this group as different syndromes may have similar NPS but diverse neurobiological mechanisms [65, 66]. This may be one of the reasons why no significant difference of tau deposition in the entorhinal cortex and temporal pole between the A–B+ group and A+B–group was detected. Subjects in the A+B–group, on the other hand, showed lower ADAS_cog scores as compared to those in the A+B+ group. However, no significant difference of the tau deposition was found between the two groups. Amyloid positive subjects with the presence of behavior abnormalities may suffer a more serious cognitive decline with the increase of tau deposition, while those without NPS exhibit different disease patterns. To verify the current results and make predictive inferences, longitudinal analyses will need to be conducted with the increased sample size of ADNI.
Conclusions
The alterations of neuroimaging markers such as tau-PET signals of the MCI individuals with the presence of NPS are still under recognized. The enhanced association between the cortical tau pathology and cognitive impairment for subjects with behavior symptoms provides neuroimaging evidence of the role of NPS during the prodromal period, especially in the presence of elevated Aβ pathology. Behavioral symptoms combined with the commonly used Aβ pathology biomarker may be beneficial for improving the classification of MCI, and possibly as an inclusion criterion in clinical trials.
Footnotes
ACKNOWLEDGMENTS
This work was in part supported by the National Institute of Health (NIH) under grant RF1AG056573, RF1AG064584, R21AG064776, R01EB022744, R01AG062007, U01AG051218, P41EB015922, and P30AG066530. The work of X. Ge was also in part supported by the National Natural Science Foundation of China (No. 81801776), Natural Science Foundation of Jiangsu Province (No. BK20170256), and Science and Technology Development Program of Xuzhou (No. KC17164).
Data collection and sharing for this project was funded by the Alzheimer’s Disease Neuroimaging Initiative (ADNI) (National Institutes of Health Grant U01 AG024904) and DOD ADNI (Department of Defense award number W81XWH-12-2-0012). ADNI is funded by the National Institute on Aging, the National Institute of Biomedical Imaging and Bioengineering, and through generous contributions from the following: AbbVie, Alzheimer’s Association; Alzheimer’s Drug Discovery Foundation; Araclon Biotech; BioClinica, Inc.; Biogen; Bristol-Myers Squibb Company; CereSpir, Inc.; Cogstate; Eisai Inc.; Elan Pharmaceuticals, Inc.; Eli Lilly and Company; EuroImmun; F. Hoffmann-La Roche Ltd and its affiliated company Genentech, Inc.; Fujirebio; GE Healthcare; IXICO Ltd.; Janssen Alzheimer Immunotherapy Research & Development, LLC.; Johnson & Johnson Pharmaceutical Research & Development LLC.; Lumosity; Lundbeck; Merck & Co., Inc.; Meso Scale Diagnostics, LLC.; NeuroRx Research; Neurotrack Technologies; Novartis Pharmaceuticals Corporation; Pfizer Inc.; Piramal Imaging; Servier; Takeda Pharmaceutical Company; and Transition Therapeutics. The Canadian Institutes of Health Research is providing funds to support ADNI clinical sites in Canada. Private sector contributions are facilitated by the Foundation for the National Institutes of Health (![]() ). The grantee organization is the Northern California Institute for Research and Education, and the study is coordinated by the Alzheimer’s Therapeutic Research Institute at the University of Southern California. ADNI data are disseminated by the Laboratory for Neuro Imaging at the University of Southern California.
). The grantee organization is the Northern California Institute for Research and Education, and the study is coordinated by the Alzheimer’s Therapeutic Research Institute at the University of Southern California. ADNI data are disseminated by the Laboratory for Neuro Imaging at the University of Southern California.