
Abstract
Background:
The Abi3 gene has been suggested to be an important regulator of microglia during Alzheimer’s disease (AD), but the diagnostic power of ABI3 in neurodegenerative disease has rarely been reported.
Objective:
The aim of this study was to evaluate the diagnostic value of ABI3 in AD patients.
Methods:
ELISAs were used to measure the ABI3 level in the serum and cerebrospinal fluid (CSF) of AD patients as well as in the serum of APP/PS1 mice. RT-PCR and western blot were further performed to detect the expression levels of ABI3 in peripheral blood mononuclear cells (PBMCs) of AD subjects as well as in the hippocampus and cortical tissue of APP/PS1 mice. The correlation of cognitive ability with ABI3 level was estimated by linear regression analysis. Moreover, the diagnostic value of ABI3 for AD was assessed with ROC analysis.
Results:
The ABI3 levels all decreased significantly in the serum, CSF, and PBMCs of AD patients and showed a good diagnostic performance. In addition, the ABI3 levels were observed to decrease markedly in the hippocampus from 5-month-old mice, but the dramatic change only appeared in the cortical tissue in the 9-month-old APP/PS1 mice. The ABI3 levels in serum and in the hippocampus of APP/PS1 mice were significantly correlated with cognitive capacity.
Conclusion:
These results demonstrated that ABI3 in serum, CSF, and PBMCs could be a novel early diagnostic biomarker of AD. Moreover, ABI3 had potential to be a novel tracer marker in hippocampus of early AD.
INTRODUCTION
Alzheimer’s disease (AD) is the most common neurodegenerative disease among the aging population. The main clinical manifestations were memory impairment, aphasia, and deterioration of visuospatial skills and other cognitive domains, causing major economic losses to society [1]. The distinct pathological features of AD are the accumulation of amyloid-β (Aβ) and neurofibrillary tangles accompanied by synaptic loss and neuroinflammation in the brain [2]. Previous studies showed that only intervention or treatment in the early stage could delay the progression of AD, suggesting the importance of early diagnosis of AD and identification of mild cognitive impairment (MCI) to dementia of Alzheimer type (DAT). However, rare biomarkers, especially in blood and other specimens collected easily and noninvasively, have been found to diagnose AD at early stage and to identify MCI from DAT.
Abi3 is a member of the Abi family, located at chromosome 17q21.32. It has Src homologous 3 domain, proline rich region, and no catalytic motif [3]. ABI3 is involved in WASp-family verprolin homologous protein 2 (WAVE2) induced actin polymerization and thus participates in immune responses [4]. Previous studies found that Abi3 gene is the main risk gene of AD according to genome-wide association studies [5], and highly expressed in microglia. A risk variant in Abi3 (rs616338/p.S209F) was highly associated with AD [6], indicating that it could play an important role in AD pathogenesis. However, the Abi3-related mechanism of AD as well as its diagnostic value has rarely been reported.
Therefore, this study examined ABI3 levels in the serum, cortex, and hippocampus of APP/PS1 mice at different ages. The purpose of this study is to evaluate systematically the diagnostic, differential diagnostic, and monitoring value of ABI3 in AD patients, especially the potential in the early diagnosis of AD.
MATERIALS AND METHODS
Study population
For this study, 53 individuals with mild cognitive impairment from Alzheimer’s disease (MCI), and 79 individuals with dementia of Alzheimer type (DAT) from the Xuan Wu Hospital in Beijing were included. Subjects were diagnosed with DAT according to the National Institute on Aging and Alzheimer’s Association diagnostic criteria. For MCI, the diagnosis was made according to the neurological diagnosis [7], with a Clinical Dementia Rating scale score of 0.5. Meanwhile other nervous system diseases (stroke, Parkinson’s disease, etc.) and psychiatric illnesses (schizophrenia, major depressive disorder, etc.) were excluded. In addition, 22 Parkinson’s disease (PD) patients were selected according to the Movement Disorder Society Task Force criteria [8], and 38 patients with vascular dementia (VaD) were diagnosed by NINDS-AIREN criteria [9]. Finally, age- and sex-matched healthy controls (HC) were selected from the health examination. Mini-Mental State Examination (MMSE) and Montreal Cognitive Assessment (MoCA) scores were performed on all subjects to assess cognitive status. All subjects were approved by the ethics committee of Xuanwu Hospital of Capital Medical University (Beijing, China), and written informed consent was obtained from all participants or their guardians. The final groups are presented in Table 1.
The characterization of patients in different groups
HC, healthy controls; MCI, mild cognitive impairment; DAT, dementia of Alzheimer type; PD, Parkinson’s disease; VaD, vascular dementia. *p < 0.05, data were compared by one-way ANOVA versus HCs.
Blood processing and storage
Blood samples were collected after fasting. Whole blood was centrifuged at 3000×g for 5 min at room temperature. Then, the serum was immediately transferred to storage tubes marked with the name and sex and frozen immediately in –80°C freezer. Peripheral blood mononuclear cells (PBMCs) were isolated from fresh whole blood by density gradient centrifugation at 900×g for 30 min with Lymphocyte Separation Medium (Human) (P8610, Solarbio). In the centrifuge tube, the cells are divided into four layers from top to bottom, and the PBMCs found between the plasma and ficoll were collected.
CSF sample preparation
CSF was collected by lumbar puncture following standard procedures [10], stored in polypropylene tube, and immediately frozen at –80°C freezer until use.
Serum and CSF analysis
The serum and CSF concentration of ABI3 in patients was measured using ABI3 ELISA kit (MLbio, Shanghai, China) according to the manufacturer’s instructions. All the samples were measured in duplicate, and mean CV was less than 5%.
Mice
The animal study protocol was approved by the Bioethics Committee of Capital Medical University. The research was conducted in accordance with the Guide for the Care and Use of Laboratory Animals. APP/PS1 transgenic mice and age- and sex-matched wild-type (WT) littermates were obtained from Beijing Huafukang Biotechnology Company (Beijing, China). After anesthesia, blood was obtained from mice eyes then centrifuged at 3000×g for 15 min. The serum was collected and sorted in –80°C freezer until being used for ELISA assay. Mice were perfused with cold 1×PBS, and hippocampal and cortical tissues were isolated from different age mice.
Quantitative real-time RT-PCR
With TRIzol reagent, total RNA was isolated from hippocampal and cortical tissues from APP/PS1 mice and WT mice and human PBMCs. Reverse transcription was performed using cDNA Synthesis Kits according to the manufacturer’s instructions (Abm, USA). cDNA was used as a template with SYBR-Green chemistry-based quantitative real-time RT-PCR. The sequences of primers were presented in Table 2.
Primers used for ABI3 gene expression analysis (qPCR) in this study
Western blot
Hippocampal and cortical tissues from mice and human PBMCs were lysed in RIPA lysis buffer (Solarbio, Beijing, China). Protein was subjected to SDS-PAGE and then transferred onto PVDF membranes. The membranes were blocked with 5% milk for 1 h and then immunoblotted with primary antibodies against ABI3 (1:800 dilution; Abcam), β-actin (1:5000 dilution; Abcam), or GAPDH (1:10000 dilution; Abcam) overnight at 4°C. Then incubated with HRP-conjugated secondary antibodies at room temperature for 1 h and visualized using enhanced chemiluminescence.
Statistical analysis
The results are presented as the mean±standard deviation (SD). One-way analysis of variance (ANOVA) was used to assess the differences among more than two groups. The S-W test was used to analysis the normality of the continuous measurements. For determination of the correlation of ABI3 and cognitive function for AD, linear regression analysis was used. The diagnostic power of serum ABI3 was examined using receiver operating characteristic curve (ROC) analysis. Images were assessed using the ImageJ software. p < 0.05 was considered significant.
RESULTS
The serum level of ABI3 decreased in MCI patients
The ABI3 concentrations in the serum of the patients with different cognitive impairments are shown in Fig. 1. The ABI3 levels in the serum of MCI and DAT patients decreased significantly compared to HC group (p < 0.05), while there was no significant difference of the serum level of ABI3 between MCI and DAT group (Fig. 1A, p > 0.05). Although, the ABI3 levels in the serum of VaD and PD patients decreased markedly compared to HC group, the serum ABI3 level of VaD patient was lower than that of AD patient (p < 0.01), while there was no significant difference between AD and PD group (Fig. 1B). Moreover, linear regression analysis was carried out to evaluate the correlation between serum ABI3 level and the MMSE/MOCA score (Fig. 1C, D). These results indicated that serum level of ABI3 decreased in the early stage of AD, and that serum level of ABI3 of VaD patients was lower than that of AD patients.
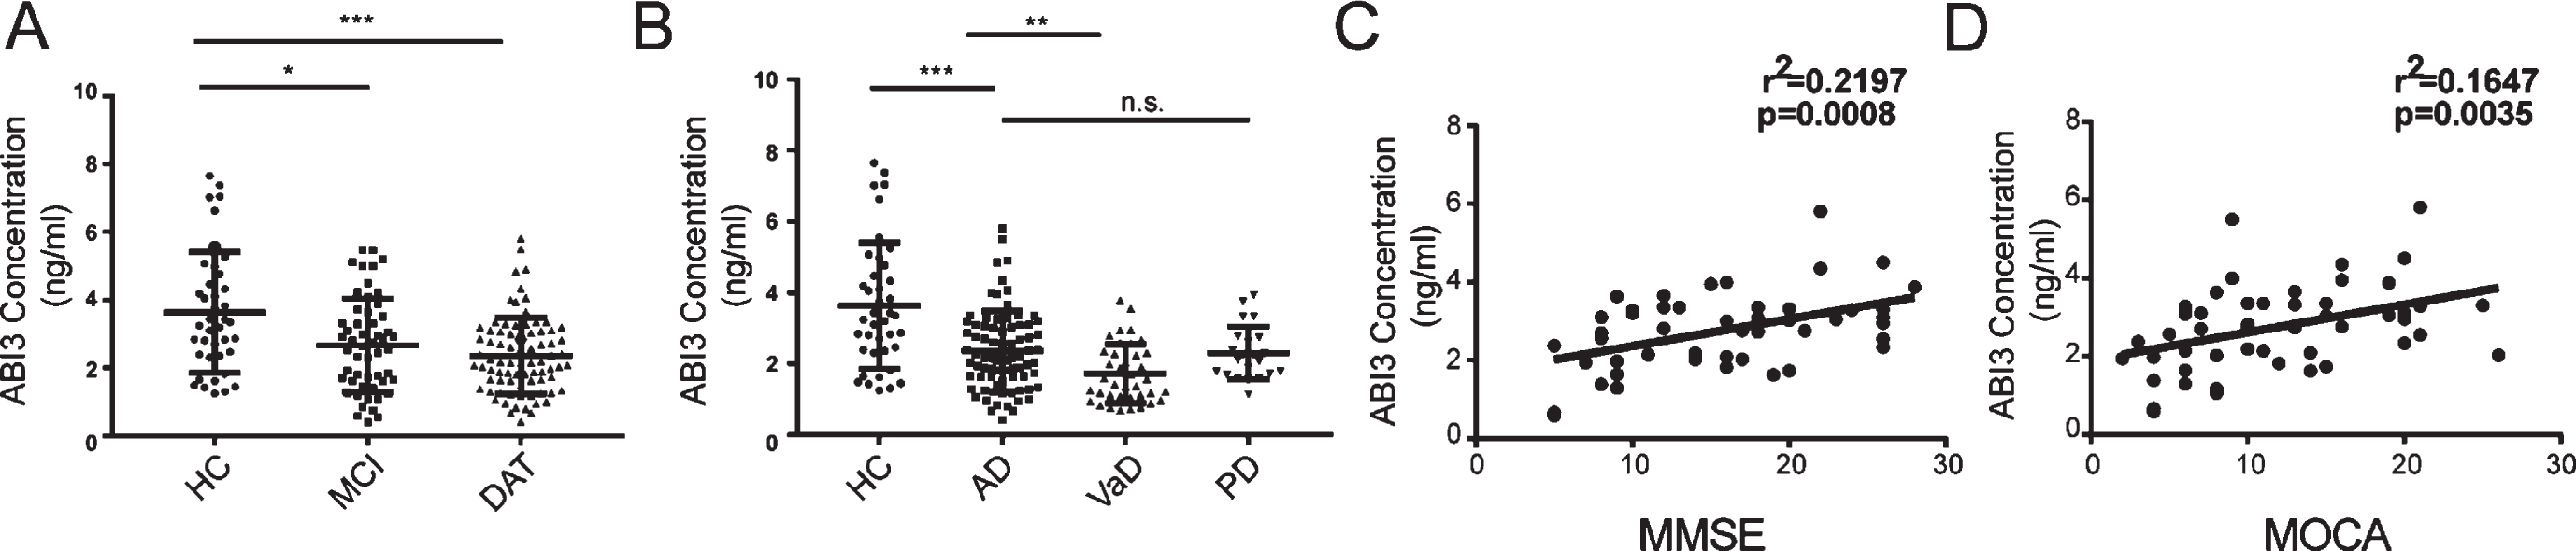
The serum ABI3 concentrations of AD patients at different stages and other neurodegenerative disease as well as the relationship between the serum ABI3 level and the cognitive capacity of AD patients. A) The serum ABI3 levels of AD patients at different stages. HC: n = 40; MCI: n = 53; DAT: n = 79. B) The serum ABI3 levels of AD patients and other neurodegenerative patients. HC: n = 40; AD: n = 79; VaD: n = 38; PD: n = 22. C) The relationship of the serum ABI3 level with the MMSE score by linear-regression analysis. n = 48. D) The relationship of the serum ABI3 level with the MoCA score by linear-regression analysis. n = 50. One-way analysis of variance (ANOVA) was used to assess the differences among more than two groups. Values expressed are mean±SD (***p < 0.001, **p < 0.01, *p < 0.05). HC, healthy controls; MCI, mild cognitive impairment; DAT, dementia of Alzheimer type; VaD, vascular dementia; PD, Parkinson’s disease. Data are representative of at least three independent experiments.
The CSF ABI3 level decreased in MCI patients
Consistent with the serum ABI3, patients with MCI had obvious decreased compared with HC (p < 0.01). However, the level of ABI3 in CSF of DAT patients was not different from that of MCI patients (Fig. 2A, p > 0.05). The CSF ABI3 levels of VaD and PD patients were lower than that of HC, but there was no significant difference among the AD, PD, and VaD groups (Fig. 2B). Linear regression analysis showed that the CSF ABI3 level was not positively correlated with MMSE/MOCA score in AD patients (Fig. 2C, D). The results above suggest that the CSF ABI3 level decreased in the early stage of AD but not further decreased as the disease progresses.
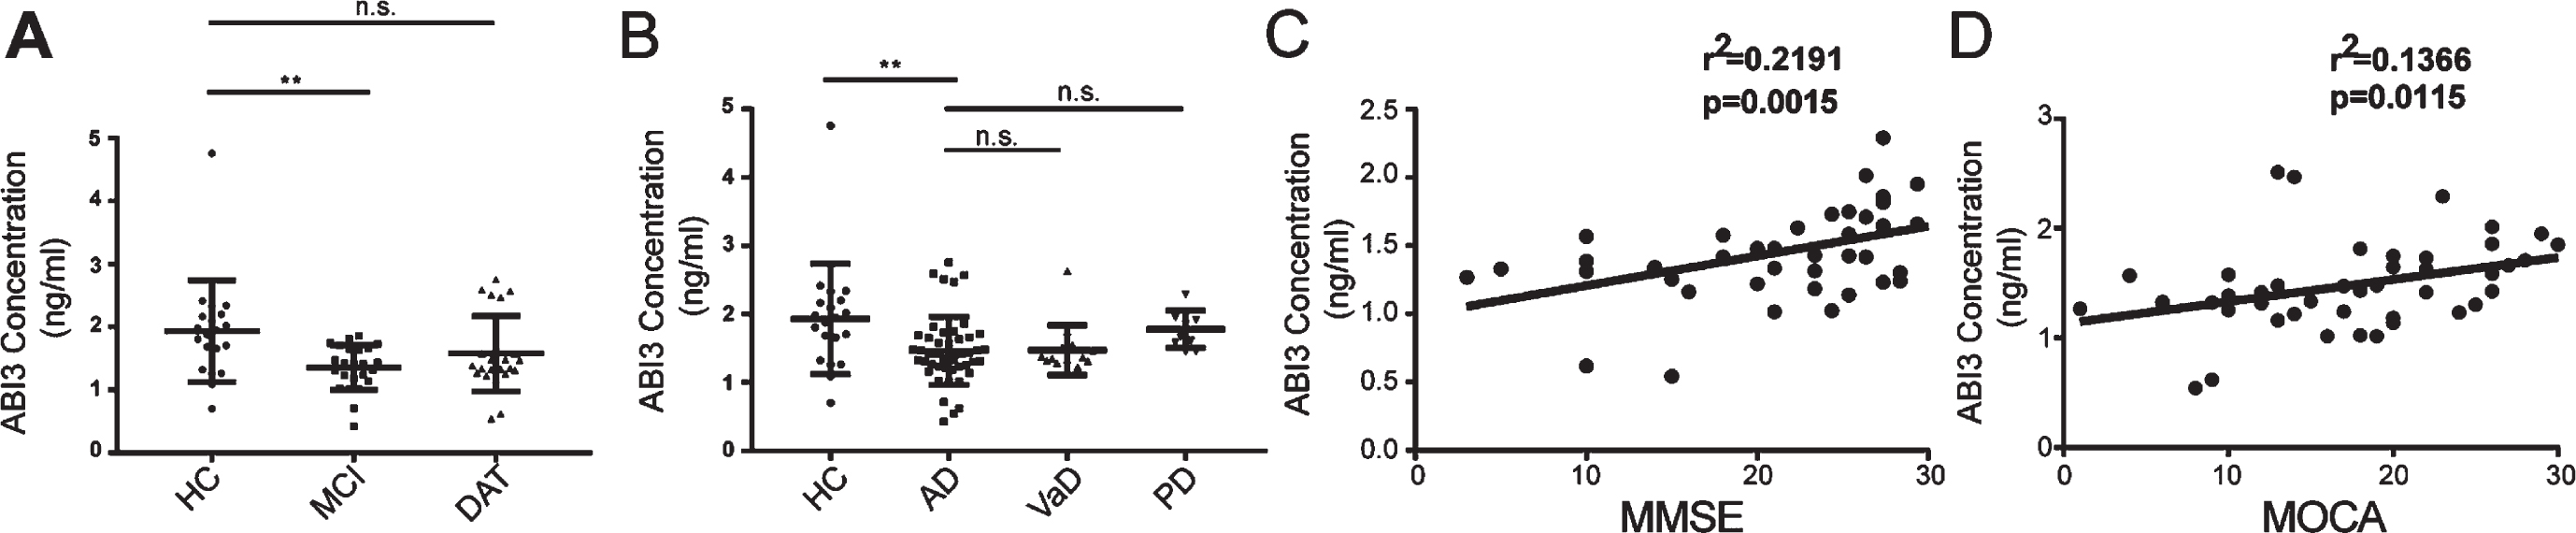
The CSF ABI3 concentrations of AD patients at different stages and other neurodegenerative disease as well as the relationship between the CSF ABI3 level and the cognitive capacity of AD patients. A) The CSF ABI3 levels of AD patients at different stages. HC: n = 20; MCI: n = 24; DAT: n = 23. B) The CSF ABI3 levels of AD patients and other neurodegenerative patients. HC: n = 20; AD: n = 47; VaD: n = 14; PD: n = 10. C) Association between the CSF concentration of ABI3 and the MMSE score in AD patients was determined by linear regression analysis. n = 43. D) Association between the CSF concentration of ABI3 and the MoCA score in AD patients was determined by linear regression analysis. n = 46. Data are representative of at least three independent experiments.
The diagnostic efficiency of ABI3 in serum and CSF for AD
The diagnostic power and the differential diagnostic efficacy of serum and CSF for AD were further tested by ROC-curve analysis (Fig. 3A–H). For the AD and HC group, the AUC for serum ABI3 was 0.722, with 47.50% sensitivity and 88.60% specificity (Fig. 3A). For the diagnostic ability of the CSF ABI3, the AUC was 0.714, with 75.00% sensitivity and 74.50% specificity to distinguish AD from HC (Fig. 3B). Especially, in the diagnosis of MCI from HC, the AUC of ABI3 ROCs were 0.6498 (serum) and 0.7854 (CSF), respectively (Fig. 3C, D). For distinguishing MCI from DAT, the AUC of serum and CSF ABI3 ROCs were 0.5584 and 0.5734 respectively (Fig. 3E, F). In the differential diagnosis of AD from VaD, the AUC of serum ABI3 ROC was 0.6750, with 75.90% sensitivity and 55.30% specificity (Fig. 3G). In the differential diagnosis of AD from PD, the AUC of serum ABI3 ROC was 0.5003, with 32.90% sensitivity and 81.80% specificity (Fig. 3H). The sensitivity and specificity of ABI3 in serum of different neurodegenerative diseases are shown in Table 3. These results indicated that both serum ABI3 and CSF ABI3 could be a potential biomarker for the diagnosis of AD, especially for early diagnosis.
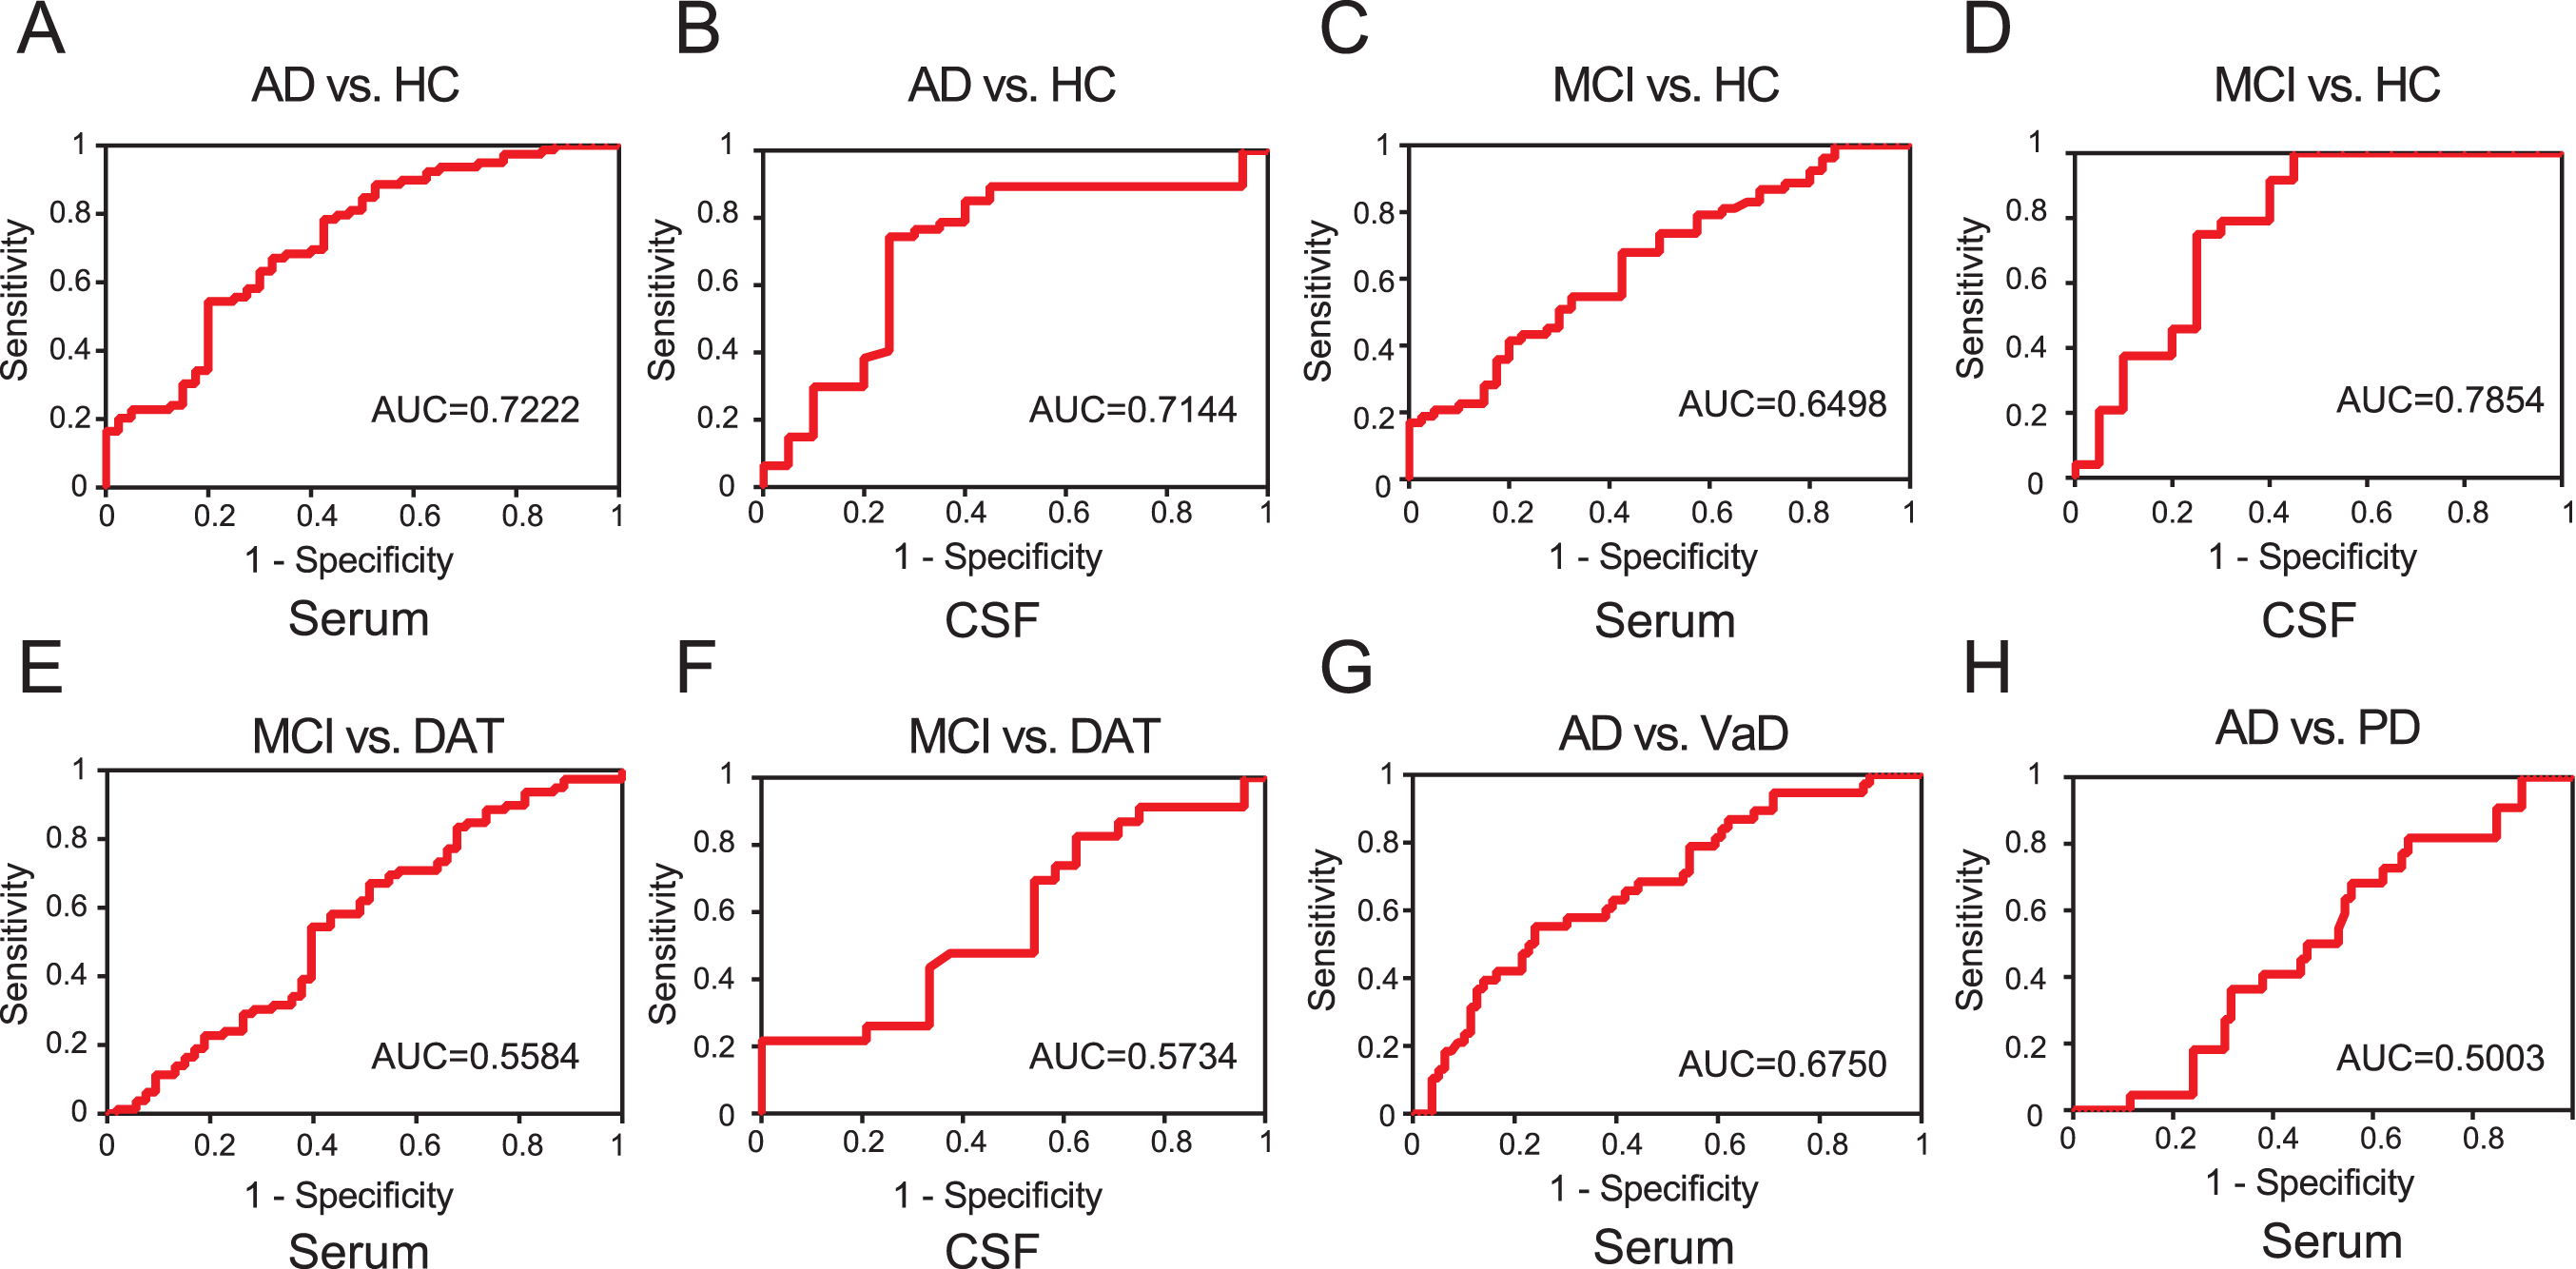
The ROC curves of ABI3 in the diagnosis and differential diagnosis of AD. A) The ROC analysis of the serum ABI3 in the diagnosis of AD from HC. HC: n = 40; AD: n = 79. B) The ROC analysis of the CSF ABI3 in the diagnosis of AD from HC. HC: n = 20; AD: n = 47. C) The ROC curves of the serum ABI3 in distinguishing MCI from HC. HC: n = 40; MCI: n = 53. D) The ROC curves of the CSF ABI3 in the identification of MCI from HC. HC: n = 20; MCI: n = 24. E) The ROC curves of the serum ABI3 in distinguishing MCI from DAT. MCI: n = 53; DAT: n = 79. F) The ROC curves of the CSF ABI3 in the identification of MCI from DAT. MCI: n = 24; DAT: n = 23. G) The ROC analysis of the serum ABI3 in the identification of AD from VaD. AD: n = 79; VaD: n = 38. H) The ROC analysis of the serum ABI3 in the identification of AD from PD. AD: n = 79; PD: n = 22.
Diagnostic ability of serum ABI3 to discriminate between AD and non-AD diseases
AUC, area under the curve.
The expression of ABI3 in PBMCs was decreased in MCI patients
The PBMCs were collected from different subjects, and the ABI3 levels were detected by RT-PCR and western blot. The expression levels of ABI3 both in mRNA and in protein decreased dramatically in the PBMCs of MCI patients (Fig. 4A, C). Meanwhile, the ABI3 level in the PBMCs of VaD patients was much lower than that of AD patients (Fig. 4B, D).
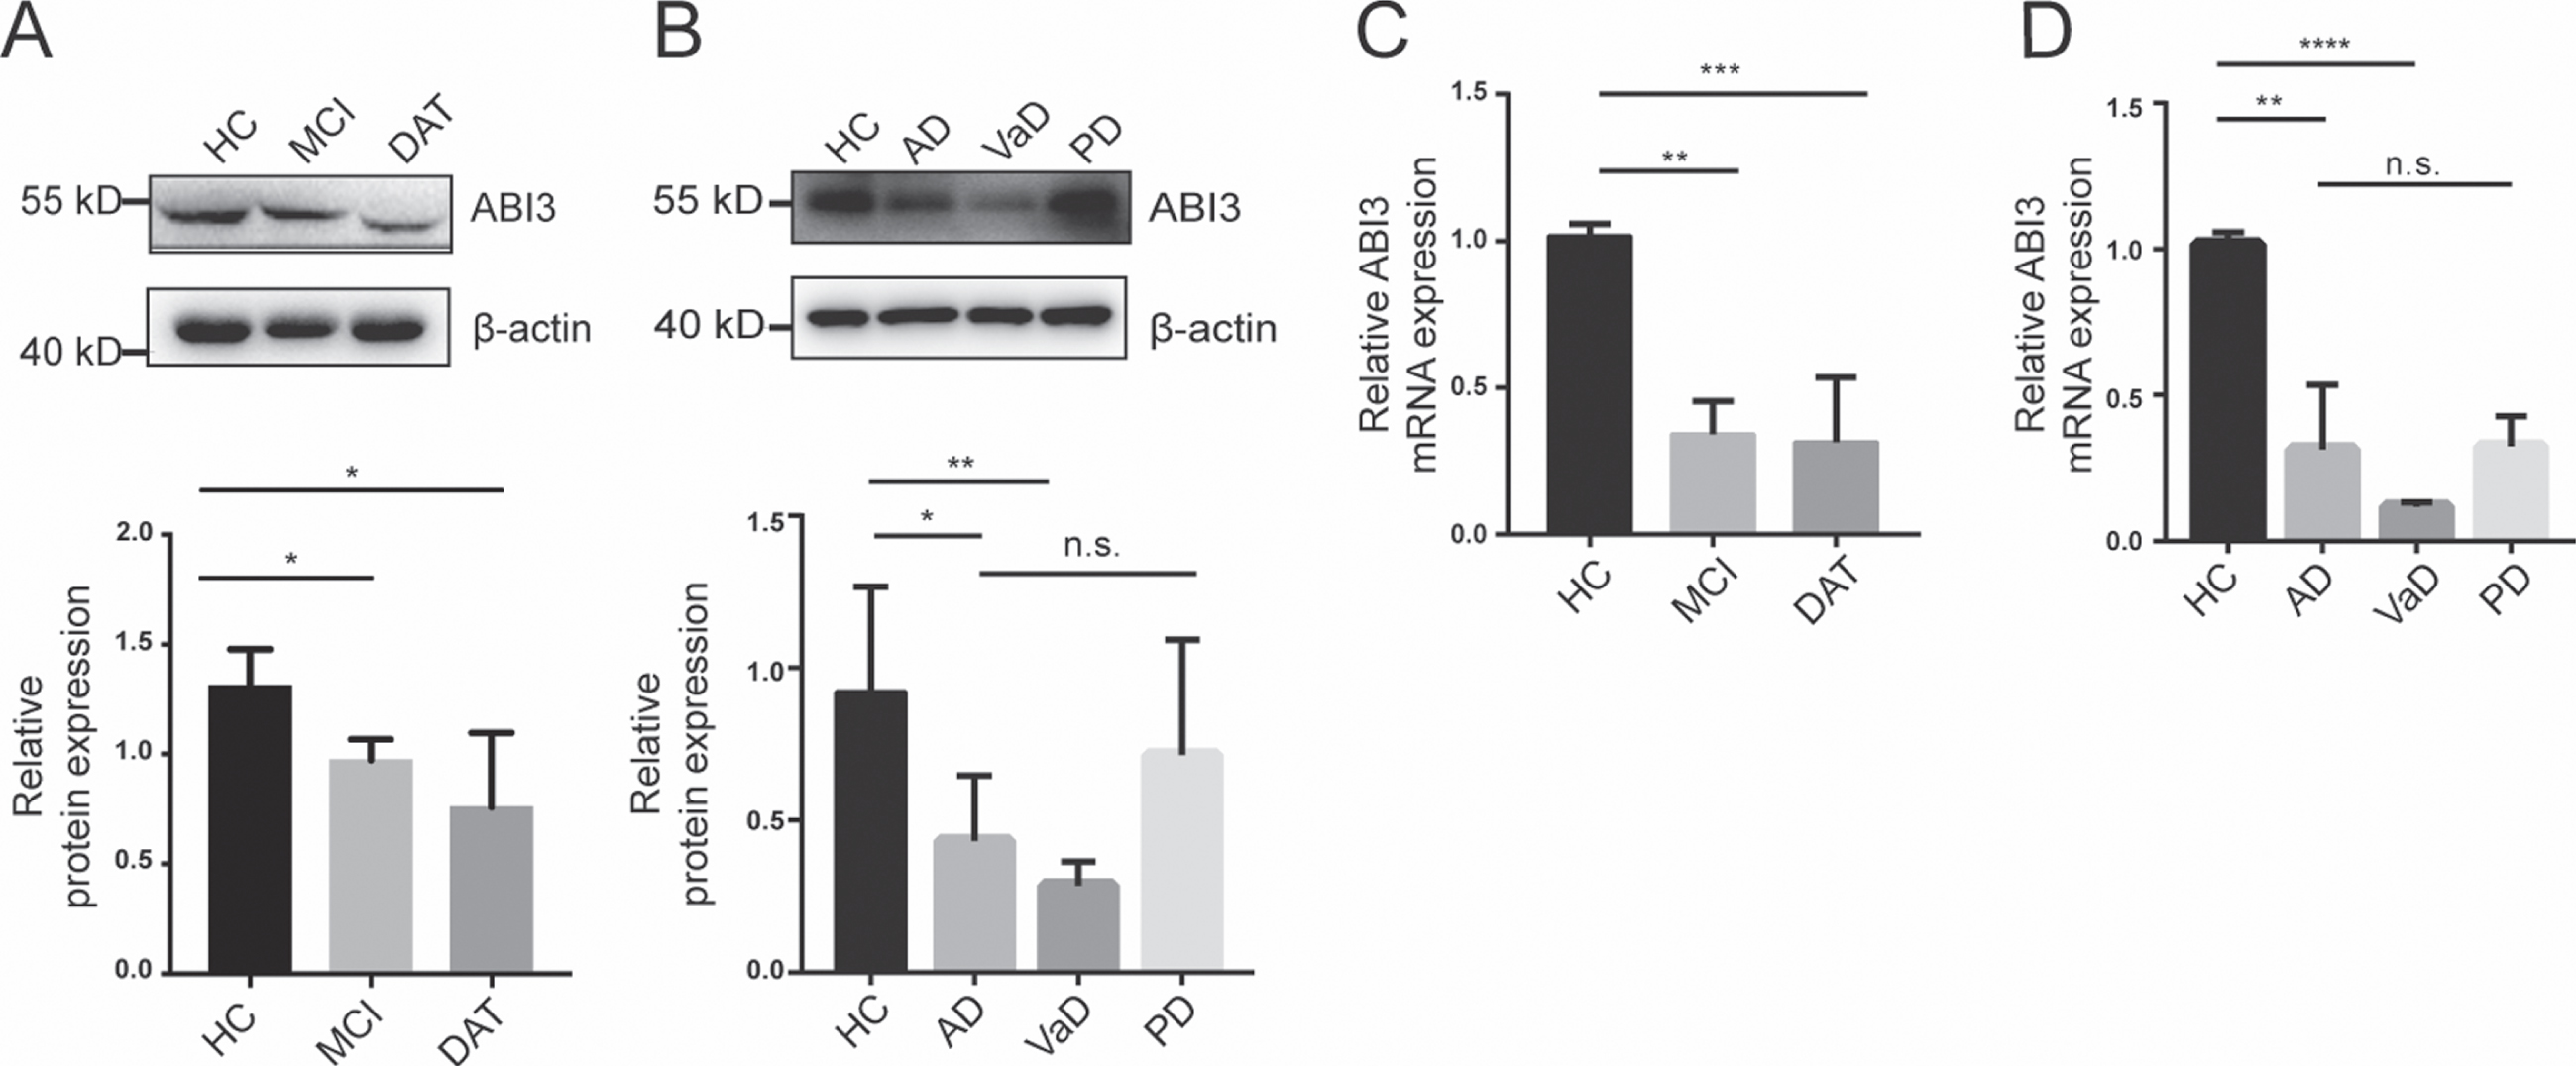
The ABI3 levels in the PBMCs of AD patients at different stages. A) The protein levels of ABI3 in the PBMCs from the HC, MCI, and DAT groups. B) The protein levels of ABI3 in the PBMCs from the groups with different neurodegenerative diseases. C) The ABI3 mRNA expression levels in PBMCs of AD patients at different stages. D) The ABI3 mRNA expression levels in PBMCs of AD patients and other neurodegenerative patients. For A–D, n = 10 in each group. Data are representative of at least three independent experiments.
The alteration of ABI3 expression in APP/PS1 mice
Hippocampal and cortical tissues were isolated from the APP/PS1 or WT mice at different ages. The ABI3 protein levels in APP/PS1 mice and WT mice of different age were shown in Fig. 5A and 5B. The ABI3 protein level in hippocampus of APP/PS1 mice decreased obviously since 5 months of age compared to that of the same age WT mice (Fig. 5A). However, The ABI3 protein levels in the cortex and serum decreased only in 9-month-old APP/PS1 mice compared to the WT mice at same age (Fig. 5B, E). The ABI3 mRNA levels in cortex and hippocampus did not differ until 9 months (Fig. 5C, D). These results indicated that the alteration of ABI3 appeared at the early stage in the hippocampus of APP/PS1 model mice, and that ABI3 could be a potential tracer marker in the hippocampus of AD.
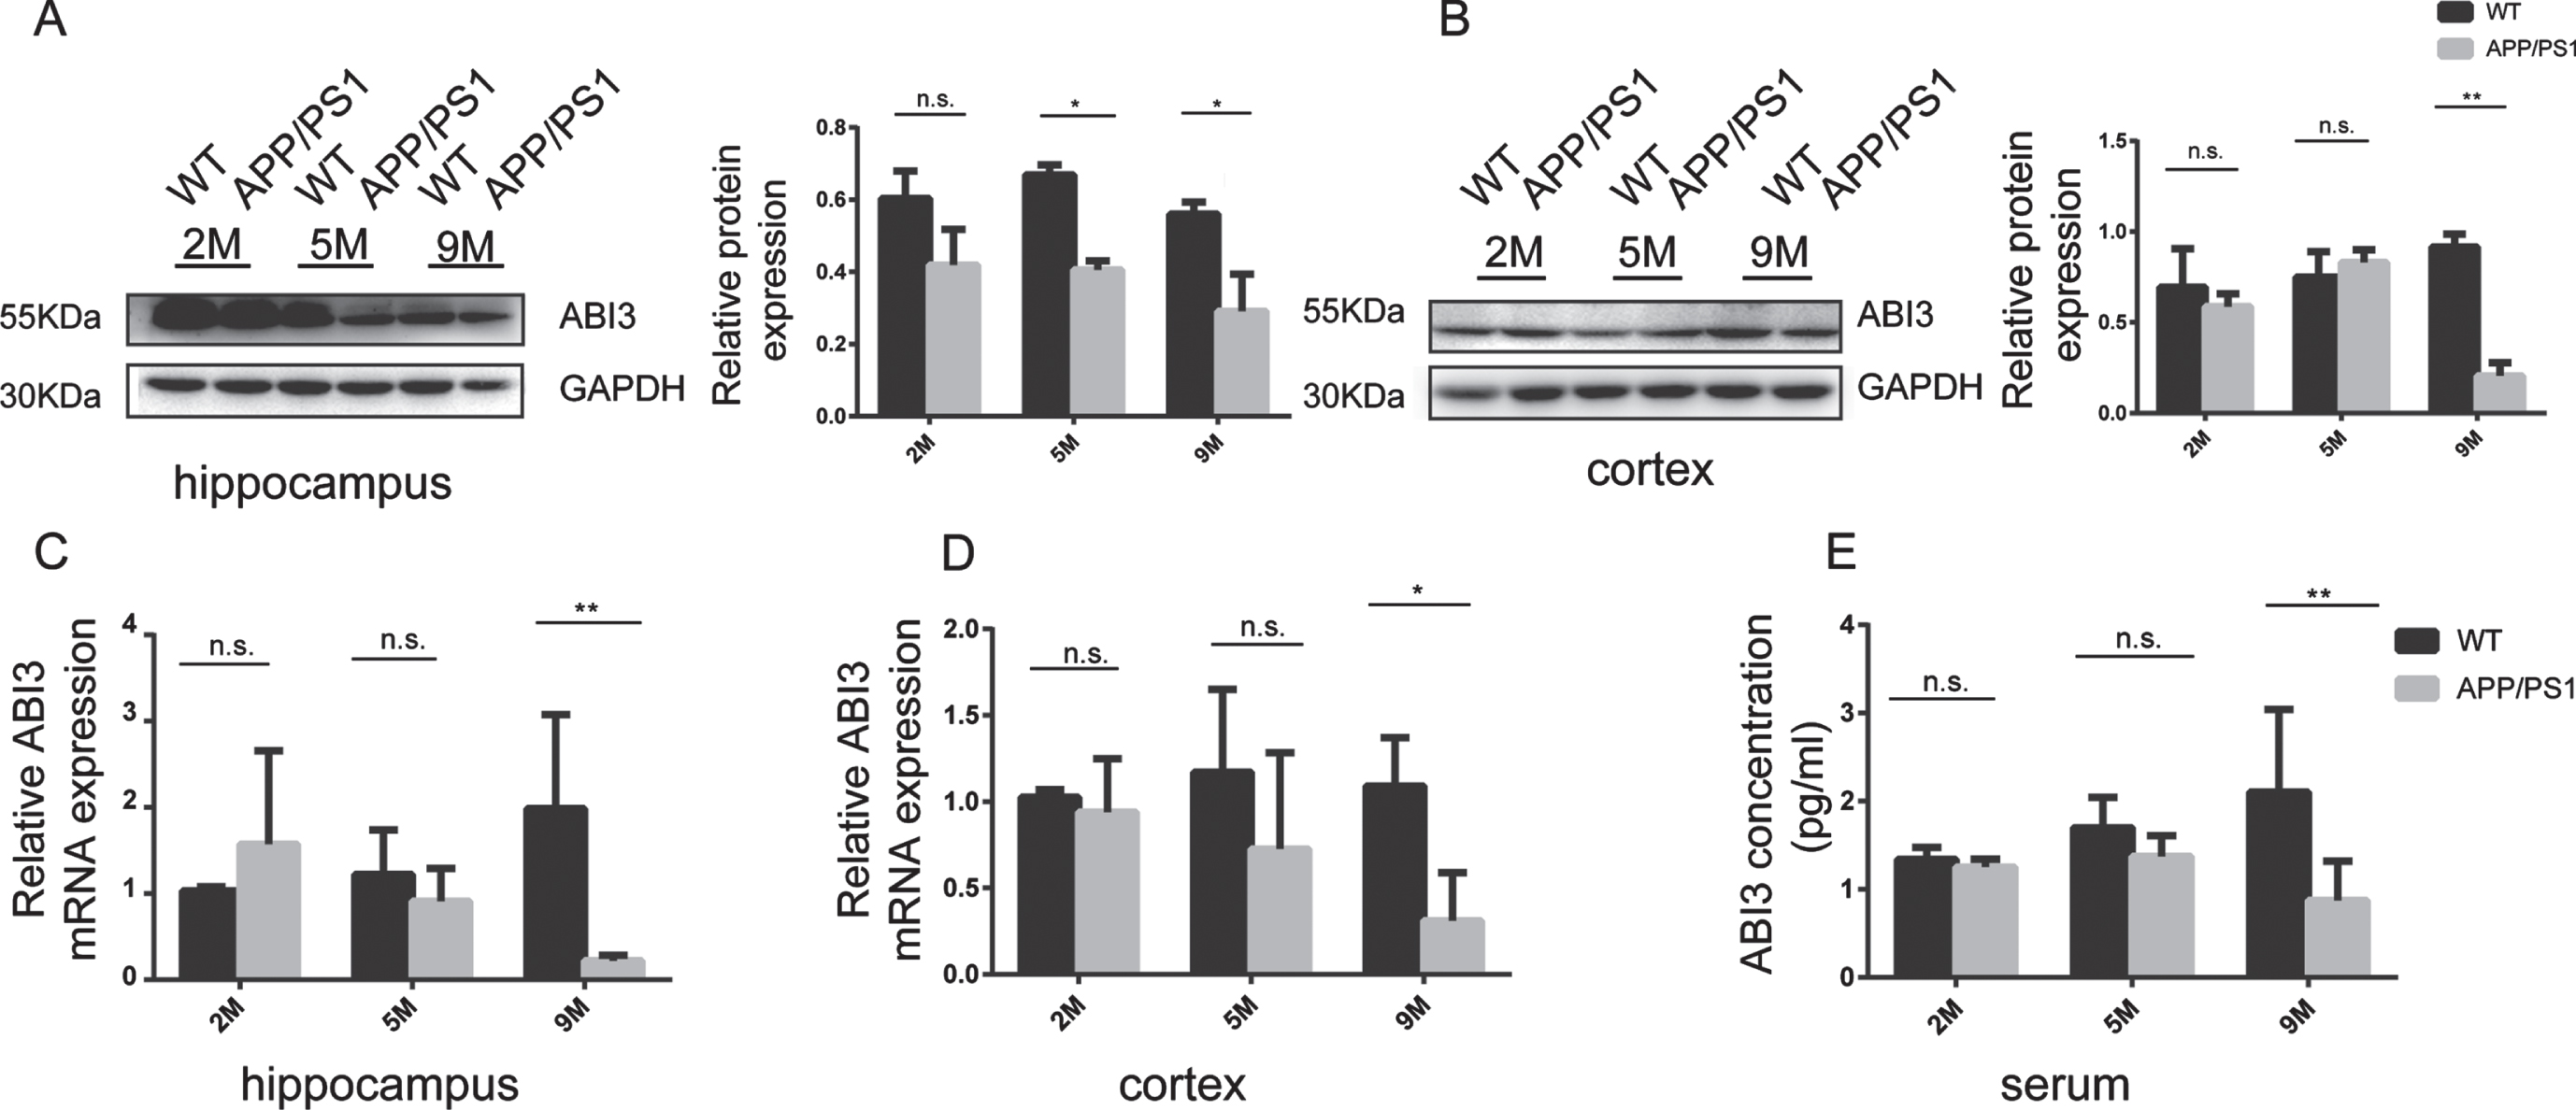
The expression level of ABI3 in APP/PS1 mice at different ages. A) The ABI3 protein levels in the hippocampus of the 2-, 5-, and 9-month-old APP/PS1. B) The ABI3 protein levels in the cortex of the 2-, 5-, and 9-month-old APP/PS1. C) The ABI3 mRNA levels in the hippocampus of the 2-, 5-, and 9-month-old APP/PS1. D) The ABI3 mRNA levels in the cortex of the 2-, 5-, and 9-month-old APP/PS1. E) Concentrations of serum ABI3 in the 2-, 5-, and 9-month-old APP/PS1. n = 3 in each group. Data are representative of at least three independent experiments.
The correlation between ABI3 levels with the cognitive capacity in APP/PS1 mice
In order to explore the correlation between ABI3 and cognitive function in APP/PS1 mice, we used Morris water maze to detect the cognitive function of APP/PS1 mice in different months, and linear regression analysis to verify the correlation between ABI3 and mean escape latency. Serum ABI3 showed a significantly negative correlation with mean escape latency (Fig. 6A). Linear regression analysis showed that the protein expression of ABI3 in hippocampus was negative correlation with mean escape latency (Fig. 6E). However, this correlation was not observed in the cortex (Fig. 6D). We used ELISA to detect Aβ1 - 40 and Aβ1 - 42 in the brain of APP/PS1 mice. Linear regression analysis showed that the serum ABI3 was negative correlation with Aβ1 - 42, but not observed with Aβ1 - 40 (Fig. 6B, C). The protein expression of ABI3 in hippocampus showed a significantly negative correlation with Aβ1 - 40 and Aβ1 - 42, but there was no significant difference in the cortex (Fig. 6F-I). Collectively, these data indicate that ABI3 was significantly correlated with cognitive function in APP/PS1 mice, which may reflect an important mechanism in the brain and could be used for the diagnosis of AD.
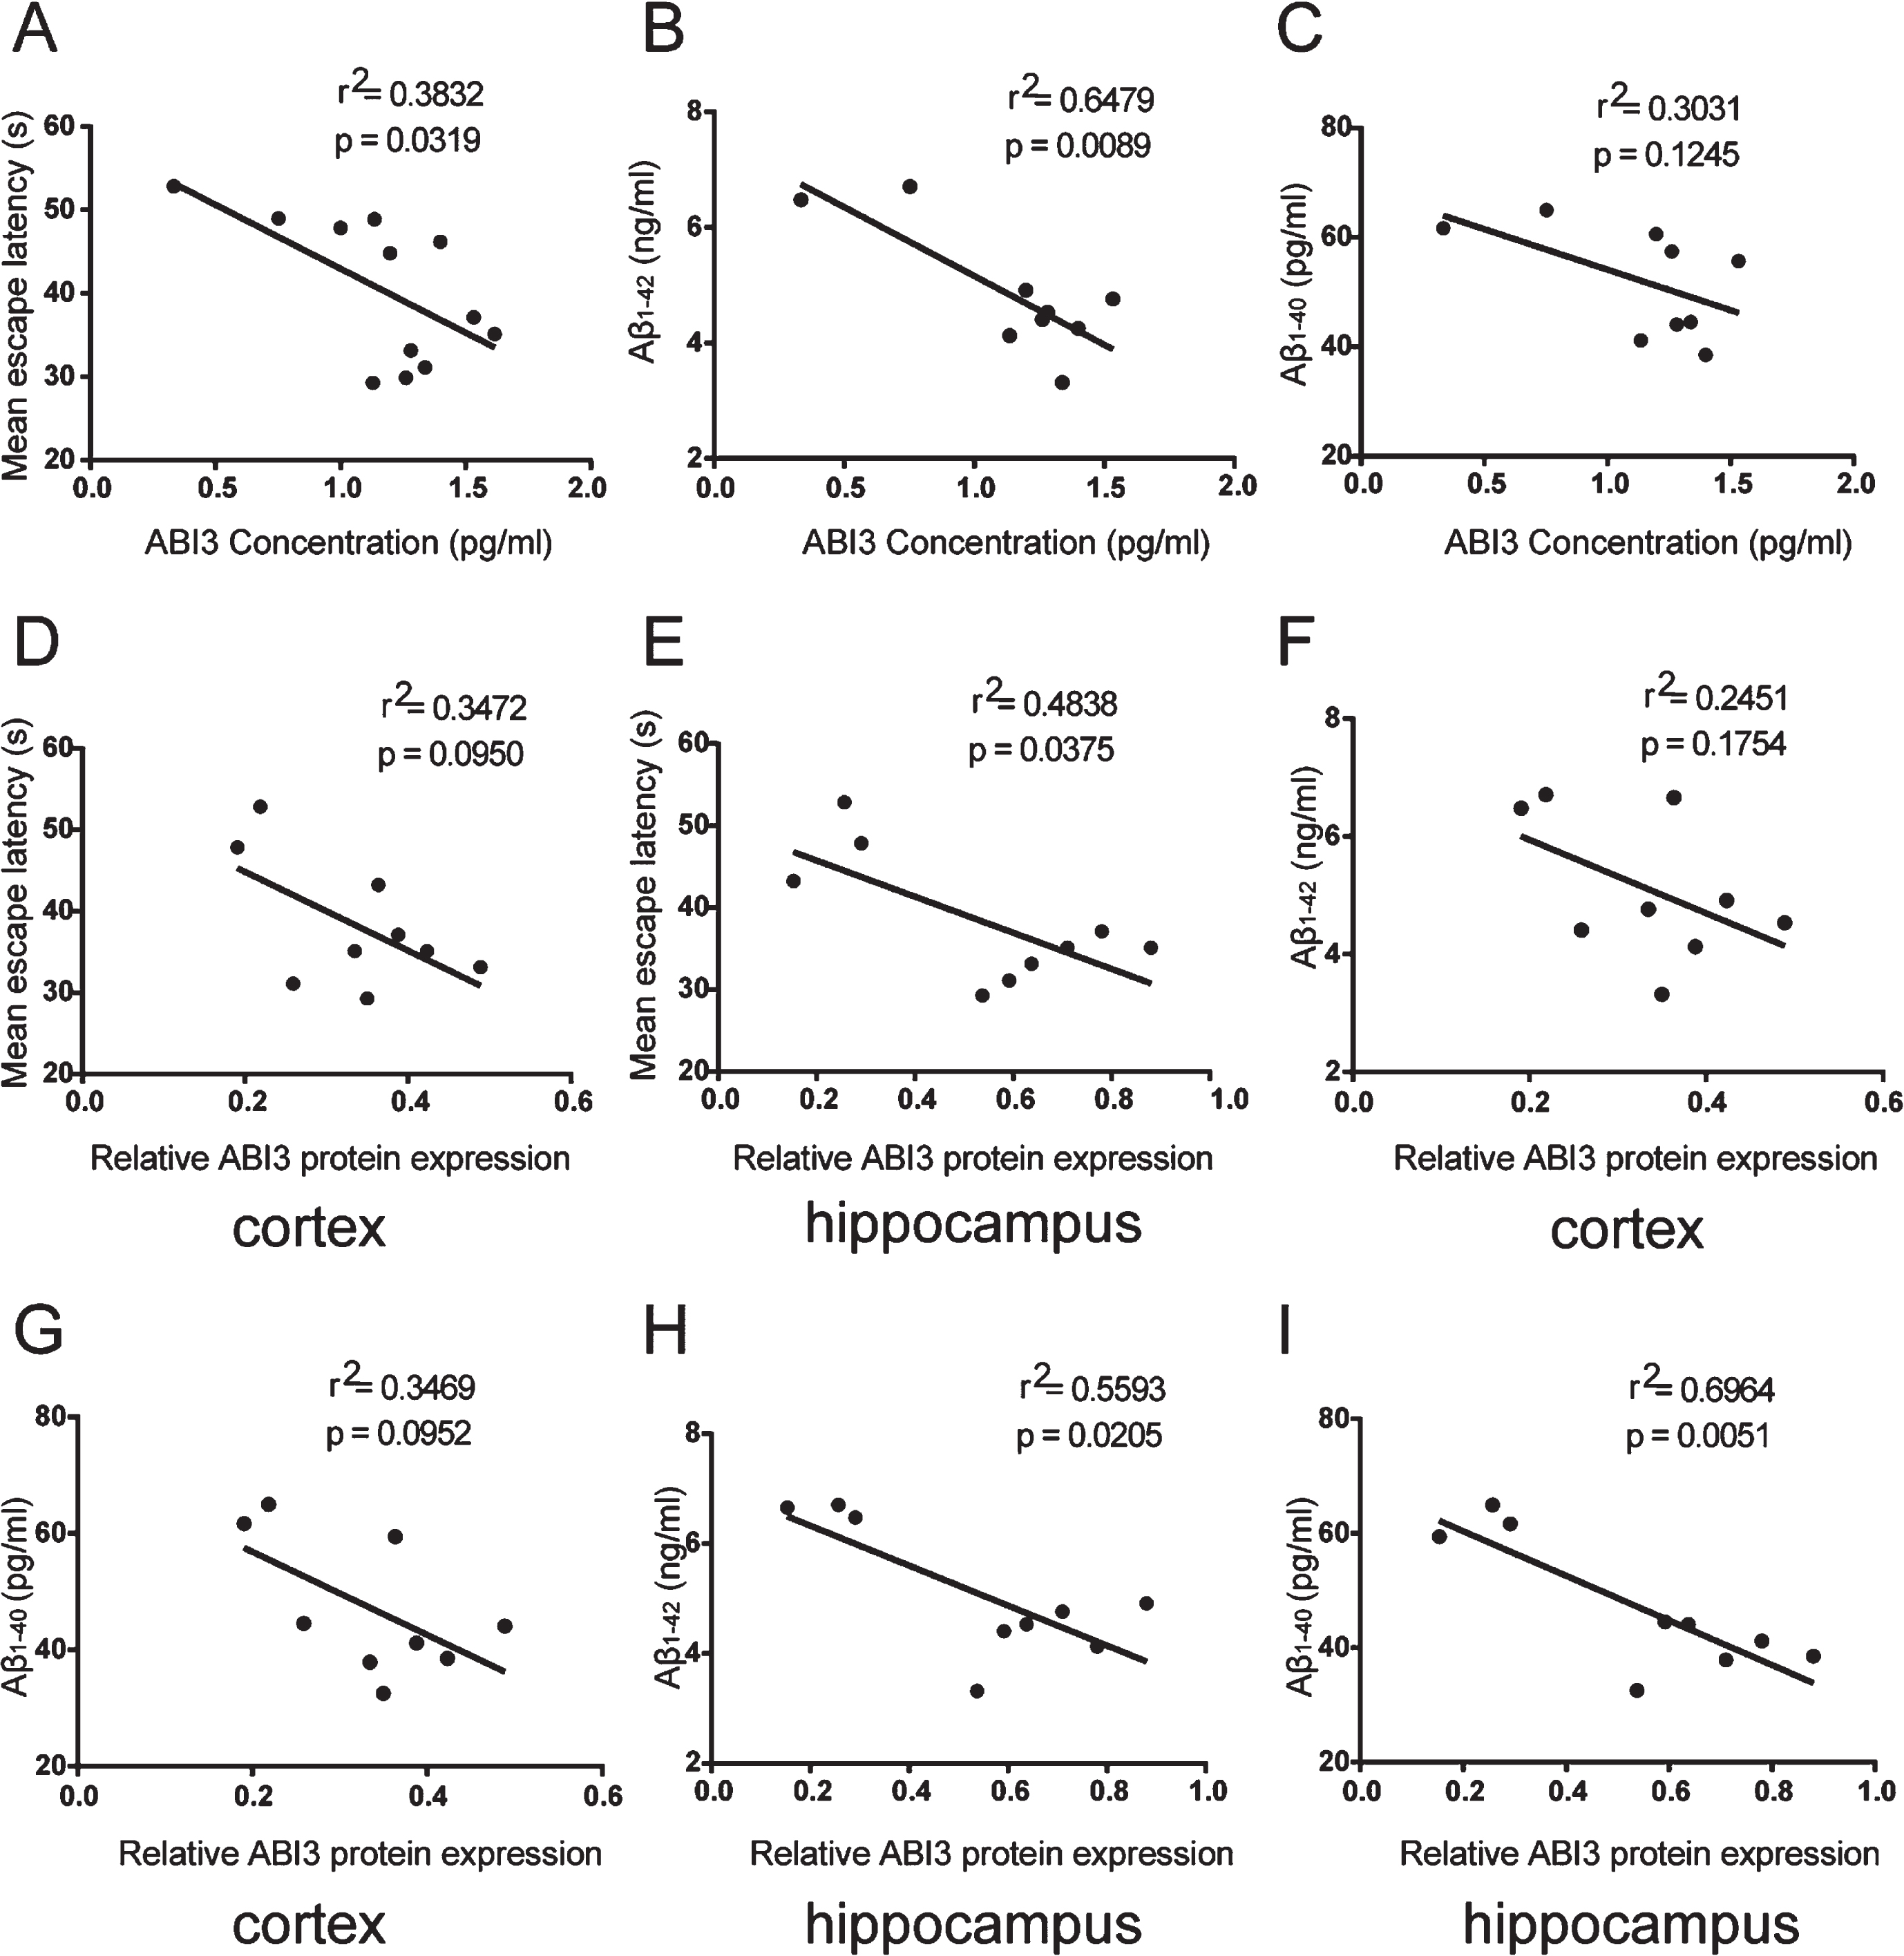
The correlation between ABI3 levels with the cognitive capacity in APP/PS1 mice. A) The relationship of the serum ABI3 concentration with the mean escape latency in APP/PS1 mice. B) The relationship of the serum ABI3 concentration with Aβ1 - 42 in the brain tissue of different ages APP/PS1 mice. C) The relationship of the serum ABI3 concentration with Aβ1 - 40 in the brain tissue of different ages APP/PS1 mice. D) The relationship of the ABI3 protein level in cortex with the mean escape latency in APP/PS1 mice. E) The relationship of the ABI3 protein level in hippocampus with the mean escape latency in APP/PS1 mice. F) The relationship of the ABI3 protein level in cortex with Aβ1 - 42 in the brain tissue of different ages APP/PS1 mice. G) The relationship of the ABI3 protein level in cortex with Aβ1 - 40 in the brain tissue of different ages APP/PS1 mice. H) The relationship of the ABI3 protein level in hippocampus with Aβ1 - 42 in the brain tissue of different ages APP/PS1 mice. I) The relationship of the ABI3 protein level in hippocampus with Aβ1 - 40 in the brain tissue of different ages APP/PS1 mice.
DISCUSSION
AD is defined as one of the most common cause of dementias among the elderly. The clinical manifestations of the disease begin with memory difficulties; further develop into a sustained decline in several other aspects of cognitive function [11]. The treatment of AD is mainly to slow down cognitive decline; the crucial role of the treatment is the timely neuroprotective drugs delivery before the presence of mild cognitive impairment. Therefore, it is the most important to search potential biomarkers for diagnosis AD in early stages.
At present, the biomarkers of AD are mainly based on the CSF. Because of the amyloid plaque and tau protein theories, CSF Aβ40, Aβ42, and T-tau have been included in diagnostic criteria [12]. Recently discovered biomarkers for AD include neurofilament light chain [13], neurogranin [14], growth-associated protein 43 [15], and visinin-like protein-1 [16]. These biomarkers are mainly found in CSF. However, lumbar puncture is an invasive procedure; it is difficult to perform it in a health examination.
The development of blood-based biomarkers is a key prerequisite for improving the diagnosis, prevention, and therapy of AD. This topic is a common research area based on convenience, acceptability, and ease of testing, as well as reducing costs. The pathological changes of AD mainly occur in the brain. Due to the existence of the blood-brain barrier, the accuracy of biomarkers based on blood in the diagnosis of AD has attracted wide attention. Some researchers have found that the blood-brain barrier is broken down during the course of AD [17]. Therefore, it provides a basis for the study of blood biomarker.
Because the amyloid cascade hypothesis cannot accurately explain neuronal damage in AD, the role of neuroinflammation has attracted increased attention [18]. Microglia has emerged as crucial players in neuroinflammation. Microglia are innate immune cells in the central nervous system that play an important role in immunosurveillance. Microglia are believed to have a dual role in AD. On the one hand, in the early stage of inflammation, microglia are activated to release inflammatory factors and clear Aβ deposition, playing a protective role; on the other hand, with the development of disease, activated microglia can be harmful to neurons, leading to a further decline in memory [19]. One currently confirmed heritable gene associated with sporadic AD is the APOE gene, whose APOE4 variant confers an approximately threefold increased risk of developing AD [20]. Through GWASs, more than 20 genetic loci have been identified that may be associated with late-onset AD; including ABI3 which is exclusively expressed in microglia [21]. There have been few reports on the Abi3 gene. The purpose of this study was to explore the possibility of ABI3 as an AD biomarker.
ABI3 is derived from the Abi interactor (Abi) family, which also includes ABI-1 and ABI-2. Abi family proteins are mainly responsible for the regulation of the actin cytoskeleton. The expression of ABI3 in human brain tissue has not been fully elucidated, but some research has identified intense ABI3 immunoreactivity in microglia in healthy control or AD subjects [22]. ABI3 is a constituent part of the WAVE regulatory complex, which regulates actin cytoskeleton organization. ABI3 is probably involved in microglial motility and/or phagocytosis via the formation of podosomes [23]. When amyloid plaques occur in the brain tissue, the main response of microglia is rapid retraction of the basic steady state from ramified/surveilling into a more amoeboid macrophage-like phagocytic cell [24]. ABI3 may be related to microglial migration onto amyloid plaques.
The purpose of this study was to further investigate the role of ABI3 in AD and whether serum ABI3 could be a blood-based biomarker for AD. The main findings of our research are that 1) the serum ABI3 level of the AD patients was significantly lower than that of the healthy controls. As AD progresses, serum ABI3 concentrations gradually decreases. 2) A similar phenomenon was found in ABI3 in CSF. 3) The ABI3 concentration in PBMCs was similar that in serum no matter in the mRNA or protein level. 4) The ABI3 levels decreased gradually with age in the brain tissue of the APP/PS1 mice, and the level of ABI3 showed significant correlations with cognitive function of APP/PS1 mice.
The definition for biomarkers must be specific, sensitive, reproducible, stable, and easy to obtain. Serum ABI3, as a potential biomarker for AD, has the above characteristics and can aid with the early diagnosis of AD. ABI3 is mainly expressed in microglia and participates in chronic inflammation. Overactivation of microglia and its mediated neuroinflammatory response are one of the important pathogenic factors of AD. This study mainly found that serum ABI3 decreased in patients with AD; however, the mechanism of ABI3 on microglia will be further studied. A few limitations of the study must be acknowledged. First, the research was conducted on a mainly Chinese Han population with a limited sample size; thus, more subjects with a broader demographic range are needed. Second, only three neurodegenerative diseases were assessed in this study, and other neurodegenerative diseases such as Lewy bodies, frontotemporal dementia, and autoimmune encephalitis, should be investigated [25]. Third, we did not conduct a longitudinal study of serum ABI3 content observed in the same group of patients from MCI to DAT, and changes in the serum ABI3 concentration were observed. In conclusion, the present results tried to demonstrate that ABI3 in serum, CSF, and PBMCs could be a novel early diagnostic biomarker of AD. Serum ABI3 is linked statistically and biologically to cognitive function. Moreover, ABI3 had potential to be a novel tracer marker in hippocampus of early AD.
Footnotes
ACKNOWLEDGMENTS
This work was supported by the Xuanwu Hospital of Capital Medical University (Beijing, China) and Capital Medical University (Beijing, China), as well as the State Key Program of National Natural Science Foundation of China (No. 82030064); National Natural Science Foundation of China (No. 81871714, 81901406); Beijing: Sail Plan for Talents Development (ZYLX202114) Beijing Key Clinical Specialty; Talent Training Plan (DFL20180803).