
Abstract
Background:
Increasing evidence has suggested that iron accumulation plays an important role in the onset and development of Alzheimer’s disease (AD). However, the potential mechanism remains unclear.
Objective:
The present study investigated the associations of cerebrospinal fluid (CSF) ferritin, an indicator for brain iron load, with neurodegenerative and inflammatory changes in AD.
Methods:
The study involved 302 participants from the Alzheimer’s Disease Neuroimaging Initiative (ADNI). They were classified as normal controls (A–T–N–, n = 48), AD continuum (A+TN–, n = 46; A+TN+, n = 166), and suspected non-AD pathology (A–TN+, n = 42), according to the amyloid/tau/neurodegeneration (ATN) system. Group comparisons of CSF ferritin among groups were performed using one-way ANOVA. Linear regression models were used to test the relationships between CSF ferritin and cognitive assessments, and the associations between CSF ferritin and other biomarkers, respectively.
Results:
We found that CSF ferritin showed significant differences among the ATN groups, with higher concentration in more advanced categories (A+TN+). Furthermore, CSF ferritin level was independently related to cognitive performance (MMSE, ADAS-Cog13, and ADNI-mem). Linear regression analysis indicated positive relationships between CSF ferritin and phosphorylated tau and total tau, rather than Aβ42. Significant associations were revealed between CSF ferritin and inflammatory proteins, including TNF-α, TNFR1, TNFR2, ICAM1, VCAM1, TGF-β1, IL-9, and IP-10, respectively.
Conclusion:
Our results provide new insight into iron dysfunction in AD pathology and highlight elevated brain iron as a possible mechanism of neurodegeneration and neuroinflammation along AD continuum.
INTRODUCTION
Alzheimer’s disease (AD) is the most common cause of dementia among the elderly [1]. Pathologically, the disorder is characterized by deposition of amyloid-β (Aβ) in senile plaques (SP) and intraneuronal accumulation of hyperphosphorylated tau [2]. In 2018, the National Institute of Aging-Alzheimer’ Association (NIA-AA) proposed a new stratification framework [3]. This framework considers AD as a continuum and weighs the diagnostic probability of the disease with different pathologic biomarkers [4], rather than a “probable” diagnosis based on the clinical presentation. The relevant biomarkers are grouped into Aβ deposition (A), tau pathology (T), and neurodegeneration (N). Based on this scheme, it is possible to make an early biomarker-based diagnosis even at the preclinical stage. Furthermore, the ATN classification provides a multidimensional approach to getting insight into the evolution of AD biomarkers.
In recent years, it has been increasingly recognized that brain iron overload plays a critical role in AD. Iron accumulation destroys microenvironment in central nervous system (CNS) through induction of ferroptosis, oxidative stress, and neuroinflammation [5–7]. Elevated iron level is found in the hippocampus and cortical areas of AD patients, which are mostly affected regions of the disorder. The presence of iron in SP, neurofibrillary tangles, and local areas of neuronal death supports that iron promotes neurodegenerative changes in AD [8, 9]. Further studies have shown that iron acts with Aβ aggregates and abnormally modified tau proteins. A disruption of iron homeostasis is thought to play an important role in the formation of toxic Aβ oligomers and plaques [10]. It is also believed that iron works in synergy with Aβ to affect the structural integrity of entorhinal cortex and medial temporal lobe [11]. Besides, neuroimaging studies have revealed a consistent aggregation of insoluble tau along with obvious iron accumulation in AD patients. Moreover, a significant mediation effect of iron burden on the relationship between au in positron emission tomography (PET) and cortical thickness was found, suggesting a modulatory effect of iron deposition during disease progression [12, 13]. As a reliable indicator for iron burden, cerebrospinal fluid (CSF) ferritin reflects the status of this metal in brain [14, 15] and is also reported to be associated with AD pathology [13, 16]. A large amount of ferritin exists in and around SP, promoting the accumulation of Aβ and the increase of SP volume and quantity [17]. However, the potential role of iron accumulation in AD remains unclear.
Because of the exploratory nature of the study, no a priori hypothesis was put forward. We explored the changes of iron load with different pathophysiological profiles of AD based on the “ATN” classification, and innovatively investigated its associations with neurodegenerative and inflammatory changes in individuals from the Alzheimer’s Disease Neuroimaging Initiative (ADNI) database.
MATERIALS AND METHODS
Data used for the study were obtained from the ADNI database (http://adni.loni.usc.edu). As a public-private partnership led by Principal Investigator Michael W. Weiner, MD, the ADNI was launched in 2003 to explore whether serial MRI and PET, other biological markers, and clinical and neuropsychological assessments can be combined to measure the progression of mild cognitive impairment (MCI) and early clinical AD [18]. Participants in ADNI were aged between 55–90 (inclusive), diagnosed as cognitively normal (CN), MCI, or AD dementia, and underwent serial evaluation of functional, biomedical, neuropsychological, and clinical status at intervals [19]. ADNI was reviewed and approved by all host study site review boards. All participants have completed informed consents, after receiving a comprehensive description of the project.
Study population
The study consisted of 302 participants from the ADNI cohort, including 89 CN, 145 MCI, and 68 AD individuals. The included subjects should be available of CSF ferritin, Aβ42, total tau (t-tau), phosphorylated tau (p-tau), and the neuropsychological scales, including Geriatric Depression Scale (GDS), Mini-Mental State Examination (MMSE), CDR-Sum of Boxes (CDR-SB), Alzheimer’s disease Assessment Scale-cognitive subscale (ADAS-Cog13), and a validated summary composite for memory (ADNI-mem) [20]. Plasmatic ferritin and full blood count data were obtained in order to discard the presence of ferropenic or chronic systemic anemia. In addition, apolipoprotein E (ApoE) ɛ4 allele carrier status (dichotomized into carriers versus non-carriers) and AD-medication (acetylcholinesterase inhibitor and NMDA receptor antagonist) use were recorded. Acetylcholinesterase inhibitors included donepezil, rivastigmine, and galantamine. The NMDA receptor antagonist refers to memantine.
Based on the NIA-AA framework guidelines [3], participants were stratified by their CSF biomarker profiles, following the ATN scheme. “A” stands for amyloid and is reflected by CSF Aβ42; “T” stands for tauopathy and is reflected by CSF phosphorylated tau (p-tau); and “N” stands for neurodegeneration and is reflected by CSF total tau (t-tau), respectively. Their values were binarized into normal versus abnormal for ATN classification. Participants were further divided into four groups: A-T-N-, A+T-N-, A+TN+, and A-TN+. A-T-N- indicated normal control. Individuals along the AD continuum were defined as A+T-N- and A+TN+. A+T-N- represents participants with preclinical AD before the initiation of any changes associated with amyloid pathology, while those with either abnormal tau pathology (T) or neurodegeneration (N) were merged into A+TN+ to reduce the number of comparison groups, and avoid spurious results and low statistical power. Furthermore, A-TN+ was defined as suspected non-AD pathology (SNAP), reflecting a variety of other brain disorders (e.g., stroke, age-related tauopathies, Lewy body dementia) that could contribute to neurodegeneration [21].
Measurement of CSF ferritin and other established biomarkers
A detailed description of biomarker acquisition and measurement can be obtained from ADNI database (http://adni.loni.usc.edu). CSF ferritin was measured with the RBM multiplex platform. CSF Aβ42, p-tau, and t-tau were measured with the multiplex xMAP Luminex platform [22]. TaqMan quantitative polymerase chain reaction assays were used for genotyping APOE nucleotides 334 T/C and 472 C/T with the ABI 7900 real-time thermocycler.
Assessment of inflammatory proteins in CSF
Fourteen CSF inflammatory proteins reported to be associated with AD were analyzed in the study. Previous study has revealed a close relationship between tumor necrosis factor-alpha (TNF-α) pathway and neuroinflammation in AD [23]. The associated molecules including tumor necrosis factor receptor 1 and 2 (TNFR1 and 2) were analyzed. As the downstream effectors of TNFR1 and 2, intercellular adhesion molecule 1 (ICAM1) and vascular cell adhesion molecule 1 (VCAM1) are known to be responsible for endothelial dysfunction and blood-brain barrier (BBB) disruption in AD [24]. Therefore, our study also included ICAM1 and VCAM1 in the analyses. Furthermore, pathways related to IL-7 and IL-10 were involved in microglial activation and AD pathogenesis [25, 26]. Thus, proinflammatory (IL-7, IL-12p40), anti-inflammatory cytokines (IL-10), and markers associated with T-helper cell activation (TGF-β, IL-6, and IL-21) were analyzed. Finally, interferon gamma-induced protein (IP-10), which participates in inflammation and angiogenesis in AD [27], was also enrolled in the study. All these proteins were analyzed at Emory University, Department of Neurology, Atlanta, GA. More information about the assays can be available on the ADNI website (http://adni.loni.usc.edu).
Statistical analysis
The statistical analyses were performed using IBM SPSS Statistics (Version 26, IBM, New York, USA). Boxplots were used to identify extreme values, and measurements were excluded if they fell more than three times the interquartile range above the third quartile or below the first quartile (ferritin: n = 3; Aβ42, n = 3; p-tau, n = 1; TNFR2, n = 2; TNF-α, n = 3; ICAM1, n = 6; VCAM1, n = 3; TGF-β1, n = 3; TGF-β2, n = 3; TGF-β3, n = 20; IL-6, n = 9; IL-7, n = 4; IL-10, n = 3; IL-12p40, n = 6). Normal distribution was checked graphically using histogram, Q-Q plots and numerically using Kolmogorov-Smirnov test for each biomarker. All CSF values were Ln-transformed to obtain a normal distribution, except for TNF-α and IP-10. Although Aβ42 and TGF-β3 did not satisfy Kolmogorov-Smirnov test after Ln-transformation, the normal Q-Q plots displayed a linear distribution of the scatter path. Therefore, we considered their transformed values were basically in accord with a normal distribution (Supplementary Figure 1). Group comparisons were performed using chi square test or one-way ANOVA with Bonferroni-corrected post-hoc test, as appropriate. Linear regression models were used to test the associations between CSF ferritin and other biomarkers. Considering that the observed associations might be affected by introducing cognitive outcome into the linear regression model, we included different sets of variables in two models: Model 1 was corrected for age, sex, APOE ɛ4, and ADNI-mem; Model 2 was corrected for age, sex, and APOE ɛ4, excluding ADNI-mem from the models to perform sensitivity analysis. Due to the skewed distribution of clinical scales, bootstrap regression analyses were used to test the relationships between CSF ferritin and cognitive assessments (MMSE, CDR-SB, ADAS-Cog13, and ADNI-mem), corrected for age, sex, and APOE ɛ4. We generated a bootstrapped 95% confidence interval for each regression coefficient (β). The bootstrapped confidence interval was based on 1000 replications, and the bias-corrected and accelerated bootstrap interval (the BCa interval) were reported. All statistical tests were regarded as significant at p < 0.05.

Boxplots of CSF ferritin and inflammatory factors in each group. Only biomarker with significant differences were presented. *p < 0.05, **p < 0.01, ***p < 0.001.
RESULTS
Characteristics of the study population
Table 1 summarized the demographic, neuropsychologic, CSF and hematological characteristics of the population (n = 302, including 48 A-T-N-, 46 A+T-N-, 166 A+TN+, and 42 SNAP). Among the groups, there were no significant differences in age (p = 0.139), gender (p = 0.866), and hematologic index, including plasma ferritin (p = 0.601), red blood cells (p = 0.130) and hemoglobin (p = 0.078). The proportion of APOE ɛ4 carriers varied among groups (p < 0.001), with lower proportions in A-T-N- (8.3%) and SNAP (16.7%). No statistical difference was found in GDS (p = 0.153). Yet, the cognitive tests differed among groups (p < 0.001), with lowest MMSE and ADNI-mem scores in A+TN+ (lower scores represent worse cognition), and highest CDR-SB and ADAS-Cog13 scores in A+TN+ (higher scores represent worse cognition). Compared with A-T-N-, the concentrations of Aβ42 were significantly lower in A+T-N- (p < 0.001) and A+TN+ (p < 0.001), while CSF t-tau and p-tau were relatively higher in A+TN+ (p < 0.001) and SNAP (p < 0.001). Fifty-one percent (n = 154) of the participants were given with one or more AD-medications (Table 1).
Demographic and clinical characteristics of the study population
aOne-way ANOVA, bChi square Test. APOE ɛ4, apolipoprotein E ɛ4; ADNI-mem, summary metric for memory; CSF, cerebrospinal fluid; Aβ42, amyloid-β42; t-tau, total tau; p-tau, phosphorylated tau; RBC, red blood cells; Hb, hemoglobin.
CSF ferritin and inflammatory proteins in ATN groups
The concentrations of CSF ferritin and inflammatory proteins in each group were shown in Table 2 and Fig. 1. Participants from A+TN+ showed significantly higher level of CSF ferritin, compared with A-T-N- (p = 0.042), and A+T-N- (p < 0.001), respectively. Higher concentration of CSF ferritin was also seen in SNAP, compared with A-T-N- (p = 0.011), and A+T-N- (p < 0.001).
CSF ferritin and inflammatory protein in each group
Mean concentrations of CSF ferritin and inflammatory proteins (SD) and results of one-way ANOVA group comparisons; *significant (p < 0.05) after Bonferroni correction for multiple comparisons.
Inflammatory markers, including TNFR1, TNFR2, and VACM1, followed a uniform pattern of changes, with a lower level in A+T-N- than normal controls (A-T-N-), moderately elevated in A+TN+, and reached the highest level in SNAP. A similar trend was observed for ICAM1, but without significant lower level in A+T-N-. For the remaining markers (TGF-β1 and IL-9), the highest concentrations were also detected in SNAP, but without any differences among the other groups.
Associations between CSF ferritin and cognitive assessments
Bootstrap regression analyses were used to study the associations between CSF ferritin and cognitive performances (Table 3). Among all individuals, CSF ferritin was negatively associated with ADNI-mem [β (95% CI) = –0.433 (–0.775, –0.104), p < 0.05], MMSE [β (95% CI) = –0.125 (–0.240, –0.003), p < 0.05], and positively related to ADAS-Cog13 [β (95% CI) = 0.044 (0.010, 0.086), p < 0.05]. The negative association of MMSE with CSF ferritin were also observed in A+TN+ [β (95% CI) = –0.204 (–0.376, –0.052), p < 0.05] and SNAP [β (95% CI) = –0.416 (–0.775, 0.029), p < 0.05]. Moreover, CSF ferritin was positively related to CDR-SB scores [β (95% CI) = 0.489 (–0.016, 0.761), p < 0.05] in SNAP.
Bootstrap regression analyses of the interaction effect between clinical scales and ferritin
The bias-corrected and accelerated bootstrap interval (the BCa interval) from bootstrap analysis (based on 1000 bootstrap replicates) was used to test the associations between clinical scales and ferritin. Corrected for age, sex and APOE ɛ4. Significance: *p < 0.05.
Associations between CSF ferritin and other established biomarkers
As shown in Table 4 and Fig. 2, Model 1 revealed positive associations between CSF ferritin and t-tau in A+T-N- (β= 0.457, p < 0.05), A+TN+ (β= 0.272, p < 0.001) and SNAP (β= 0.438, p < 0.01), respectively. Similar relationships were observed between CSF ferritin and p-tau in A+T-N- (β= 0.394, p < 0.05), A+TN+ (β= 0.270, p < 0.001) and SNAP (β= 0.341, p < 0.05). These findings remained significant after excluding ADNI-mem from the model (Model 2) (Supplementary Table 1). However, no associations were found between CSF ferritin and Aβ42 in both models.
Associations between CSF biomarkers and ferritin
Linear regression analysis of the associations between CSF ferritin and Aβ42, t-tau, and p-tau. Model 1: Corrected for age, sex, APOE, and ADNI-mem score. Significance: *p < 0.05; **p < 0.01; ***p < 0.001.
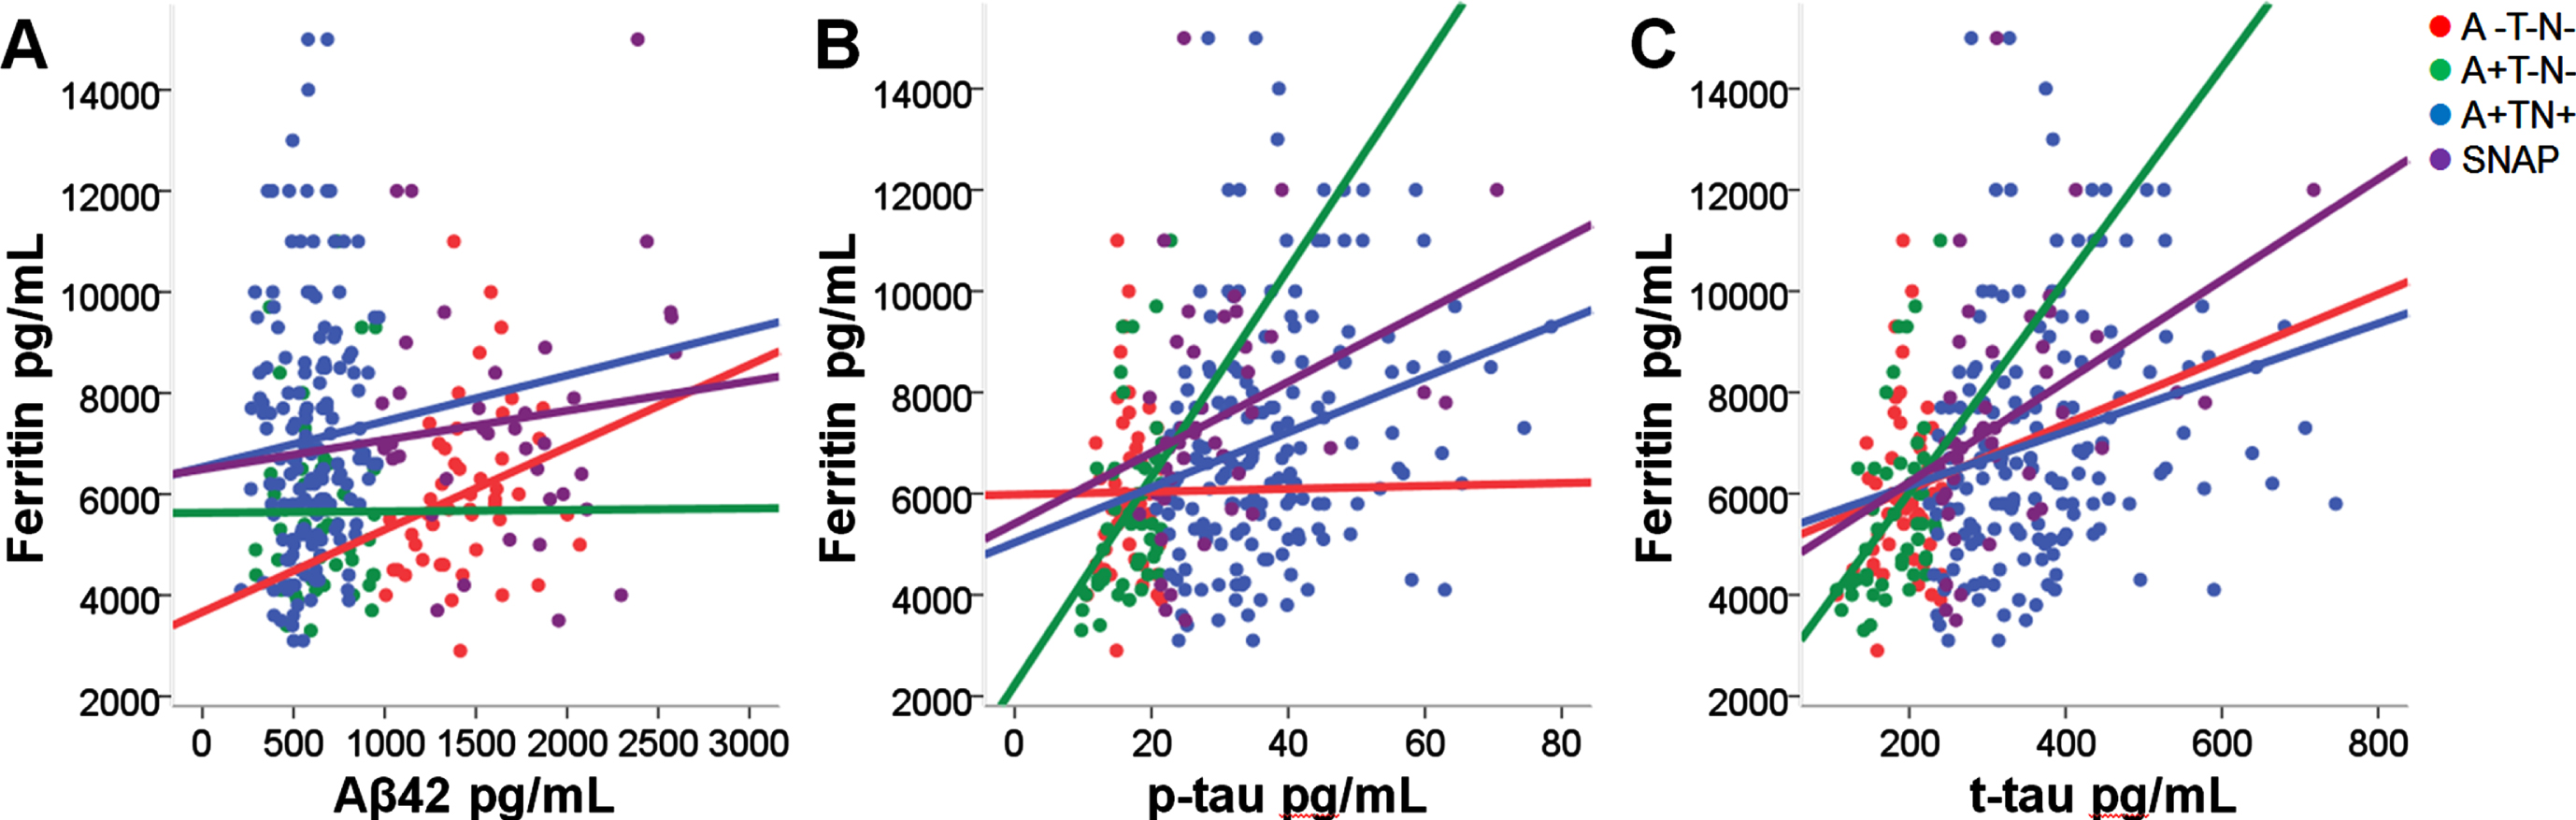
Correlations of CSF ferritin with other established biomarkers per ATN group.
Associations between CSF ferritin and inflammatory proteins
Among all individuals, Model 1 (Table 5 and Fig. 3) revealed that CSF ferritin was significantly correlated with TNFR1 (β= 0.419, p < 0.001), TFNR2 (β= 0.398, p < 0.001), TNF-α (β= 0.181, p < 0.01), ICAM1 (β= 0.253, p < 0.001), VCAM1 (β= 0.250, p < 0.01), TGF-β1 (β= 0.173, p < 0.05), IL-9 (β= 0.310, p < 0.001), and IP-10 (β= 0.180, p < 0.05); in A+T-N-, with TNFR2 (β= 0.388, p < 0.05); in A+TN+, with TNFR1 (β= 0.329, p < 0.01), TFNR2 (β= 0.303, p < 0.01), TNF-α (β= 0.186, p < 0.05), ICAM1 (β= 0.221, p < 0.05), TGF-β1 (β= 0.217, p < 0.05), IL-9 (β= 0.259, p < 0.01), and IP-10 (β= 0.228, p < 0.05); in SNAP, with TNFR1 (β= 0.497, p < 0.01), TNF-α (β= 0.415, p < 0.05), ICAM1 (β= 0.419, p < 0.05), and VCAM1 (β= 0.546, p < 0.05); and in normal controls, with TNFR2 (β= 0.419, p < 0.05). The interactions between CSF ferritin and inflammatory proteins in Model 2 (Supplementary Table 2) showed similar results, except for TNFR2 in A+T-N- (without significant difference).
Associations between CSF inflammatory proteins and ferritin
Linear regression analysis of the associations between CSF ferritin and inflammatory proteins. Model 1: Corrected for age, sex, APOE ɛ4, and ADNI-mem score. Significance: *p < 0.05; **p < 0.01; ***p < 0.001.

Correlations of CSF ferritin with inflammatory proteins per ATN group.
DISCUSSION
Iron is an essential element required for brain functions, including myelination, synaptic plasticity, oxidative metabolism, and synthesis of neurotransmitters. A growing body of evidence has suggested that brain iron accumulation plays an important role in AD. However, the relationship between iron overload in CNS, which could be indicated by CSF ferritin, and AD seems to be inconsistent. Ayton et al. [22] have previously reported their analysis of CSF ferritin based on ADNI data. Yet, they failed to find an increase of CSF ferritin level in AD, while Brosseron et al. [16] reported an elevation of CSF ferritin in MCI and AD. CSF ferritin has been reported to facilitate Aβ deposition and accelerate AD process [28]. However, some researchers believed that CSF ferritin is not affected by Aβ status, but positively associated with total tau [16]. Therefore, we took this study to understand the potential interrelations between CSF ferritin and AD pathology and the related inflammatory responses.
To determine the role of CSF ferritin along disease progression, we applied a biomarker-based ATN stratification framework. Our analyses showed that CSF ferritin was increased in late versus early AD categories and controls. Moreover, ferritin level was independently related to cognitive performance, especially when tau pathology and neurodegeneration occurred. Further analysis revealed that CSF ferritin was correlated with tauopathy (p-tau) and neuronal injury (t-tau), rather than amyloidosis (Aβ42). The strong relationships with p-tau and t-tau were also observed in non-AD spectrum neurodegenerative disorders. These findings suggested that ferritin increases when neurodegeneration occurs, even if Aβ pathology is absent.
Our results were in line with the previous report [16], which showed a positive correlation of CSF ferritin with levels of t-tau, rather than Aβ42. The possible mechanism is that iron could promote tau hyperphosphorylation via GSK-3β kinase, protein phosphatase 2A and the induction of Cdk5/P25 complex [29, 30]. It is also reported that aggregation of hyperphosphorylated tau is mediated by an iron-binding motif in the tau protein [31]. Furthermore, the hyperphosphorylated tau could block iron export and increase intracellular iron, subsequently upregulate ferritin [32]. The overexpression of ferritin could protect neurons by storing iron in the relatively inert Fe3 +. However, the catalytic sites required for Fenton reaction (i.e., a classical pro-oxidant reaction of iron) are exposed in ferritin, making it redox-active and neurotoxic [33]. The evidence above suggested that iron and tauopathy forms a vicious cycle to cause neurodegeneration in AD.
Another study has presented a different view, from our association analysis of CSF ferritin and Aβ pathology. Ayton et al. [28] reported CSF ferritin could predict Aβ decline when included as a dichotomous variable. However, they failed to present a robust result when CSF ferritin was included as a continuous variable. In recent years, clinical studies have shown that the correlation between iron and Aβ might be not causation, but synergy instead. Foster et al. [11] discovered the negative association between age and entorhinal cortex volume was present only in individuals with both elevated iron and Aβ, but not in those with elevated Aβ or iron alone. Further reports have proved that Aβ-induced cytotoxicity is tau-dependent [34, 35]. In an AD mouse model, Li et al. [36] found that iron accumulation in the hippocampus after Aβ injection was always accompanied by increased phospho-tau and persistent reduction of soluble tau, even after the clearance of Aβ. They also observed that in tau knockout mice, iron does not rise after Aβ intoxication. Therefore, the relation of CSF ferritin to amyloid is likely to be a byproduct of tau pathology. This helps explain why CSF ferritin did not increase in A+T-N-, and why significant correlation between CSF ferritin and Aβ42 was not observed. Only when tau pathology occurs (A+TN+ and SNAP group), could we see a striking increase of CSF ferritin. The synergistic effects of Aβ toxicity, tau pathology and iron dyshomeostasis accelerate the deleterious consequences of neurodegeneration, and the release of more iron and ferritin from damaged oligodendrocytes and neurons.
In recent years, increasing evidence has suggested that chronic neuroinflammation is a hallmark of AD [37]. It is proved that iron and inflammation are intertwined in a bidirectional relationship [38]. The main feature of iron dyshomeostasis is the increase of Fe2 +, leading to ferroptosis, oxidative stress, and neuroinflammation [6]. In turn, neuroinflammation is also associated with the alteration of iron homeostasis [39]. Although the connection between iron and inflammation has been established, the relationship between iron and neuroinflammatory phenotypes in AD are not fully understood. Therefore, we investigated the associations between CSF ferritin and a panel of inflammatory proteins. In consistent with a previous study [40], several inflammatory proteins have shown increased CSF concentrations in late versus early AD categories and controls, most of which are part of the TNF-α pathway. Furthermore, a strong positive association between CSF ferritin and TNF-α pathway-associated inflammatory proteins were presented, including TNFR1 and 2 and the downstream effectors (ICAM1 and VCAM1).
Our findings provide evidence of the relationships between iron and neuroinflammation. TNF-α is one of the best described AD-related inflammatory CSF biomarkers [41], and significantly increased in glia and neurons with iron overload [42]. Moreover, TNF-α can trigger hepcidin expression, which plays an important role in iron homeostasis [38, 43]. The binding of hepcidin to ferroportin results in a complex process of internalization and degradation of the iron carrier, generating the metal accumulation in neurons and subsequent neurodegeneration [44]. Our findings of ICAM1 and VCAM1 also support the possibility that endothelial dysfunction participates in the development of AD [45, 46]. These results imply that increased brain iron might affect AD via a ferritin-related TNF-α manner, and ultimately leading to alterations of the BBB and promotion of neurodegeneration.
Interestingly, TGF-β1, a trophic factor with neuroprotection [47], IL-10, a cytokine with predominant negative autocrine functions in microglia [48], and IP-10, a biomarker associated with tau pathology [49], were also correlated with ferritin in the most advanced AD category (A+TN+). However, limited evidence supports the results. Since iron chelation is proved to be beneficial to AD patients in clinic [50], the underlying molecular mechanism between iron and neuroinflammation merits further study.
Some limitations of the study should be acknowledged. First, our study only analyzed ADNI data at baseline, and longitudinal analyses are warranted. That would better demonstrate the role of iron in disease progression. Second, missing data, especially for the markers including IL-12p40, IL-9, and IP-10, may limit the number of the included cases. Third, we used CSF t-tau as the indicator of neurodegeneration. However, CSF t-tau may not be the most adequate measure to identify neurodegeneration in AD, for its tightly association to p-tau. Although biomarkers of other brain pathology (e.g., neurogranin and neurofilament light chain) might be preferable, we consider CSF t-tau would still be useful as a sensitive but nonspecific (N) biomarker. Because some proportion of cumulative brain injury would remain unexplained by other available biomarkers. Finally, following the NIA-AA Research Framework guidelines, we used CSF Aβ42 to stand for amyloid (A) in our study. Although CSF Aβ42 and Aβ42/40 ratio are considered interchangeable, Aβ42/40 ratio might be a better amyloid biomarker for classifying patients in clinical setting using the ATN scheme [51].
In conclusion, our study implicates iron as a contributing factor to AD pathology and introduces brain iron elevation as a possible mechanism for neurodegeneration and neuroinflammation along AD continuum. Understanding the role of iron in inflammatory responses is essential to find new therapeutic strategies for AD.
Footnotes
ACKNOWLEDGMENTS
Data collection and sharing for ADNI was funded by the Alzheimer’s Disease Neuroimaging Initiative (ADNI) (National Institutes of Health Grant U01 AG024904). ADNI is funded by the National Institute on Aging, the National Institute of Biomedical Imaging and Bioengineering, and through generous contributions from the following: AbbVie, Alzheimer’s Association; Alzheimer’s Drug Discovery Foundation; Araclon Biotech; BioClinica, Inc.; Biogen; BristolMyers Squibb Company; CereSpir, Inc.; Cogstate; Eisai Inc.; Elan Pharmaceuticals, Inc.; Eli Lilly and Company; EuroImmun; F. Hoffmann-La Roche Ltd and its affiliated company Genentech, Inc.; Fujirebio; GE Healthcare; IXICO Ltd.; Janssen Alzheimer Immunotherapy Research & Development, LLC.; Johnson & Johnson Pharmaceutical Research & Development LLC.; Lumosity; Lundbeck; Merck & Co., Inc.; Meso Scale Diagnostics, LLC.; NeuroRx Research; Neurotrack Technologies; Novartis Pharmaceuticals Corporation; Pfizer Inc.; Piramal Imaging; Servier; Takeda Pharmaceutical Company; and Transition Therapeutics. The Canadian Institutes of Health Research is providing funds to support ADNI clinical sites in Canada. Private sector contributions are facilitated by the Foundation for the National Institutes of Health (![]() ). The grantee organization is the Northern California Institute for Research and Education, and the study is coordinated by the Alzheimer’s Therapeutic Research Institute at the University of Southern California. ADNI data are disseminated by the Laboratory for Neuro Imaging at the University of Southern California.
). The grantee organization is the Northern California Institute for Research and Education, and the study is coordinated by the Alzheimer’s Therapeutic Research Institute at the University of Southern California. ADNI data are disseminated by the Laboratory for Neuro Imaging at the University of Southern California.
This study was also supported by Science and Technology Project of Huizhou (2017C0416032), Project of Young Innovative Talents in Colleges and Universities in Guangdong Province (2017GkQNCX078), Science and Technology Project of Gua-ngdong Province (2019B030316001) and Guang-zhou Municipal Key Discipline in Medicine (2021-2023). The funding sponsors had no role in the design and conduct of the study; collection, management, analysis, and interpretation of the data; and preparation, review, or approval of the manuscript.