
Abstract
Background:
Olfactory dysfunction is highly prevalent in dementia syndromes, including Alzheimer’s disease (AD) and frontotemporal dementia (FTD). The structural integrity of the olfactory bulb (OB) is thought to play a critical role in odor detection and identification, but no MRI study has measured OB volume in FTD, or measured OB volume longitudinally in AD.
Objective:
To measure OB volume in FTD and AD patients longitudinally using MRI.
Methods:
This study measured OB volumes using MRI in patients diagnosed with behavioral-variant FTD (n = 55), semantic dementia (n = 34), progressive non-fluent aphasia (n = 30), AD (n = 50), and healthy age-matched controls (n = 55) at their first visit to a dementia research clinic (‘baseline’). Imaging data in patients 12-months later were analyzed where available (n = 84) for longitudinal assessment. Volumes of subcortical and cortical olfactory regions (‘olfactory network’) were obtained via surface-based morphometry.
Results:
Results revealed that in AD and FTD at baseline, OB volumes were similar to controls, whereas volumes of olfactory network regions were significantly reduced in all patient groups except in progressive non-fluent aphasia. Longitudinal data revealed that OB volume became significantly reduced (10–25% volume reduction) in all dementia groups with disease progression.
Conclusion:
Olfactory dysfunction is common in patients diagnosed with AD or FTD, but our results indicate that there is no detectable volume loss to the OBs upon first presentation to the clinic. Our findings indicate that the OBs become detectably atrophied later in the disease process. OB atrophy indicates the potential usefulness for OBs to be targeted in interventions to improve olfactory function.
Keywords
INTRODUCTION
Smell plays a central role in life. We use smell for our enjoyment (e.g., food, flowers), warning against potential dangers (e.g., gas leaks, smoke), and for the initiation and maintenance of social and intimate relationships [1, 2]. Loss of smell, either partial (hyposmia) or complete (anosmia), is surprisingly common and found in ∼20% of the general population [3–5]. Qualitative olfactory disturbances, such as parosmia (i.e., distorted perception of an odor) [6] or phantosmia (i.e., olfactory hallucinations) [7] can also occur. Apart from aging, the most common causes for smell disturbances are sinonasal diseases, traumatic brain injury, head trauma, Parkinson’s disease, and dementia [8, 9].
Alzheimer’s disease and frontotemporal dementia (FTD) are two leading causes of younger-onset dementia [10–12] affecting people of working age. Alzheimer’s disease is typically characterized by progressive decline in episodic memory, attention, executive function, and visuospatial ability [13]. Brain atrophy in this syndrome is usually present in the medial temporal lobe (hippocampus, entorhinal cortex, perirhinal cortex), medial parietal lobe (posterior cingulate and retrosplenial cortices) as well as the occipital and prefrontal cortices [14]. In Alzheimer’s disease, olfactory dysfunction is well-established and affects odor detection, discrimination, and identification [15]. Around 90% of Alzheimer’s disease patients have olfactory dysfunction while around 60% have anosmia [16–18]. Importantly, most (>90%) patients are not aware of their olfactory dysfunction [19, 20], possibly due to atrophy in the olfactory cortical regions and/or severe attentional deficits [21]. Importantly, olfactory dysfunction in Alzheimer’s disease has been proposed as a marker of disease onset, often preceding cognitive deficits, and worsening over time [15, 22].
FTD is an umbrella term for a group of disorders affecting the frontal and anterior temporal lobes [14, 23]. Three clinical variants are recognized: a behavioral variant (bvFTD) and two language presentations—semantic dementia and progressive non-fluent aphasia (PNFA) [24, 25]. bvFTD is characterized by progressive changes in behavior and personality [26, 27]. These features are associated with atrophy in the orbital and medial prefrontal lobes [28]. Semantic dementia is characterized by progressive loss of semantic knowledge [29, 30] due to anterior temporal lobe atrophy that is usually asymmetrical and left-predominant [31, 32]. A smaller number of cases, known variously as right-semantic dementia or ‘right temporal variant’ FTD, show right-predominant temporal lobe atrophy which is characterized by prosopagnosia, behavioral changes, and episodic memory impairments [33, 34]. Finally, PNFA is characterized by effortful and distorted speech, and/or agrammatism [29, 30] associated with atrophy in the left inferior frontal gyrus (around Broca’s area), anterior insula and premotor cortex [35, 36].
Olfactory deficits are also common in bvFTD, with up to 95% of patients showing impairments including 50% experiencing anosmia [37–40]. Unlike Alzheimer’s disease, however, deficits are specific to odor identification, with odor discrimination remaining relatively intact [37, 41], a profile also observed in semantic dementia [37, 43]. Olfactory function has not been investigated in right-semantic dementia and the few available studies on PNFA suggest that deficits may be present to a similar extent as bvFTD and semantic dementia [38, 39]. Whether olfactory dysfunction changes over time in FTD has not yet been explored.
The neurobiological basis of olfactory dysfunction in dementia remains poorly understood but appears multifactorial, including abnormal protein aggregates (e.g., neurofibrillary tau tangles), disruption to neurotransmitter systems (e.g., the serotonergic neuromodulatory system), and atrophy across multiple regions of the olfactory pathway [44]. Of note, depression is common in dementia syndromes [45] and depression has been associated with olfactory dysfunction and reduced volume of the olfactory bulb (OB) [46, 47].
The OB is the first relay of olfactory information from the nose to the brain [48] and its microstructural organization plays a central role in odor detection and identification [49, 50]. Accumulation of both tau and amyloid-β in the OB has been reported at postmortem in Alzheimer’s disease [51, 52]. Neuroimaging studies have also reported atrophy of the OB and olfactory tract in Alzheimer’s disease and mild cognitive impairment [46, 53–55] but no MRI studies have investigated OB integrity longitudinally in Alzheimer’s disease.
Whether OB integrity is preserved in FTD is unclear with only two postmortem studies conducted to date which reported conflicting findings. Severe OB atrophy and protein inclusions were found in a single case of Pick’s disease [56]. In contrast, Mundiñano et al. [52] found no significant difference in postmortem OB volume between 11 frontotemporal lobar degeneration (FTLD) cases (nine FTLD-tau, two FTLD-ubiquitin), and 15 healthy controls, although OB volumes varied widely in the FTLD group. So far, no MRI studies have examined OB integrity in vivo in FTD.
This study aimed to 1) investigate the presence of smell loss symptoms in Alzheimer’s disease and FTD and their relations with OB and olfactory network volume, and depression symptoms. It was hypothesized that smell loss symptoms would be common in all patient groups relative to controls and would be related to reduced OB integrity, reduced olfactory network integrity and greater depression symptoms; 2) measure OB volume at baseline in Alzheimer’s disease and FTD. It was hypothesized that the OB would be smaller in all patient groups relative to controls, given previous literature suggesting high prevalence of olfactory dysfunction in these disorders [37] and a general correlation between olfactory function and OB volume [57]. More specifically it was predicted that bvFTD would have smaller OB volumes than Alzheimer’s disease, semantic dementia, and PNFA due to greater atrophy in the orbital and medial frontal lobes where the OB is located; 3) measure OB volume longitudinally in Alzheimer’s disease and FTD to determine the effect of disease progression. It was hypothesized that OB atrophy would worsen with disease progression; and 4) investigate the integrity of other subcortical and cortical structures involved in olfaction. We hypothesized that there would be atrophy across the global ‘olfactory network’ in each disorder, given that olfactory regions overlap considerably with regions of neurodegeneration in both FTD and Alzheimer’s disease.
MATERIALS AND METHODS
Participants
Demographic, clinical, and imaging data of bvFTD (n = 55), semantic dementia (n = 34), PNFA (n = 30), and Alzheimer’s disease (n = 50) patients, and healthy controls (n = 55) were collected at FRONTIER, the frontotemporal dementia research clinic based at the Brain and Mind Centre in Sydney, Australia. Diagnosis was reached via consensus in line with current clinical diagnostic criteria [13, 29]. Approximately half of the dementia patients had a second MRI scan obtained during their follow-up visit 12 months later (range: 9–15 months). Controls were recruited from a volunteer database and local community clubs. All participants were free of significant and longstanding history of psychiatric or neurological disorders, drug or alcohol abuse, or significant head injury. In addition, healthy controls scored > 88/100 on the Addenbrooke’s Cognitive Examination (ACE) [58]. All participants underwent physical, neurological, neuropsychological, and neuroimaging examinations by a multidisciplinary team. Only four control participants had follow-up data available and thus, controls were not included in the longitudinal analysis. Neuropsychological and clinical assessment data were collected within three months of each scan. A flow chart of participant recruitment is presented in Fig. 1.
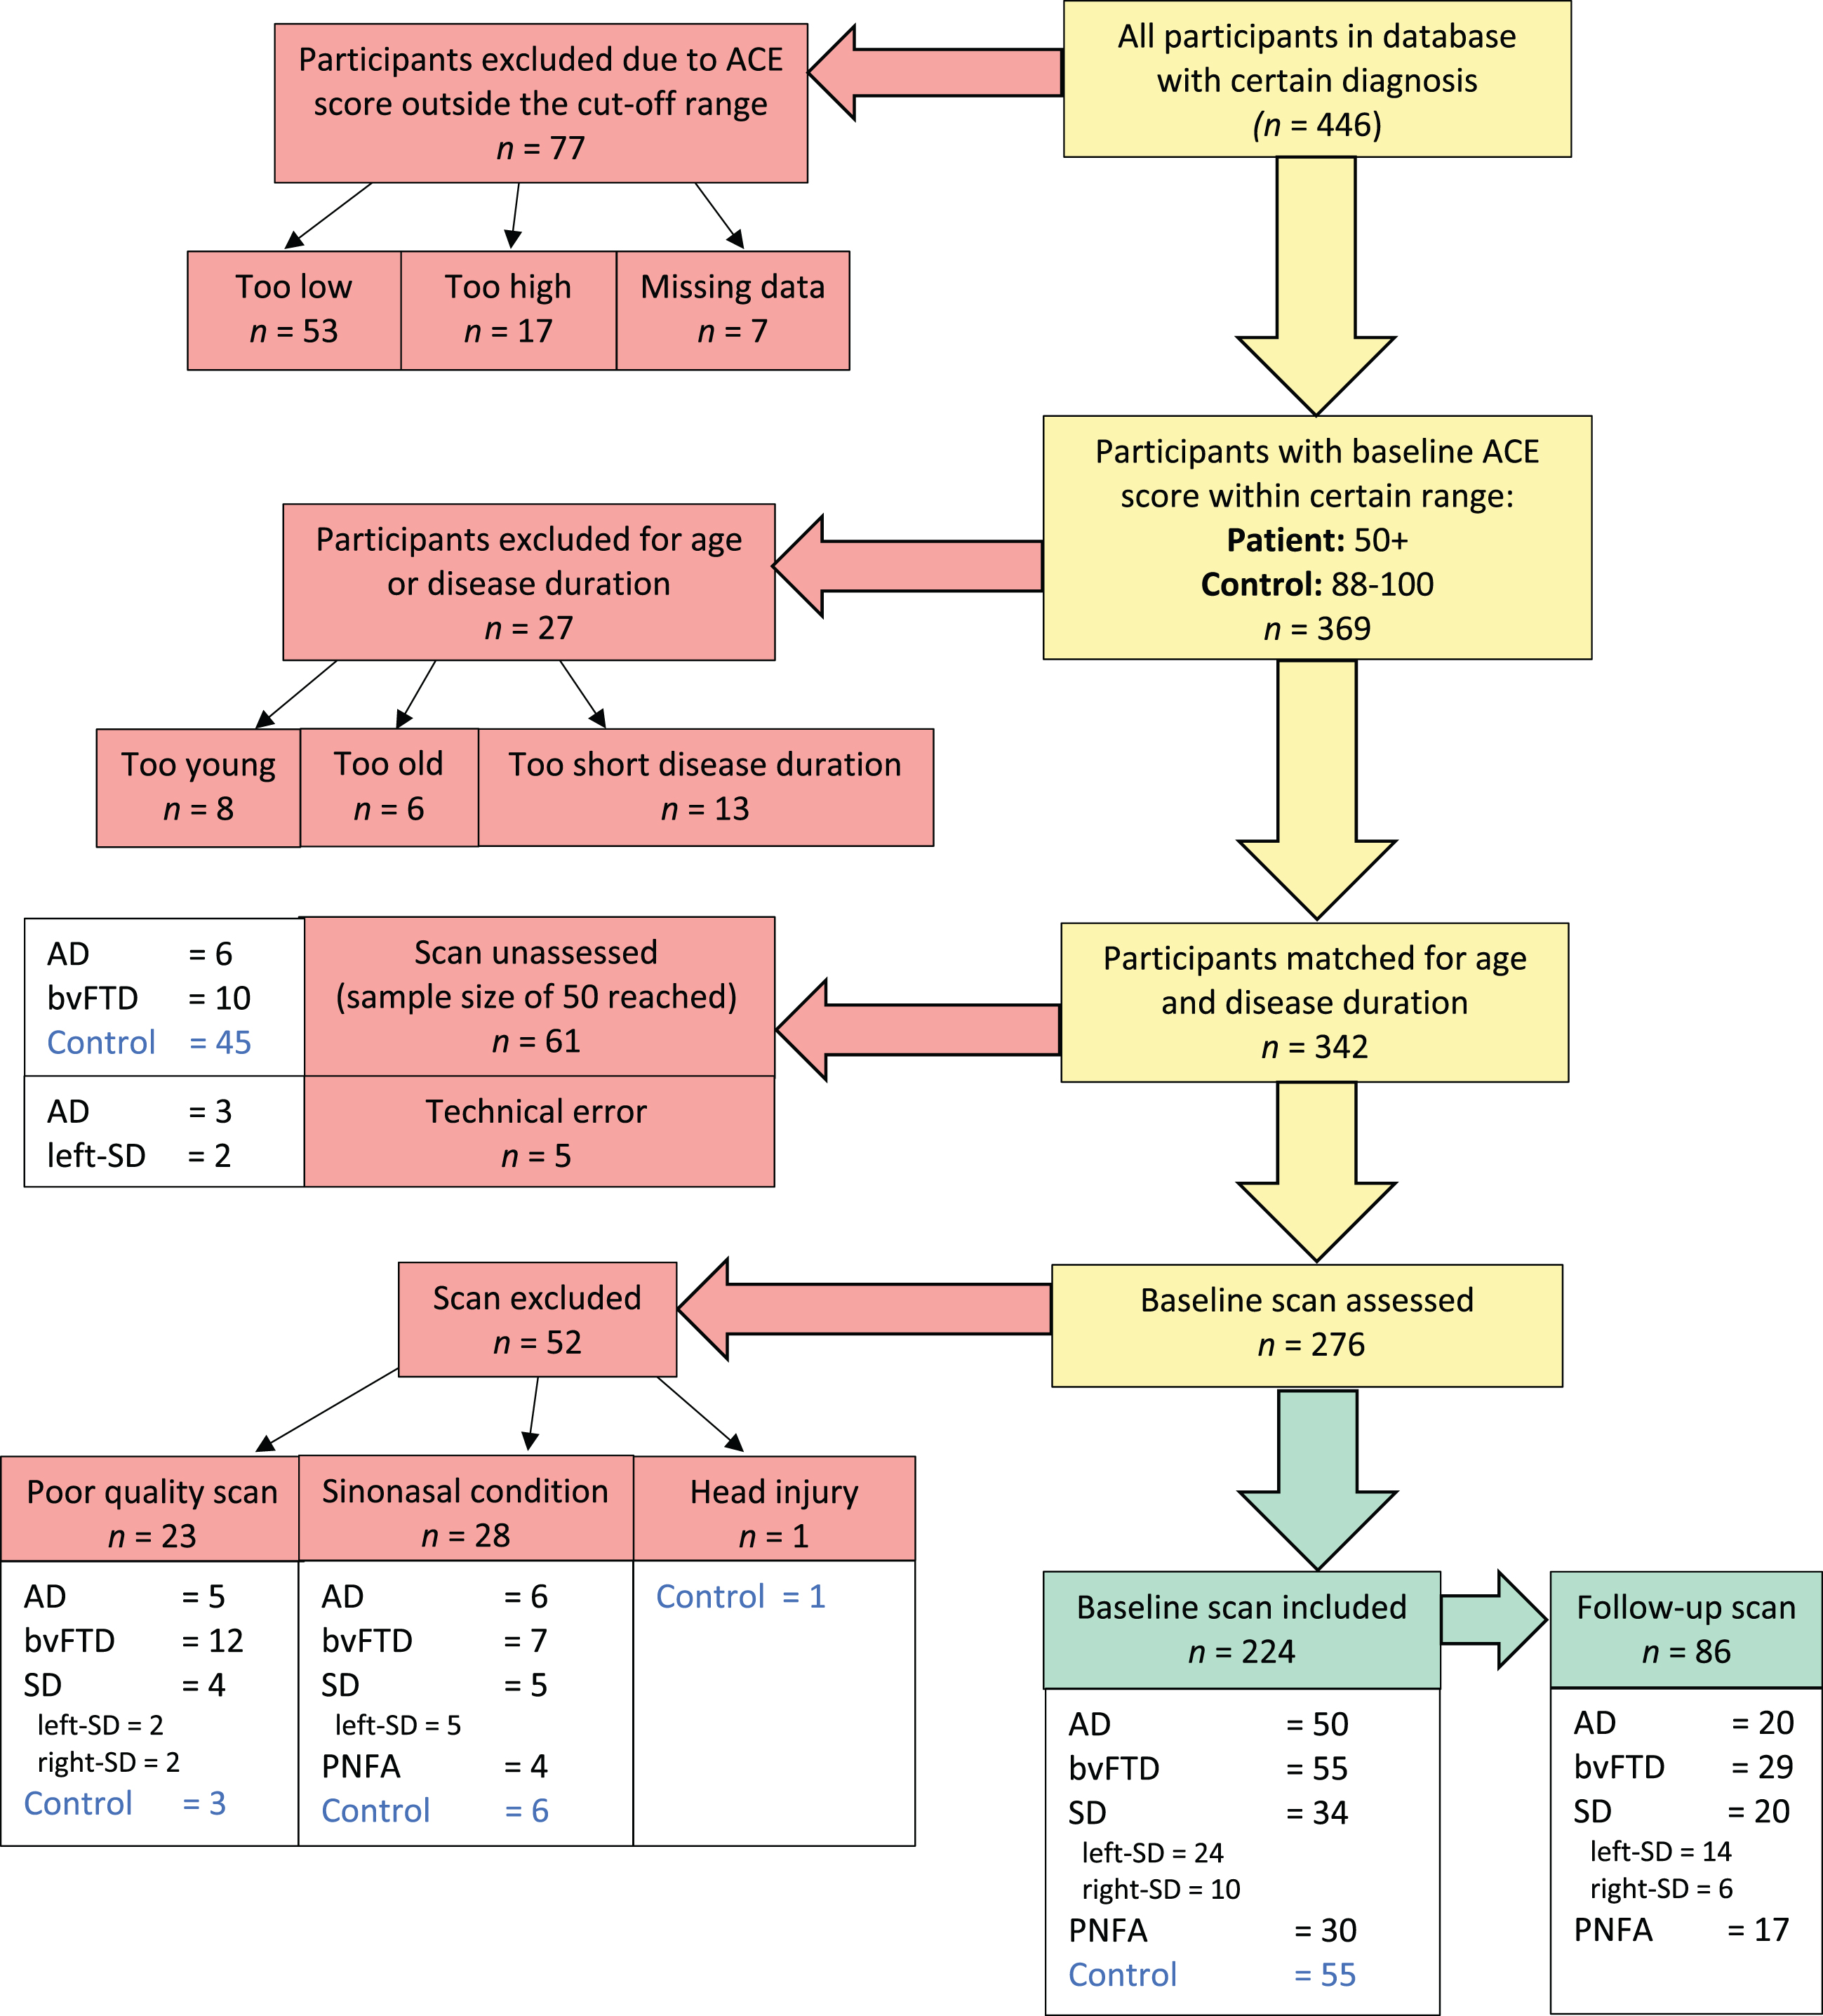
Flow chart of participant inclusion. Cognitive function was measured by the Addenbrooke’s Cognitive Examination (ACE). Participants were excluded if ACE scores fell below 50 for dementia patients (44 for semantic dementia) or below 88 for controls. Groups were matched on age and disease duration by removing outliers one-by-one until group differences were non-significant according to ANOVA. ‘Too young’ bvFTD patients were aged 34–51 years; ‘too old’ controls were aged 78–81 years. Excluded disease durations ranged between 12–18 months.
Ethics statement
Ethics approval for this study was provided by the Human Research Ethics Committee of South Eastern Sydney Local District and the University of New South Wales. All participants or their Person Responsible provided written informed consent in accordance with the Declaration of Helsinki. Written informed consent was obtained for the purposes of research participation as well as for the publication of this study.
Disease severity
Global cognitive function was measured with either the revised or third (newer) version (ACE-III) of the ACE [59, 60]. ACE-revised total scores were converted into ACE-III scores as described in previous literature [58]. Clinical disease stage/functional ability was measured with the Frontotemporal Dementia Rating Scale (FRS) [61]. Raw FRS scores were converted into a Rasch score [62] where a lower score denotes greater impairment in functional ability.
Smell loss symptoms
Direct measurement of smell function was not available due to the retrospective nature of this study. Instead, the extent of olfactory impairments in the dementia groups was estimated using an indirect measure of smell function based on available clinical data, i.e., questionnaires. Symptoms of smell loss were established from items from the Cambridge Behavioural Inventory Revised (CBI-R) [63] and the Appetite and Eating Habits Questionnaire (APEHQ) [64]. These questionnaires were completed by an informant for patients, whereas a self-report version was completed by controls. The relevant items assessed the functional manifestations of smell loss: reduced appetite and altered food preferences (Supplementary Table 1). Scoring is detailed in the Supplementary Material. Briefly, the scores of two relevant items from the CBI-R were combined and the percentage score was calculated from the maximum total score. The same process was applied to six items from the APEHQ. The CBI-R percent scores were significantly correlated with the APEHQ percent scores (r = 0.518 p < 0.001); thus, for participants who had both data points available, the two scores were averaged into a ‘smell loss symptoms’ score. For participants who only had data available for one test, the score of the single completed questionnaire was used as the smell symptoms score.
Demographic and clinical characteristics of study participants
Values are mean (standard deviation). Significant p values are shown in bold. #Pearson Chi-squared statistic. aMissing data for: 3 bvFTD and 1 SD. bMissing data for: 5 AD, 3 bvFTD, 4 SD, and 4 PNFA. cMissing data for: 7 AD, 6 bvFTD, 1 SD, 6 PNFA, 2 Controls. ACE-III, Addenbrooke’s Cognitive Examination, third edition; AD, Alzheimer’s disease, bvFTD, behavioral variant frontotemporal dementia; DASS-21, Depression, Anxiety, and Stress Score, 21-item version; FRS, frontotemporal dementia rating scale; PNFA, progressive non-fluent aphasia; SD, semantic dementia.
Depression
Depression score was calculated from the 21-item Depression, Anxiety and Stress Scale, DASS-21 [65, 66] which is a self-rated questionnaire that assesses recent symptoms of depression, anxiety, and stress. The depression subscale comprises seven items, each scored between 0 and 3 (Supplementary Table 2). It should be mentioned here again that all participants were free of significant and longstanding history of psychiatric disorders, including major depression.
Baseline volumes of individual olfactory network regions –post-hoc results comparing each patient group to controls
Volumes were obtained via surface-based morphometry and corrected for whole brain volume. ‘ns’, non-significant, p > 0.05; *p < 0.05; **p < 0.005; ***p < 0.0001. AD, Alzheimer’s disease; bvFTD, behavioral variant frontotemporal dementia; PNFA, progressive non-fluent aphasia, left-SD, semantic dementia with left-predominant atrophy; right-SD, semantic dementia with right-predominant atrophy.
MRI acquisition
Brain MRI scans were obtained using a 3-Tesla scanner with a standard 8-channel head coil. T1-weighted sequences (voxel size 1 mm×1 mm×1 mm) were acquired with the following parameters: coronal orientation, matrix 256×256, 200 slices, 1 mm2 in-plane resolution, slice thickness 1 mm, echo time/repetition time 2.6/5.8 ms, flip angle α= 8°. All scans were reviewed by an experienced neuroradiologist to exclude the presence of co-existing pathologies (stroke, tumor, significant white matter abnormalities).
MRI analysis
Four-hundred-and-thirteen scans were visually inspected by SEC for image quality (e.g., movement artefacts) and for sinonasal conditions (e.g., inflammation) that may impact OB volume measurements. Of these, 33 scans were excluded for poor image quality, 45 with evidence of a paranasal condition and one with evidence of head injury. The most common paranasal condition was the presence of mucus and inflammation in the ethmoid sinuses which obstructed view of the OBs. The poor image quality exclusion rate (8%) was comparable to that of a previous study in multiple sclerosis (12.5%) [67]. Quality control assessment resulted in the inclusion of 310 high-quality scans, comprising 224 baseline scans (Alzheimer’s disease = 50, bvFTD = 55, semantic dementia = 34, PNFA = 30, Control = 55) and 86 follow-up scans (Alzheimer’s disease = 20, bvFTD = 29, semantic dementia = 20, PNFA = 17). A flow chart of participant and MRI scan inclusion is presented in Fig. 1.
Olfactory bulb volumetry
Manual identification of OBs was conducted using the imaging software MRIcron (https://www.mricro.com, 64-bit OSX Cocoa v1.0.20190902) using established methods [68], for the purpose of orienting the rater (SEC) to the location of the OBs within the MRI space. The voxel intensity range of each MRI image was first normalized for consistency using FSLmaths (FMRIB Software Library, FMRIB Centre, Oxford, UK; the Linux command is available in Supplementary Table 3). The rater was blind to participant diagnosis. OB volumetry was conducted using the semi-automatic segmentation functionality of FSLeyes software (version 0.25.0). This function automatically highlights a region of interest in 2D space, based on a manually selected ‘seed’ voxel and manually selected threshold parameters (see the Supplementary Materials for detailed methods). Figure 5c shows the result of the OB volumetry process for one coronal MRI slice. OB volumes were corrected for whole brain volume (obtained via surface-based morphometry) by dividing each by the participant’s whole brain volume, and then multiplying by the mean whole brain volume for the whole cohort to bring the measurements back to the original scale (mm3). This was to investigate the specific change in OB integrity due to the dementia above and beyond the overall disease effect on brain integrity.
Two linear models of predictors of smell loss symptoms
B, unstandardized coefficient; SE, standard error; β, standardized coefficient. Significant predictor variables (p < 0.05) are coded in bold.
Intra-rater reliability of olfactory bulb volumetry
Ten MRI scans of excluded participants (two outliers of age or disease duration from each group of Alzheimer’s disease, bvFTD, semantic dementia, PNFA, and controls) were randomly selected for reliability testing of volumetric measurements. Five copies of each scan were mixed in random order to create a 50-image set. Tracing was performed by SEC using the semi-automatic segmentation protocol described above. Intraclass correlation analysis obtained via SPSS revealed excellent intra-rater reliability (intraclass correlation coefficient = 0.966, p < 0.001).
Olfactory network
Apart from the olfactory bulb, other regions of interest for volumetric investigation were brain regions known to be involved in olfaction, including the entorhinal cortex, amygdala, hippocampus, parahippocampal cortex, insular cortex, medial orbitofrontal cortex, and rostral anterior cingulate cortex (Fig. 2). The volumes of these subcortical and cortical regions were obtained using surface-based morphometry (described in next section). The piriform cortex and the mediodorsal nucleus of the thalamus were unable to be investigated due to the size of these regions and the limits of the volumetric methods. It is important to note here the complexity of the olfactory system, and that only a small subregion within each of the ‘olfactory’ regions of interest may contribute to olfactory functions: it is a rather unique aspect of the olfactory system that many of the regions contributing to olfactory ability are not specific to olfaction but rather govern many aspects of emotion, memory, and behavior. For example, the insula governs functions of memory, motivation, emotion, smell, and taste, as well as autonomic functions [69]. The limitations of the methodology dictate the inclusion of each of these ‘olfactory’ regions in their entirety, and as such, caution is required in interpretation of results relating to the relationships of these regions to olfactory function.

Regions of the olfactory network. The olfactory bulbs (OB) house the first relay of smell information between the nose and the brain. Beyond the OBs, smell is further processed in multiple regions of the ventral frontal and medial temporal lobes, including the primary olfactory cortex (piriform cortex, entorhinal cortex, parahippocampal cortex and amygdala), as well as the orbitofrontal cortex, the rostral anterior cingulate cortex, the insula, and the mediodorsal nucleus of the thalamus. Figure created with BioRender.com.
Surface-based morphometry
Surface-based morphometry was conducted using FreeSurfer software (https://surfer.nmr.mgh.harvard.edu) to obtain volumetric measurements of other regions of the olfactory network: i.e., the amygdala, hippocampus, entorhinal cortex, medial orbitofrontal cortex, parahippocampal gyrus, rostral anterior cingulate cortex, and insular cortex. The piriform cortex and mediodorsal nucleus of the thalamus were unable to be investigated due to limitations of the FreeSurfer pre-processing protocol. The post-central gyrus was included as a control region as it has no known role in olfaction [70]. Surface-based morphometry involves automatic and individualized segmentation of subcortical structures and parcellation of cortical ribbons from MRI images. It produces volume measurements for subcortical regions, surface area and thickness measurements for cortical regions, and a measurement of whole brain volume. The default Desikan/Killiany atlas was used for segmentation and parcellation. The standard FreeSurfer pipeline protocol (auto-recon-all) was used for pre-processing (https://surfer.nmr.mgh.harvard.edu/fswiki/recon-all). Volumes of cortical regions were manually calculated by multiplying surface area by thickness. All volumes were subsequently corrected for whole brain volume by dividing each by the participant’s whole brain volume, and then multiplying by the mean whole brain volume for the whole cohort to bring the measurements back to the original scale (mm3). Three participants (two Alzheimer’s disease and one left-semantic dementia) were excluded from subsequent analyses due to technical errors.
Predicting smell loss symptoms
Multiple linear regression analysis was conducted to identify variables contributing to the smell loss symptoms in the whole cohort, with potential candidate predictors being depression scores (taken from the DASS-21), OB volume, and volumes of the subcortical and cortical olfactory regions (the amygdala, hippocampus, entorhinal cortex, medial orbitofrontal cortex, parahippocampal gyrus, rostral anterior cingulate cortex, and insular cortex) both individually and combined as ‘olfactory network volume’. Depression was selected as a potential predictor of smell loss symptoms as it has been associated with olfactory dysfunction and reduced volume of the OB [46, 47].
Statistical analysis
All statistical analyses were conducted using IBM SPSS Statistics (Version 25.0.0.2). ANOVA was used to compare groups on demographic and clinical variables at baseline. Sex distribution and handedness were compared using Pearson’s Chi-squared test. Factorial mixed ANOVA was used to investigate the effect of diagnosis and hemisphere (i.e., left versus right) on the baseline OB volume and the baseline ‘olfactory network’ volume. For follow-up data, time was included as an additional within-subjects variable (i.e., baseline versus follow-up). To examine potential effects of lateralization, left and right hemisphere volumes of the OB and olfactory network regions were analyzed separately. For all analyses, significance level was set at p-value <0.05 with Sidak correction for multiple comparisons where relevant.
RESULTS
Demographic characteristics
Demographic characteristics of the study participants are shown in Table 1. Groups did not differ significantly with respect to age, sex distribution, disease duration, education level, or handedness (p > 0.05) (Table 1).
Disease severity
Global cognitive function, as measured by the ACE-III, differed significantly between groups (F(4,219) = 74.553, p < 0.0001) (Table 1). All patient groups scored significantly lower than the control group (all p values < 0.0001). Among the patient groups, semantic dementia scored significantly lower than all other groups (all p values ≤0.001) and Alzheimer’s disease scored significantly lower than bvFTD (p = 0.016). No other pairwise comparisons were significant (all p values > 0.05). FRS Rasch scores (and thus, functional ability) also differed significantly between patient groups (F(3,149) = 26.286, p < 0.0001) (Table 1). Functional ability was lower for bvFTD than all other patient groups, while for PNFA it was higher than all other patient groups (all p values < 0.0001). No other pairwise comparisons were significant (p > 0.05).
Smell loss symptoms
A significant group difference was found for smell loss symptoms (F(5,205) = 17.222, p < 0.0001) (Fig. 3). The bvFTD, right-semantic dementia and left-semantic dementia groups had greater smell loss symptoms than the control group (bvFTD versus controls: p < 0.0001; right-semantic dementia versus controls: p = 0.003; left-semantic dementia versus controls: p = 0.026). Additionally, the bvFTD group had greater smell loss symptoms than most of the other patient groups (bvFTD versus Alzheimer’s disease: p < 0.0001; bvFTD versus left-semantic dementia: p = 0.036; bvFTD versus PNFA: p < 0.0001) and the right-semantic dementia group had more smell loss symptoms than the PNFA group (p = 0.014). In contrast, the Alzheimer’s disease and PNFA groups did not differ significantly from the control group (Alzheimer’s disease versus controls: p = 0.657; PNFA versus controls: p = 1.000) and this finding was somewhat unexpected for the Alzheimer’s disease group.
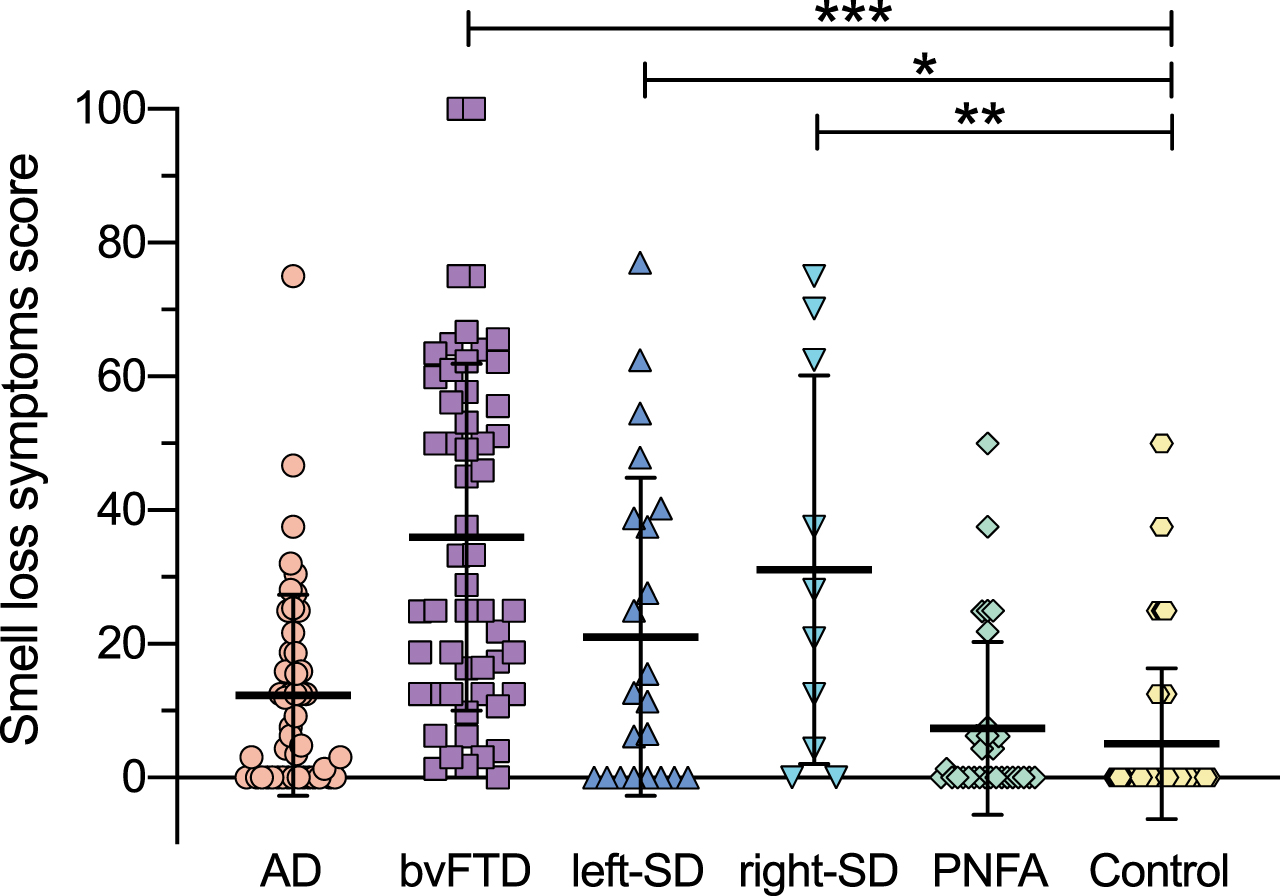
Smell loss symptom scores at baseline across participant groups. Scores indicate percent of maximum frequency and severity of smell loss symptoms. Thick horizontal lines represent the mean; error bars indicate one standard deviation above and below the mean. *p<0.05; **p<0.005; ***p<0.0001.
Depression scores
Depression scores were taken from the DASS-21 for use in regression analysis of smell loss symptoms. Depression scores for each diagnostic group are shown in Fig. 4. Significant group differences were found with respect to depression symptoms at baseline (F(4,192) = 10.398, p < 0.001). The dementia patients (except the PNFA group) had significantly higher depression scores compared to healthy controls, including the Alzheimer’s disease (p = 0.006), bvFTD (p < 0.0001) and semantic dementia (p = 0.0001) groups. No other pairwise comparisons were significant (all p values > 0.05).

Depression scores at baseline. Depression scores were taken from the Depression, Anxiety and Stress Scale (DASS-21) for use in regression analysis of smell loss symptoms. Thick horizontal lines represent the mean; error bars indicate one standard deviation above and below the mean. p > 0.05; *p<0.05; ***p<0.0001 according to ANOVA with Sidak correction for multiple comparisons.
Olfactory bulb volume
Baseline OB volumes
At baseline, total OB volumes were similar between groups at baseline after correction for whole brain volume (F(5,215) = 0.432, p = 0.826) (Fig. 5). The main effect of hemisphere (p = 0.442) and the interaction effect between group and hemisphere (p = 0.231) were not significant. Baseline OB volumes are presented in Supplementary Table 4.
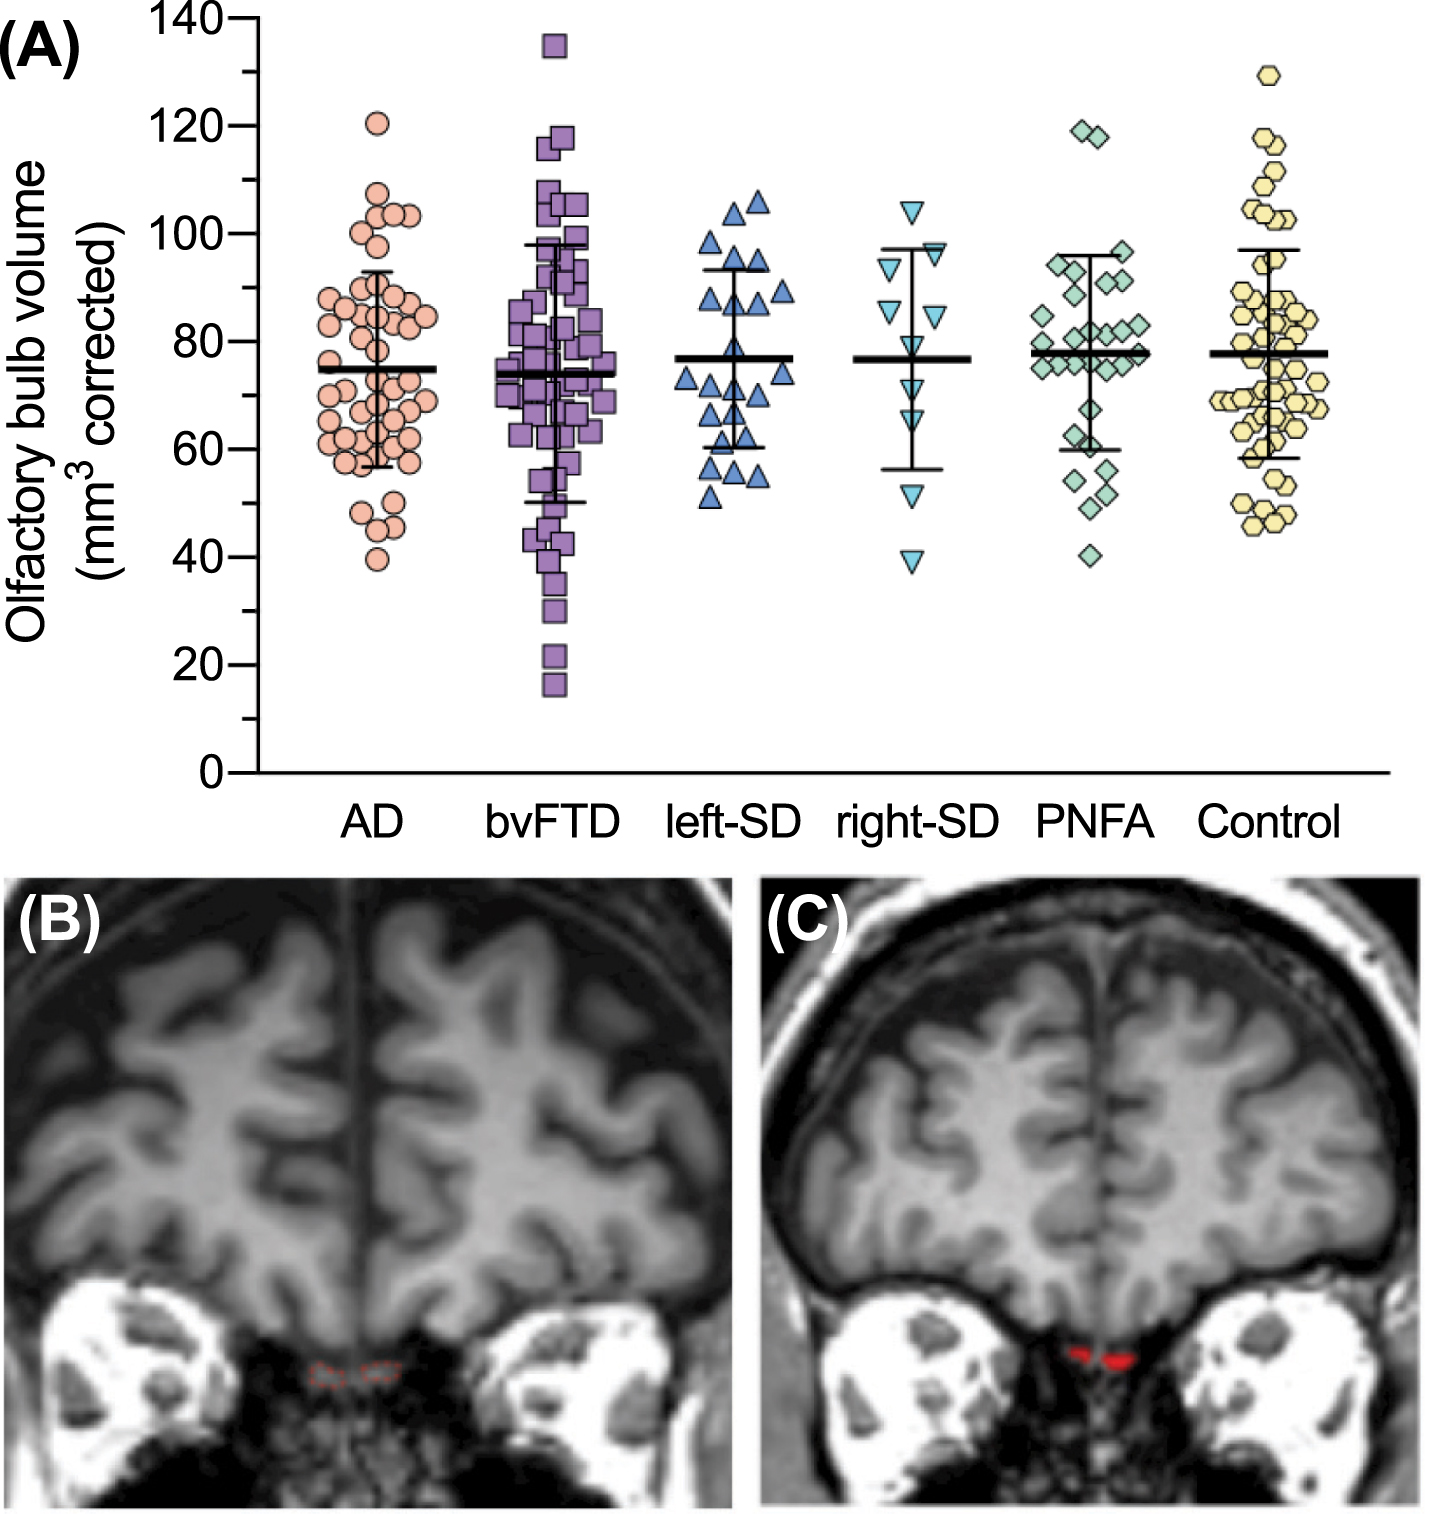
Olfactory bulbs at baseline. A) Total olfactory bulb volumes at baseline. Thick horizontal lines represent the mean; error bars indicate one standard deviation above and below the mean. B) Visualization of olfactory bulbs (outlined in red) on coronal MRI. C) An example of a result of olfactory bulb volumetry for one coronal MRI slice.
Longitudinal changes in OB volumes in patient groups
When analyzing longitudinal changes in OB volumes in patient groups, a significant main effect of time was present (F(1,79) = 51.577, p < 0.0001) indicating that OBs were significantly smaller at follow-up than baseline in the dementia patient groups (Fig. 6). The main effect of time remained when looking at the patient groups separately, i.e., each group had a significant reduction in OB volume between baseline and follow-up (Alzheimer’s disease: F(1,18) = 15.285, p = 0.001; bvFTD: F(1,28) = 28.493, p < 0.0001; left-semantic dementia: F(1,12) = 8.723, p = 0.012; right-semantic dementia (F(1,5) = 73989, p = 0.037; PNFA: F(1,16) = 10.301, p = 0.005). A significant interaction between time and hemisphere was also observed (F(1,79) = 7.184, p = 0.009), with right OBs tending to lose more volume than left OBs between baseline and follow-up (Supplementary Figure 1). The significant interaction between time and hemisphere was found to be driven by the right-semantic dementia group only, who showed significantly greater OB atrophy on the right (38% volume loss) compared to the left (11% volume loss) hemisphere (F(1,5) = 7.166, p = 0.044). The main effects of hemisphere (p = 0.192) and group (p = 0.686) were not significant. OB volumes at baseline and follow-up are presented in Supplementary Table 5.

Olfactory bulb volumes at baseline and follow-up. Thick horizontal lines represent the mean; error bars indicate one standard deviation above and below the mean. *p<0.05; **p<0.005; ***p<0.0001.
Olfactory network volume
Baseline olfactory network volumes
Examination of the integrity of the ‘olfactory network’ revealed a significant main effect of group (F(5,215) = 22.699, p < 0.0001) (Fig. 7). The interaction between hemisphere and group was also significant (F(5,215) = 32.106, p < 0.0001). Follow up post-hoc tests showed that compared to controls, the total olfactory network volume was significantly reduced in the bvFTD group and both semantic dementia groups (all p values < 0.0001) but not in Alzheimer’s disease (p = 0.195) or PNFA (p = 1.000). The Alzheimer’s disease group had significantly reduced olfactory network volume in the left hemisphere relative to controls (p = 0.040) whereas olfactory network volume in the right hemisphere was similar to controls (p = 0.853). The PNFA olfactory network volumes were similar to controls in both hemispheres (both p values > 0.608). The other patient groups had significantly reduced olfactory network volumes in both hemispheres relative to controls (all p values < 0.05). Additionally, both semantic dementia groups had significantly reduced olfactory network volume compared to the Alzheimer’s disease, bvFTD, and PNFA groups (left-semantic dementia versus Alzheimer’s disease: p < 0.0001; left-semantic dementia versus bvFTD: p = 0.007; left-semantic dementia versus PNFA: p < 0.0001; right-semantic dementia versus Alzheimer’s disease: p < 0.0001; right-semantic dementia versus bvFTD: p = 0.002; right-semantic dementia versus PNFA: p < 0.0001), and the bvFTD group had significantly reduced olfactory network volume compared to the PNFA group (p < 0.0001). The contributions of individual brain regions to the olfactory network atrophy in each group are presented in Table 2.
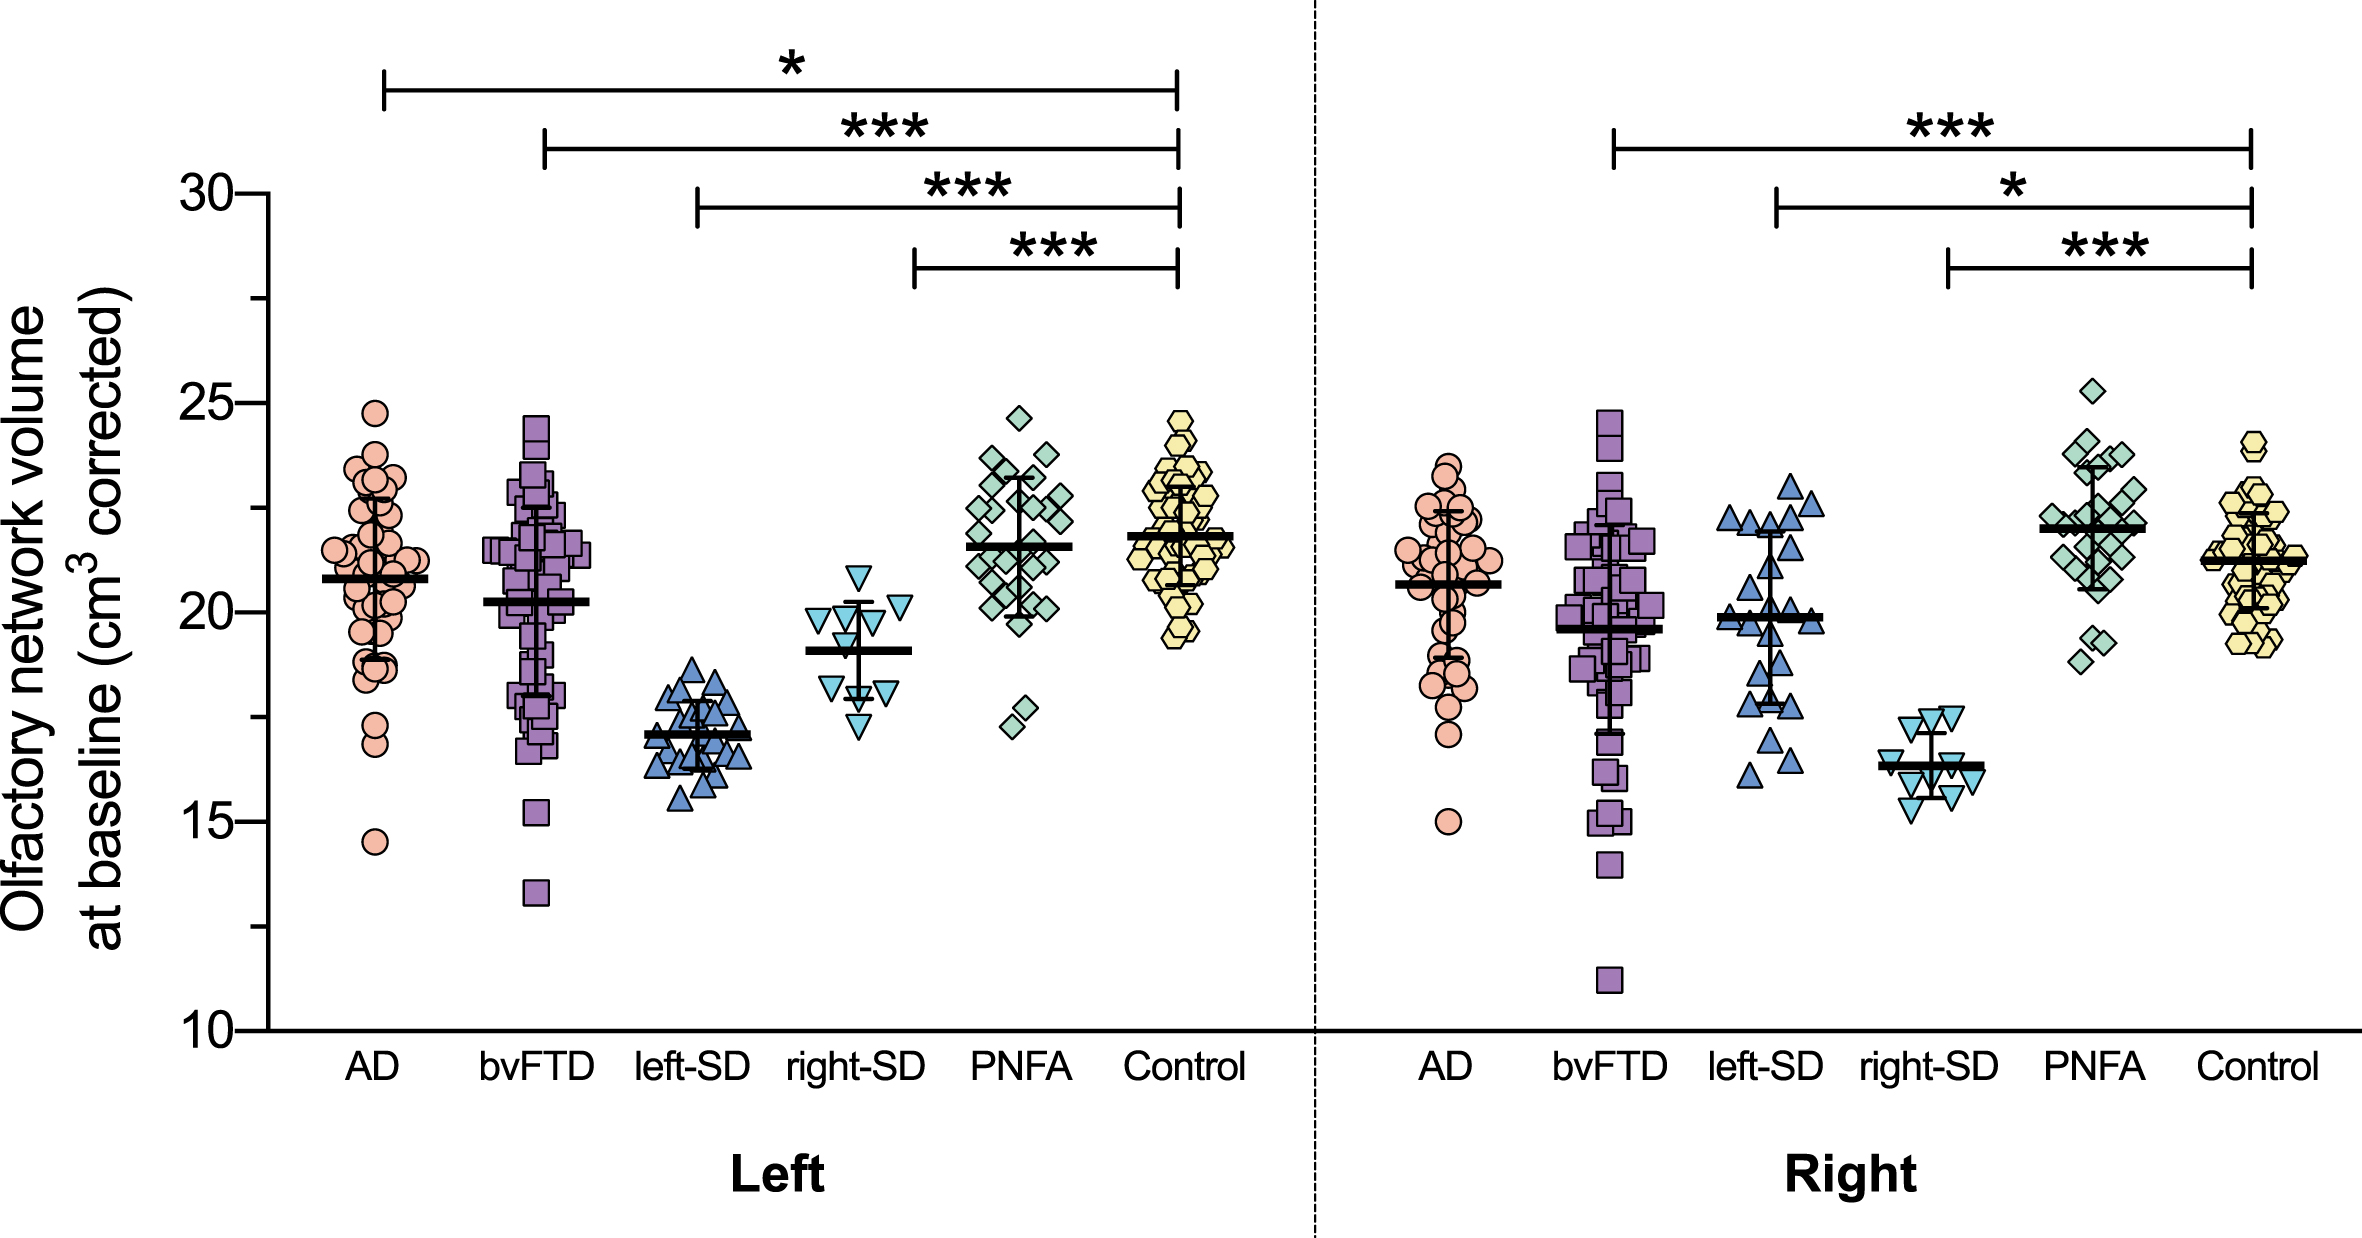
Left and right olfactory network volumes at baseline. Olfactory network volume = combined volume of amygdala, hippocampus, entorhinal cortex, medial orbitofrontal cortex, parahippocampal cortex, rostral anterior cingulate cortex, and insular cortex, corrected for whole brain volume. Thick horizontal lines represent the mean; error bars indicate one standard deviation above and below the mean. *p<0.05; ***p<0.0001.
Longitudinal changes in olfactory network volumes in patient groups
Longitudinal assessment of olfactory network volumes in the patient groups revealed a significant main effect of time (F(1,79) = 98.546, p < 0.0001) indicating a significant reduction in olfactory network volume between baseline and follow-up in the dementia patients (Fig. 8), an effect which remained significant in each patient group separately (Alzheimer’s disease: F(1,18) = 50.619, p < 0.0001, bvFTD: F(1,28) = 27.462, p < 0.0001; left-semantic dementia: F(1,12) = 73.327, p < 0.0001; right-semantic dementia: F(1,5) = 21.037, p = 0.006; PNFA: F(1,16) = 18.443, p < 0.0001). A significant main effect of group was also present (F(4,79) = 13.898, p < 0.0001) with post-hoc tests revealing that left- and right-semantic dementia had a larger reduction in olfactory network volumes than Alzheimer’s disease and PNFA (all p values < 0.0001) and bvFTD (both p values < 0.05). Also, bvFTD had more reduced olfactory network volumes than PNFA (p = 0.017) between baseline and follow-up. Similar to our baseline results, a significant interaction between hemisphere and group was observed (F(4,79) = 14.014, p < 0.0001) driven by an opposite effect of hemisphere for semantic dementia, i.e., the left-semantic dementia group had smaller olfactory network volumes on the left than right (F(1,12) = 25.089, p < 0.0001) while the right-semantic dementia group had smaller olfactory network volumes on the right than left (F(1,5) = 31.013, p = 0.003). The main effect of hemisphere (p = 0.911) and the interaction effects of time versus hemisphere (p = 0.477) and time versus hemisphere versus diagnosis (p = 0.707) were not significant.
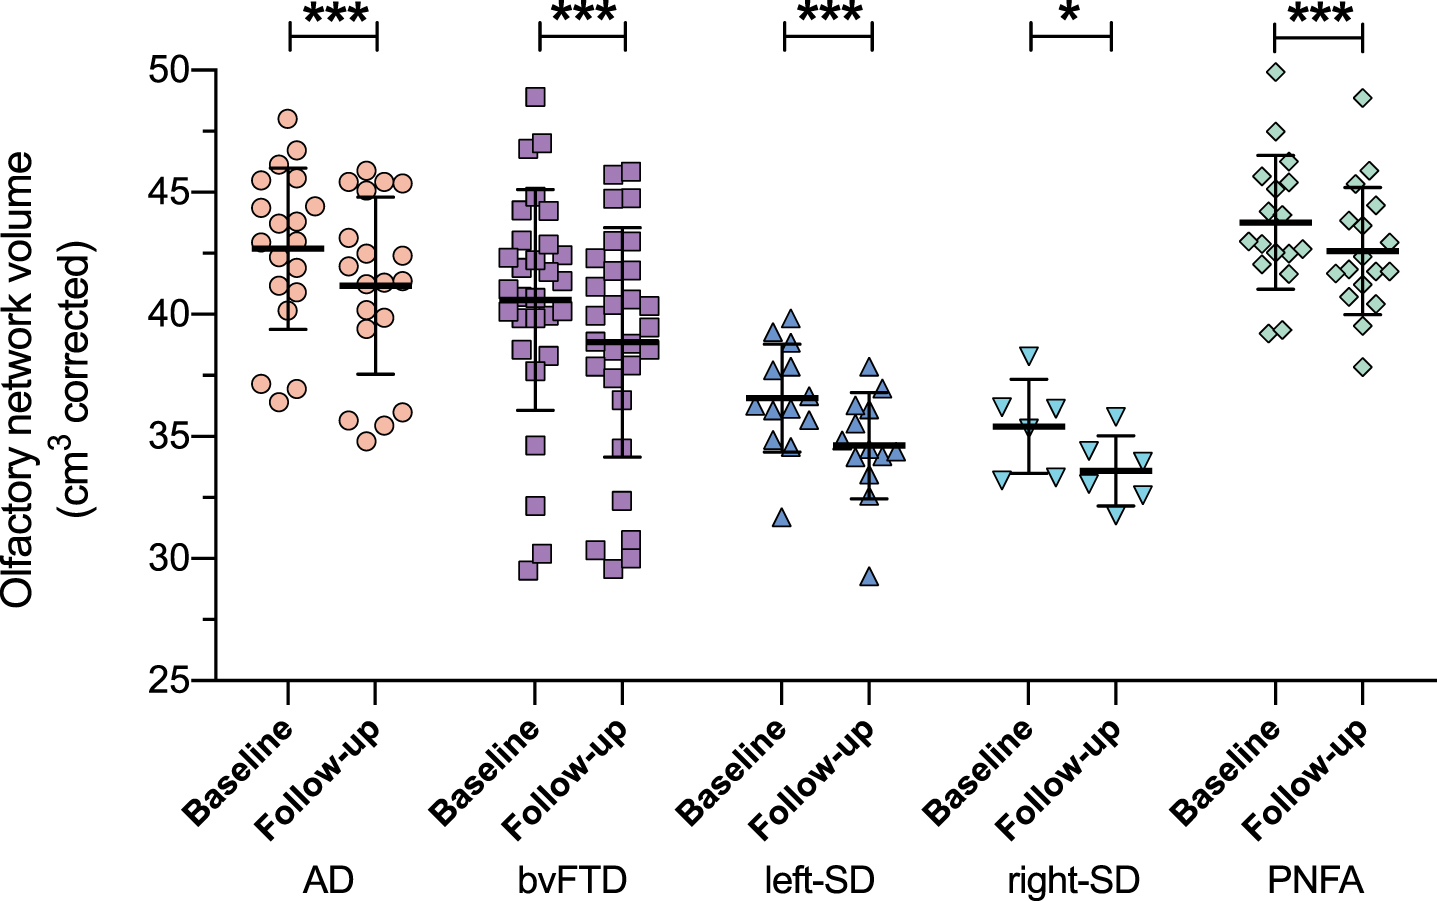
Olfactory network volumes at baseline and follow-up. Olfactory network volume = combined volume of amygdala, hippocampus, entorhinal cortex, medial orbitofrontal cortex, parahippocampal cortex, rostral anterior cingulate cortex, and insular cortex, corrected for whole brain volume. Thick horizontal lines represent the mean; error bars indicate one standard deviation above and below the mean. *p<0.05; ***p<0.0001.
Predictors of smell and taste symptoms
Multiple linear regression analysis was conducted to identify the relevant predictor(s) of smell loss symptoms. The predictor variables considered included the DASS-21 depression score and the volumes of the OB, hippocampus, amygdala, entorhinal cortex, medial orbitofrontal cortex, parahippocampal cortex, rostral anterior cingulate cortex, and insular cortex. A significant regression model emerged (F(9,174) = 3.717, p < 0.0001, R2 = 0.161, adjusted R2 = 0.118) which accounted for 16% of the variance in smell loss symptom scores. Depression score was the only significant predictor in the model (Table 3, Model 1). Collinearity statistics indicated no significant multicollinearity between predictors (tolerance range = 0.331–0.988). The relationship between depression and smell loss symptom scores is illustrated in Fig. 9.

Relationship between smell loss symptoms and depression at baseline. Smell loss symptom scores indicate percent of maximum frequency and severity of these symptoms. Depression scores were taken from the Depression, Anxiety and Stress Scale (DASS-21) (maximum score = 21). Data is for all subjects who had both DASS-21 and smell loss symptom data available at baseline (n = 197).
The multiple linear regression analysis was repeated with the volumes of olfactory regions combined into a global olfactory network volume, keeping depression and OB volume as the other predictors. Both depression and global olfactory network volume were significant predictors of smell loss symptom scores in this model (both p values ≤0.022). The model accounted for 15% of the variance in smell loss symptom scores (F(3,180) = 10.357, p < 0.0001, R2 = 0.147, adjusted R2 = 0.133) (Table 3, Model 2). Collinearity statistics indicated no significant multicollinearity between predictors (tolerance range = 0.969–0.992).
DISCUSSION
This study demonstrated that, at their first visit to the clinic, both FTD and Alzheimer’s disease patients showed volume reduction of the olfactory network compared to controls. In contrast, the OBs, which are crucial for odor detection and identification, were not impacted. These changes were in the context of significant levels of subjective smell loss symptoms in two subtypes of FTD (semantic dementia and bvFTD). In addition, in these groups, smell loss symptoms were related to greater depression symptoms (note that none of the patients had clinically diagnosed depression) and more reduced olfactory network volumes compared to the Alzheimer’s disease, PNFA, and control groups. Importantly, with disease progression, i.e., one year later, a significant reduction in OB volume (10–25% volume loss) was observed in all subtypes of FTD and Alzheimer’s disease. While this amount of volume reduction may seem large compared to what would normally be seen in healthy aging populations, it is less surprising when considering the very focal brain atrophy in our sample especially for individuals with semantic dementia.
This is the first MRI study to investigate OB integrity in FTD and the first study to investigate OB volume at presentation and over time in Alzheimer’s disease. Our results extend the work by Thomann et al. [53, 54] by demonstrating that, while the combined OB and tract may be undergoing early pathological changes in Alzheimer’s disease, even in the mild cognitive impairment phase, the OB itself appears spared early on, with its involvement becoming noticeable with disease progression. The spread of tau pathology throughout the brain in Alzheimer’s disease, in an outwards direction from more medial structures [71–73] resulting in more severe neuronal loss in the olfactory tract compared to the OB, supports this view [74]. As the volume of the olfactory tract was not measured in the present study, this interpretation, however, remains open. Our results also support the findings of Witoonpanich et al. [75] by confirming that odor identification impairments in early Alzheimer’s disease likely arise from disruption to subcortical olfactory brain regions (i.e., regions of our ‘olfactory network’) rather than damage to the OB itself (at least, damage which is sufficient to be detected on MRI). We extend on this research by demonstrating that the structural integrity of the OB that is crucial for odor detection and identification becomes detectably and significantly impacted with disease progression, providing a possible biological basis to the worsening and broadening of olfactory dysfunction over time in Alzheimer’s disease. With respect to FTD, our findings provide the first evidence that the OB is intact in the early disease stages and suggests that any olfactory impairments at baseline are more likely due to pathological changes beyond the OB. Supporting this idea, we found that at least 7 out of the 14 individual lateralized olfactory network regions were atrophied at baseline in the bvFTD and semantic dementia groups relative to healthy controls. These brain regions are relevant for many aspects of olfaction including the processing of odor semantics, memory, and affect. In contrast, only three of the 14 olfactory regions were atrophied in the Alzheimer’s disease group and none in the PNFA group, and both of these groups showed no significant smell loss symptoms.
The apparent absence of smell loss symptoms in the Alzheimer’s disease group may seem surprising given the well-established olfactory dysfunction in this disease. We suggest that this olfactory dysfunction in Alzheimer’s disease does not manifest as reduced appetite or altered food preferences (the symptoms comprising our “smell loss symptoms” scores), but rather the olfactory dysfunction reflects disruption to the higher-order appraisal of olfactory information, most likely odor memory. Supporting this, odor identification impairments in Alzheimer’s disease have been previously associated with atrophy to the right parahippocampal and entorhinal cortices [75]. In the present study, smell loss symptom scores were not predicted by the volume of either of these regions but rather by depression symptoms. Also, the smell loss symptoms we measured, such as reduced appetite, have low specificity to olfactory dysfunction; for example, depression, anxiety and stress can be associated with reduction in appetite [65]. Therefore, both olfactory dysfunction and mood disturbance can contribute to smell loss symptoms; a link which has been well established [46, 76]. In light of this, our measure of smell loss might be more sensitive in detecting smell deficits as they manifest in syndromes that have relatively greater mood changes, as in bvFTD and semantic dementia, but less sensitive in detecting smell deficits when mood is relatively preserved, as in Alzheimer’s disease and PNFA. In other words, perhaps our measure of smell loss was not powerful enough to detect significant smell loss in the groups without depression. Further supportive of this idea is that our patient groups with mean depression scores within the normal range (PNFA, Alzheimer’s disease) did not have significant smell loss symptoms (compared to controls), while the patient groups with mean depression scores in the mild range (bvFTD, semantic dementia) did have significant smell loss symptoms.
Of clinical importance, our findings of reduced OB volume in FTD and Alzheimer’s disease with disease progression, in conjunction with the extreme plasticity of the olfactory system, offers potential for the OB to be targeted in interventions to mitigate the decline of smell function. For example, olfactory training that increases OB volume has shown to be effective in Parkinson’s disease [77, 78]. Smell loss treatments that precisely and effectively target deficits will undoubtedly enhance the quality of life for many individuals as well as improve safety around the home by reducing the risk of gas leaks and consuming spoilt food. Increasing OB volume may also improve attention and mood [47, 79].
The present study was limited by the lack of an objective measure of smell, given its retrospective nature. We used questionnaire data about smell loss symptoms to (indirectly) infer smell loss in our participants. Thus, we cannot confirm olfactory dysfunction in our patients, and we cannot confirm the implications of the OB and olfactory network atrophy to olfaction in these syndromes. Further studies will need to directly test smell function using psychophysical tests to confirm the findings and clinical implications of this study. Our smell loss symptom data were limited in their dependence on carer observation (i.e., not based on self-report data). Although, olfactory loss often occurs without the individual being aware of any impact [20], limiting the accuracy of self-report data as well. It is also important to mention again the low specificity of smell loss symptoms to olfactory dysfunction. With this in mind, olfactory dysfunction may still be inferred in at least our Alzheimer’s disease, bvFTD, and semantic dementia patients, due to their significantly reduced olfactory network regional volumes as well as by comparison with other studies showing odor identification impairments in patients of similar age, disease duration, and clinical presentation [22, 43]. With respect to our sample, we excluded 28% of potential participants due to poor image quality (movement artefacts) and/or inflammation in the paranasal sinuses. Participants who were excluded due to poor MRI quality were significantly more functionally impaired than included participants (Supplementary Material). This somewhat limits the generalization of our results. MRI is also limited in that it may not detect some variations in nasal anatomy that could impact smell function—the addition of nasal endoscopy in future studies may address this issue. Our results are also limited by the unavailability of longitudinal control data, leaving the question of the contribution of chronological, as opposed to pathological, aging to longitudinal changes in OB in the dementia groups unanswered. No MRI studies to our knowledge have investigated the effect of healthy aging on OB volume using a within-subjects design. The only other existing study [80] found a negative relation between age and MRI-derived OB volume in 51 healthy control participants aged between 20–69 years with a one-sided-OB volume decrease of approximately 5.5 mm3 per decade, equating to total-OB volume loss of 11 mm3 per decade, or approximately 1 mm3 per year. This finding contrasts with the mean total-OB volume loss of 6–18 mm3 in one year in dementia groups observed in the present study. Similarly, previous postmortem studies have estimated a 10% reduction of cells in human OBs per decade from early adulthood to old age [81, 82], whereas the present study observed mean OB volume reductions of 10–25% in dementia groups in just one year. This makes it unlikely that our results of OB volume loss over time in dementia patients are the result of normal aging process.
Prospective studies that directly assess olfactory function will be needed to properly confirm and describe olfactory dysfunction in dementia, ideally using smell tests that are not influenced by odor-specific sensitivity or familiarity [83]. Functional MRI could directly infer the neuroanatomical correlates of olfactory dysfunctions that are present. Another addition for future research would be to correlate BMI and metabolic factors with OB volume in dementia syndromes given recent evidence that obesity influences OB volume [84]. Further investigations will help clinicians, patients and carers in understanding and managing smell loss in these dementia syndromes and may also clarify the potential for olfactory-related biomarkers to be used in future clinical trials.
Footnotes
ACKNOWLEDGMENTS
We thank all the participants and their carers for their time and contribution to this study. We acknowledge the technical support of Ramon Landin-Romero and James Carrick from the Brain & Mind Centre at the University of Sydney. This work was supported in part by funding to ForeFront, a collaborative research group dedicated to the study of frontotemporal dementia and motor neuron disease, from the National Health and Medical Research Council (NHMRC) (GNT1037746). FK is supported by an NHMRC Career Development Fellowship (GNT1158762). OP is supported by an NHMRC Leadership Fellowship (GNT20008020). The authors certify that no actual or potential conflict of interest in relation to this study exists.