
Abstract
Background:
Alzheimer’s disease (AD) is a neurological disease that has both a genetic and non-genetic origin. Mitochondrial dysfunction is a critical component in the pathogenesis of AD as deficits in oxidative capacity and energy production have been reported.
Objective:
Nuclear-encoded mitochondrial genes were studied in order to understand the effects of mitochondrial expression changes on mitochondrial function in AD brains. These expression data were to be incorporated into a testable mathematical model for AD used to further assess the genes of interest as therapeutic targets for AD.
Methods:
RT2-PCR arrays were used to assess expression of 84 genes involved in mitochondrial biogenesis in AD brains. A subset of mitochondrial genes of interest was identified after extensive Ingenuity Pathway Analysis (IPA) (Qiagen). Further filtering of this subset of genes of interest was achieved by individual qPCR analyses. Expression values from this group of genes were included in a mathematical model being developed to identify potential therapeutic targets.
Results:
Nine genes involved in trafficking proteins to mitochondria, morphology of mitochondria, maintenance of mitochondrial transmembrane potential, fragmentation of mitochondria and mitochondrial dysfunction, amyloidosis, and neuronal cell death were identified as significant to the changes seen. These genes include TP53, SOD2, CDKN2A, MFN2, DNM1L, OPA1, FIS1, BNIP3, and GAPDH.
Conclusion:
Altered mitochondrial gene expression indicates that a subset of nuclear-encoded mitochondrial genes compromise multiple aspects of mitochondrial function in AD brains. A new mathematical modeling system may provide further insights into potential therapeutic targets.
Keywords
INTRODUCTION
Alzheimer’s disease (AD) is the most frequent cause of adult dementia, affecting 6.5 million people 65 and older in the US alone in 2022, with deaths resulting from AD having increased 145% since 2000 [1]. Three genes have been identified that can cause familial AD—amyloid precursor protein or APP [2–6], presenilin 1 (PS1) [7, 8] and presenilin 2 (PS2) [9, 10]—and one gene, the apolipoprotein E4 isoform (APOE4), is a risk factor gene for sporadic AD [11, 12]. In addition to the hallmark features associated with AD pathology, the intracellular neurofibrillary tangles and the extracellular senile plaques, alterations in mitochondrial structure and function have also been reported. Altered oxidative metabolism has been found in AD brain tissue as well as in non-neuronal tissue [13]. In 1990, Parker [14] showed that cytochrome oxidase (CO) activity was significantly depressed in AD platelets, further indicating that AD may be a systemic disorder. Cybrid cell models of AD have shown altered mitochondrial structure and function [15, 16]. These and related observations of mitochondrial dysfunction have led to a “mitochondrial cascade” hypothesis for sporadic AD [17–19].
Mitochondrial-encoded electron transport chain (ETC) gene expression has been shown to be altered in both early and late stages of AD, with decreased expression of complex I and increased expression of complexes III and IV [20]. Increased expression of mitochondrial-encoded ETC genes has also been associated with aging, with increased expression of complexes I, III, IV, and V in 12- and 18-month-old mice compared with 2-month-old mice, which was accompanied by increased oxidative damage [21]. However, decreased expression of these genes was seen in older, 24-month-old mice, suggesting an initial compensatory upregulation of proteins in the ETC, which failed as aging continued. Further evidence for a role of mitochondria in AD pathogenesis comes from a study demonstrating increased levels of mitochondrial gene expression and oxidative damage in a transgenic APP mutant mouse model of AD [22]. In addition, various components of the mitochondrial permeability transition pore (mPTP), which acts as a voltage-dependent channel regulating mitochondrial membrane permeability, have been shown to interact with amyloid-β (Aβ) in various murine models of AD. For example, one study found that, in APP transgenic mice, Aβ acts to upregulate VDAC1, a component of the mPTP, leading to mPTP blockade [23]. Interestingly, this study also reported that VDAC1 may interact with hyperphosphorylated tau, suggesting another mechanism of mitochondrial dysfunction.
Taken together, these reports illustrate how nuclear encoded mitochondrial gene expression is altered in AD, a variety of mechanisms by which Aβ interacts with mitochondria in AD, and how mitochondrial dysfunction can lead to changes associated with AD, thus highlighting the need for continued research into the field. In this study, we addressed whether differences in nuclear-encoded mitochondrial gene expression in AD brains can help identify genes or pathways that can be used to understand the development and/or progression of AD and thereby provide potential targets for therapeutic intervention. These gene expression data have also been incorporated into the preliminary development of a testable, mathematical model for AD.
MATERIALS AND METHODS
Reagents
All primers used in the qPCR analysis were purchased from OriGene Technologies (Rockville, MD, USA). For western blot analysis of pathophysiologic markers of AD, antibodies were obtained from Invitrogen (β-amyloid polyclonal antibody (Invitrogen, ref# 71-5800); MAP2 polyclonal antibody (Invitrogen, ref# PA5-17646); β-Actin polyclonal antibody (Invitrogen, Ref# PA5-85271), or Life Technologies (Tau [pT231] Rb recombinant oligoclonal Ab (Life Technologies, ref#710126) or Li-Cor (Secondary Antibody: IRDye 680RD Goat anti-Rabbit (LI-COR, 926-68071).
Sample acquisition
Autopsy-confirmed brain samples were kindly supplied by Dr. W.W. Tourtelotte of the National Neurological Research Specimen Bank (NNRSB), VAMC, Los Angeles, CA 90073. Tissue/fluid specimens obtained from the NNRSB are sponsored by NINDS/NIMH, National Multiple Sclerosis Society, Hereditary Disease Foundation, Comprehensive Epilepsy Program, Tourette Syndrome Association, Dystonia Medical Research Foundation, and Veterans Health Services and Research Administration, Department of Veterans Affairs; Dr. Peter Davies of the Department of Pathology at Albert Einstein College of Medicine, New York, NY; Dr. Deborah C. Mash, University of Miami Brain Endowment Bank, Miami, FL; and the NIH NeuroBioBank at the University of Maryland, Baltimore, MD, the University of Miami, the Harvard Brain Tissue Resource Center, the Mt. Sinai Brain Bank, and the University of Pittsburgh.
The Eastern Virginia Medical School Institutional Review Board (IRB) has determined that use of these autopsy frozen brain samples is exempt from IRB review.
Preparation of total DNA for genotyping
Total DNA was isolated from frozen autopsy brain samples using the techniques of Swierczynski et al. [24] and Drouin [25] with modifications for the analysis of small amounts of tissue as described in Hamblet et al. [26, 27]. The postmortem delay or time of autolysis ranged from 3 to 24.1 h. Parietal cortex was obtained for all samples tested (control and AD). All AD brain tissue was confirmed at autopsy to have histological lesions characteristic of AD (neurofibrillary tangles and amyloid plaques). Genotyping of the APOE4 locus was performed using Taqman SNP Genotyping Assays rs429358 and rs7412 according to manufacturer’s guidelines.
Brain mRNA isolation and assessment
Approximately 150–225 mg of tissue was taken from the parietal cortex of 14 age-matched brain samples—7 control and 7 AD subjects. The groups of samples had average ages of 71 and 73 years, respectively. Total RNA was isolated using RNeasy Plus Universal Mini kits per manufacturer’s instructions.
Isolated RNA was quantitated by UV absorbance at 260 nm. The integrity of the isolated RNA was defined by RNA Integrity Numbers (RINs) determined by capillary electrophoresis using Agilent Nano1000 Bioanalyzer chips.
Mitochondrial biogenesis gene expression analysis
The Qiagen RT2-PCR Profiler PCR Array consisting of 12 controls and 84 nuclear encoded genes involved in mitochondrial biogenesis used sequence specific primers to amplify the corresponding cDNA strands in a 96-well plate configuration. A list of the genes in the array is shown in Supplementary Table 1. Relative changes in SYBR green fluorescence were used to assess levels of gene expression using a BioRad CFX96 thermocycler.
qPCR analysis
Verified qPCR primers for each of the genes of interest and several housekeeping genes were obtained from OriGene Technologies along with that company’s reverse transcription and PCR amplification kit. These genes of interest (GOIs) were identified by IPA analysis to have gene expression changes of±2.0 or greater. In addition, the GOIs had to be found in multiple disease pathways and dysfunctions. The primers and their sequences for the GOIs are listed in Supplementary Table 2. Following the manufacturer’s recommended protocol, we performed qPCR reactions in triplicate using 10 ng input total RNA in each PCR reaction. Due to limited or absent sample quantity, we prepared a pool of RNA isolated from 8 AD (average RIN = 6.2) and 10 control (average RIN = 6.2) brain samples. In order to demonstrate the broader relevance of the gene expression changes observed, none of the brains used for these control and AD pools were from the group of brains used to generate the RT2-PCR Array data. A list of the brains used to constitute these pools along with their individual RIN scores is shown in Supplementary Table 3.
The concentration of each RNA pool was adjusted to 200 ng/μl with equal representation of each sample in each pool. Triplicate reactions were run in a BioRad CFX96 thermocycler using SYBR green fluorescent dye incorporation to monitor real-time PCR product formation. Cts were obtained for genes of interest and our housekeeping gene (HPRT1) and ΔΔCt ratios were calculated. Primer efficiencies were determined for each primer pair for both the control and AD-RNA pools. These were used in the Pfaffl equation [28] to calculate fold changes in expression, where
Relative fold change = (EGOI)ΔCt,GOI (control–AD) /(EHPRT1)ΔCt,HPRT1 (control–AD)
In the above equation, EGOI is the amplification efficiency of the gene of interest; EHPRT1 is the amplification efficiency of the HPRT1 housekeeping gene; ΔCt, GOI (control –AD) is the Ct of the gene of interest in the control sample minus the Ct of the gene of interest in the AD sample, and ΔCt, HPRT1 (control –AD) is the Ct of the housekeeping gene HPRT1 in the control sample minus the Ct of the housekeeping gene HPRT1 in the AD sample.
Western blot analysis
Western blot analysis was performed on pools of control- and AD-protein isolated from the same brains used to generate the control- and AD-RNA pools for qPCR analysis. These brains are listed in Supplementary Table 2. Protein was recovered using N-PER (Neuronal Protein Extraction Reagent, Thermo Scientific, USA) according to the manufacturer’s recommendations. Briefly, approximately 10 mg of the frozen brain was homogenized in 200μl N-PER containing Halt Protease and Phosphatase Inhibitor (Thermo Scientific, USA). After the addition of another 100μl N-PER, the homogenate was incubated on ice for 30 min, then centrifuged at 10,000× g at 4°C for 10 min to pellet debris. The supernatant was collected, and the protein concentration was determined by micro BCA assay (Thermo Scientific, USA). The protein was concentrated by acetone precipitation and re-suspended in N-PER to a concentration of 6.25μg/μl. NuPAGE LDS sample buffer and NuPAGE Sample Reducing Agent (Invitrogen) were added to aliquots containing sixty micrograms of protein. Samples (60μg) were incubated at 70°C for 10 min then loaded onto NuPAGE Novex 4–12% BIS-TRIS polyacrylamide gel. After electrophoresis, proteins were transferred to PVDF (polyvinylidene difluoride) membranes for 1 h. After transfer, the membranes were washed 4 times with deionized water, blocked for 1 h in TBS (Tris-Buffered Saline) +5% evaporated milk followed by overnight incubation at 4°C with primary antibody at a dilution of 1:500 in TBST (TBS plus 0.1% Tween20) containing 5% evaporated milk. After washing 3 times with PBST (Phosphate-Buffered Saline plus 0.1% Tween20), the membranes were incubated with secondary antibody at a 1:10,000 dilution in TBST containing 5% evaporated milk to visualize the targeted protein. Following 4 washes with PBST and 2 washes with PBS, the targeted protein was visualized using the Odyssey CLX. Following visualization with the primary antibody, the membranes were washed with deionized water and PBS, re-blocked for 1 h in TBS +5% evaporated milk, then incubated overnight at 4°C with β-actin antibody at a dilution of 1:500 in TBST containing 5% evaporated milk. Membranes were washed, incubated, and visualized as described above.
Statistical analysis
Qiagen software was used to generate data on fold-changes in expression and p-values when AD and control brain expression levels were compared. Further analyses of networks, biological processes, and disease associations were performed using Ingenuity Pathway Analysis (IPA) software. IPA fold change calculations (gene expression ratios) were calculated using the classic, well-established, and widely adopted ΔΔCT method originally published in [29]. The p-value is calculated based on a Student’s t-test of the replicate 2–ΔCT values (or linearized normalized gene expression levels) for each gene in each Control and AD Group comparison. The p-value calculation used is based on parametric, unpaired, two-sample equal variance, two-tailed distribution. No statistical analysis was performed on the qPCR data since sample pools were used.
RESULTS
Isolation and evaluation of total RNA from frozen AD and control brains
We isolated total RNA from seven control brains (5 males, 2 females; avg. age 71.0) and seven AD brains (3 males, 4 females; avg. age 73.0) (Table 1). The integrity of the RNA samples was assessed using agarose gel electrophoresis or capillary electrophoresis (Fig. 1). The RINs were estimated by the Bioanalyzer software and can be seen to range from 2.8 (AD1537) to 8.9 (AD2005). The RIN for RNA samples assessed by gel electrophoresis was estimated to be greater than 5 based upon comparison to Bioanalyzer profiles obtained with other samples. In order to achieve an adequate number of samples for the RT2-PCR array analyses using the brains in our possession, it was necessary to include the three brains in Table 1 with RIN scores below 5.0. APOE genotyping showed that 5 of the 6 control brain samples were ɛ3, ɛ3 with one control being ɛ3, ɛ4. Of the seven AD brain samples, two were ɛ3, ɛ3, four were ɛ3, ɛ4, and one was ɛ4, ɛ4.
Description of AD and control brain samples in this study
aEstimated from 28S and 18S rRNA patterns on agarose gel electrophoresis.
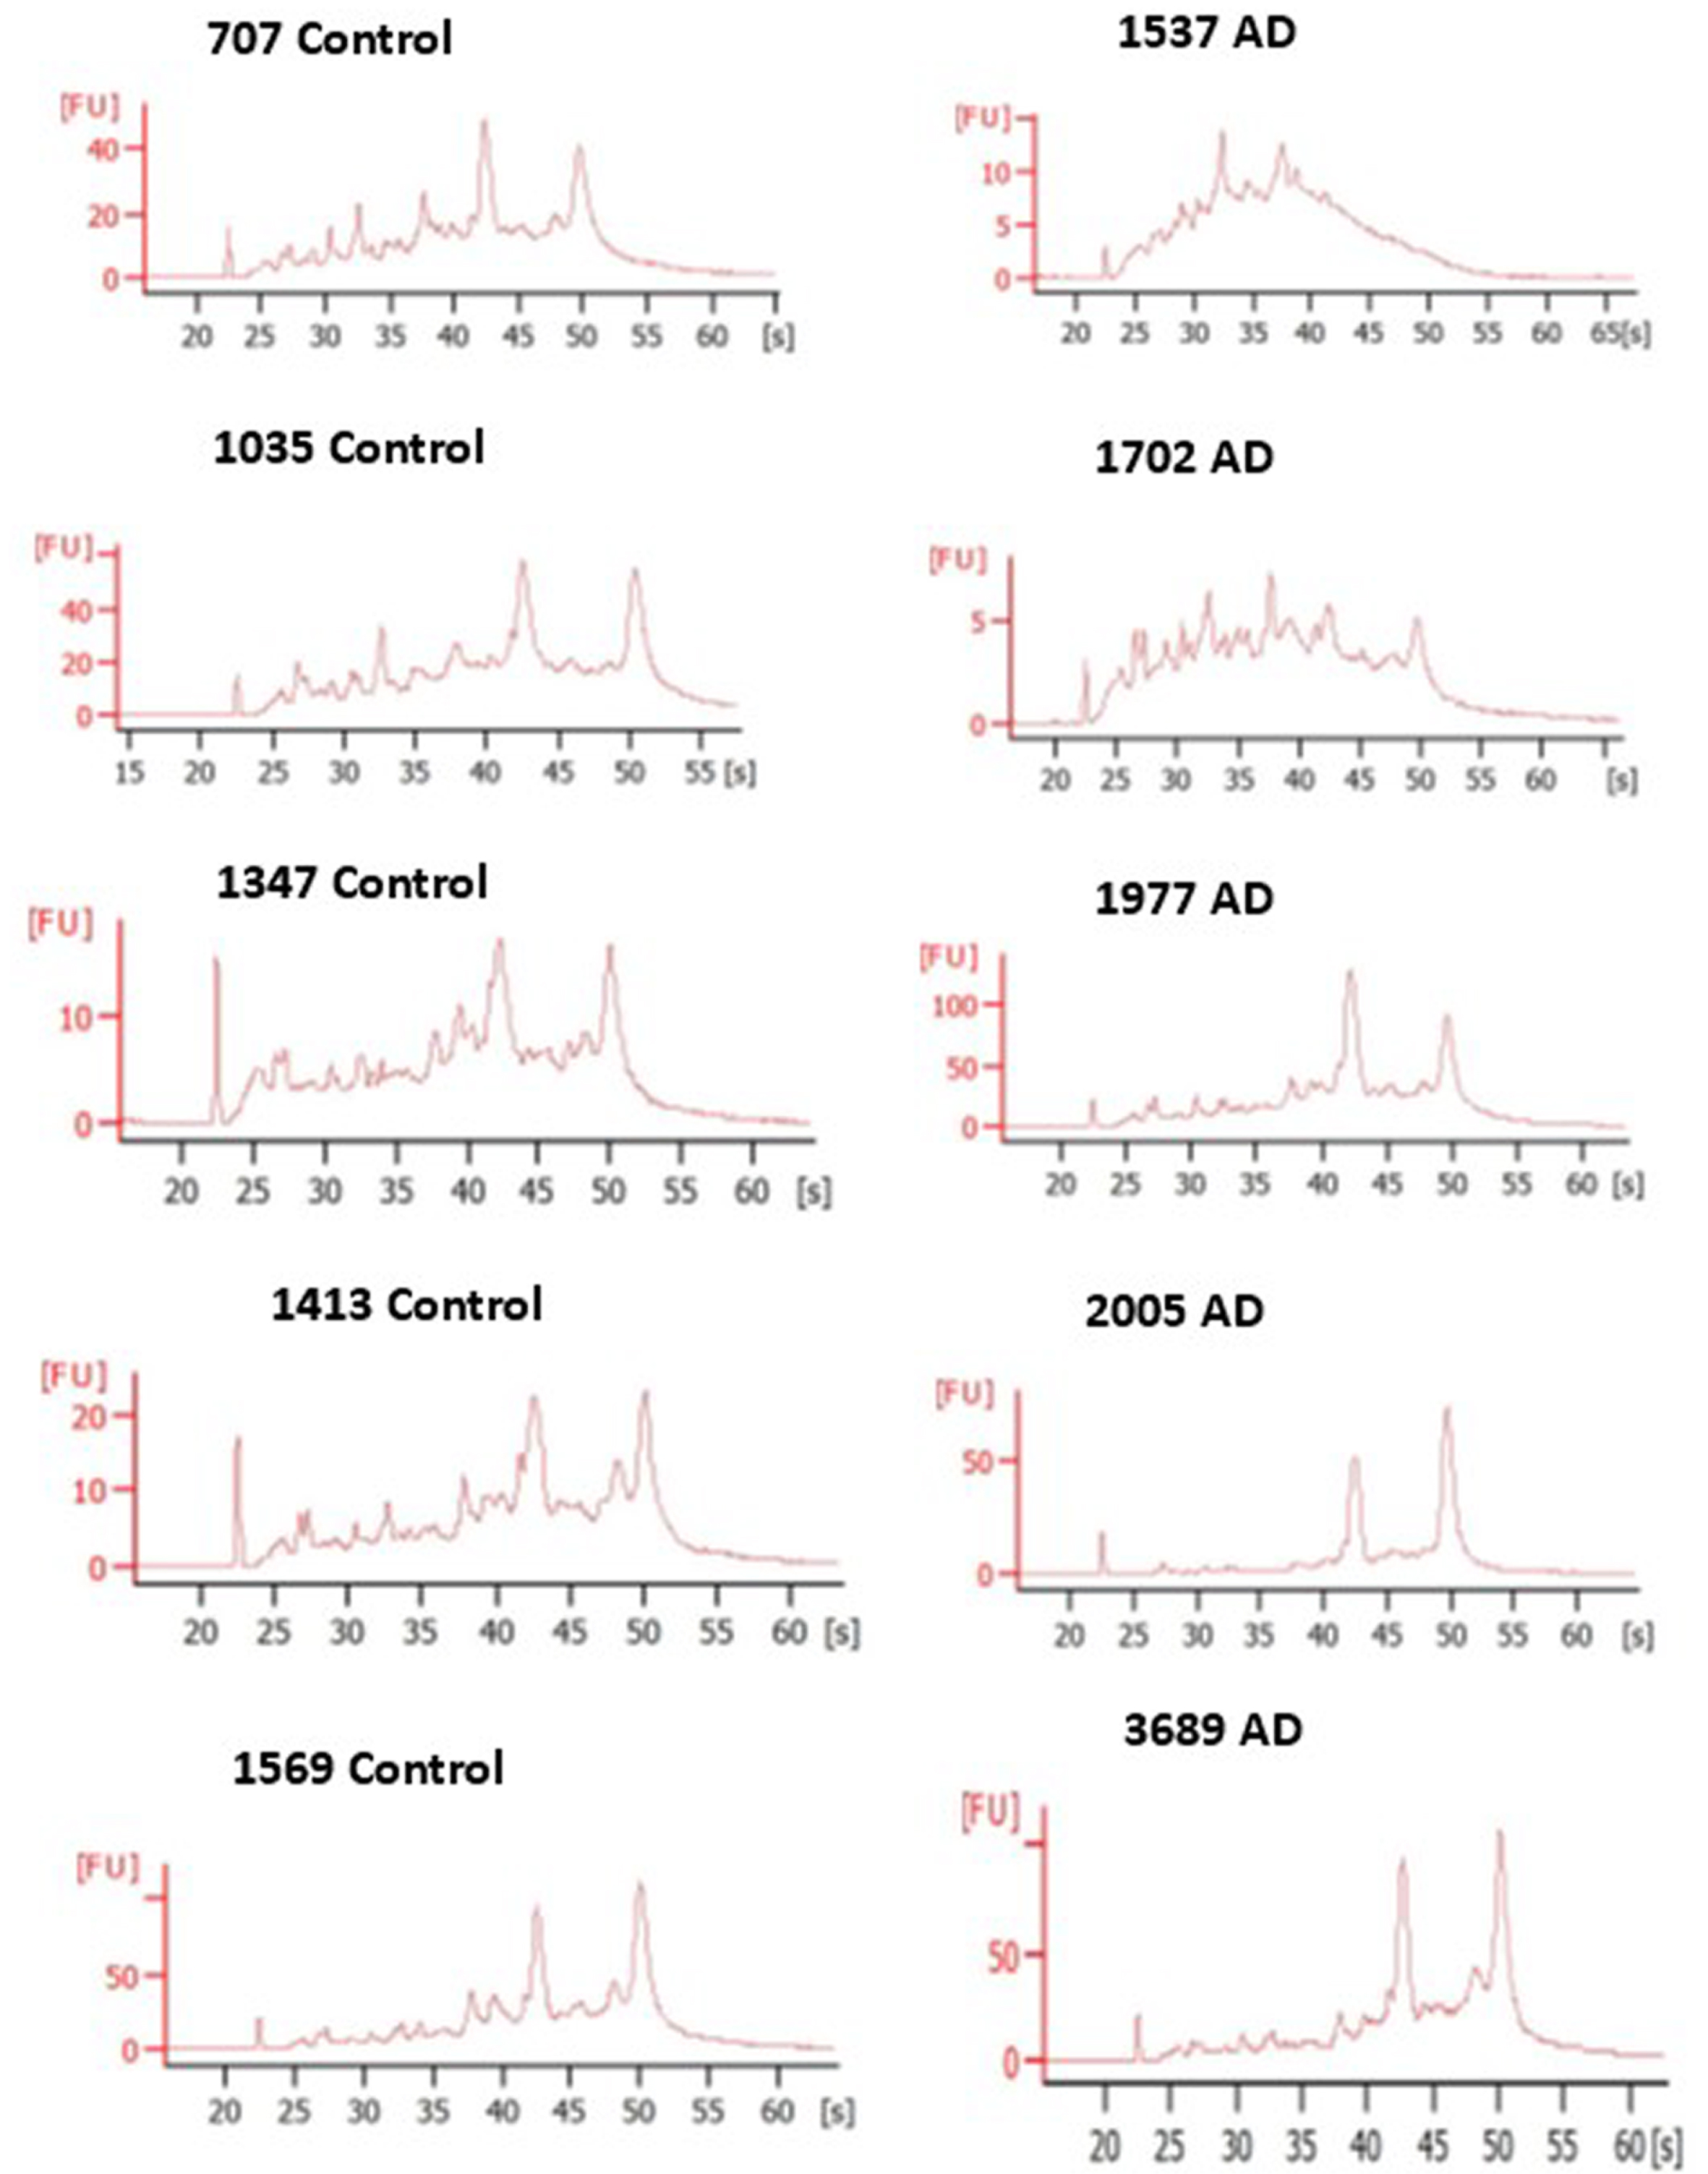
Bioanalyzer electropherograms and corresponding RIN scores for 10 total RNA samples studied. Left, Control samples 707, 1035, 1347, 1413, and 1569. Right, AD samples 1537, 1702, 1977, 2005, and 3689. RIN values ranged from a low of 2.8 to a high of 8.9.
Gene expression changes in AD samples compared to controls
Examination of the gene expression data by software provided by Qiagen for analysis of RT2-Profiler Arrays indicated that three of the 84 genes queried were overexpressed and a larger number (19) were under-expressed in AD brains compared to control brains. A graphical representation of these changes is shown in the volcano plot in Fig. 2, where upregulated genes are shown in red and downregulated genes in green. A prior comparison of control versus control brains indicated that the variation in gene expression in these control samples suggested that a minimum and maximum base-2 log fold-change threshold boundary of 1.0 (indicated by the vertical lines) would encompass 95% of the expression levels of the control sample genes. Therefore, only genes with fold-changes greater than 2.0 were considered for further filtering and analysis by qPCR. The horizontal line is set at a p-value of 0.05. A number of downregulated genes and one upregulated gene have p-values equal to or less than 0.05.
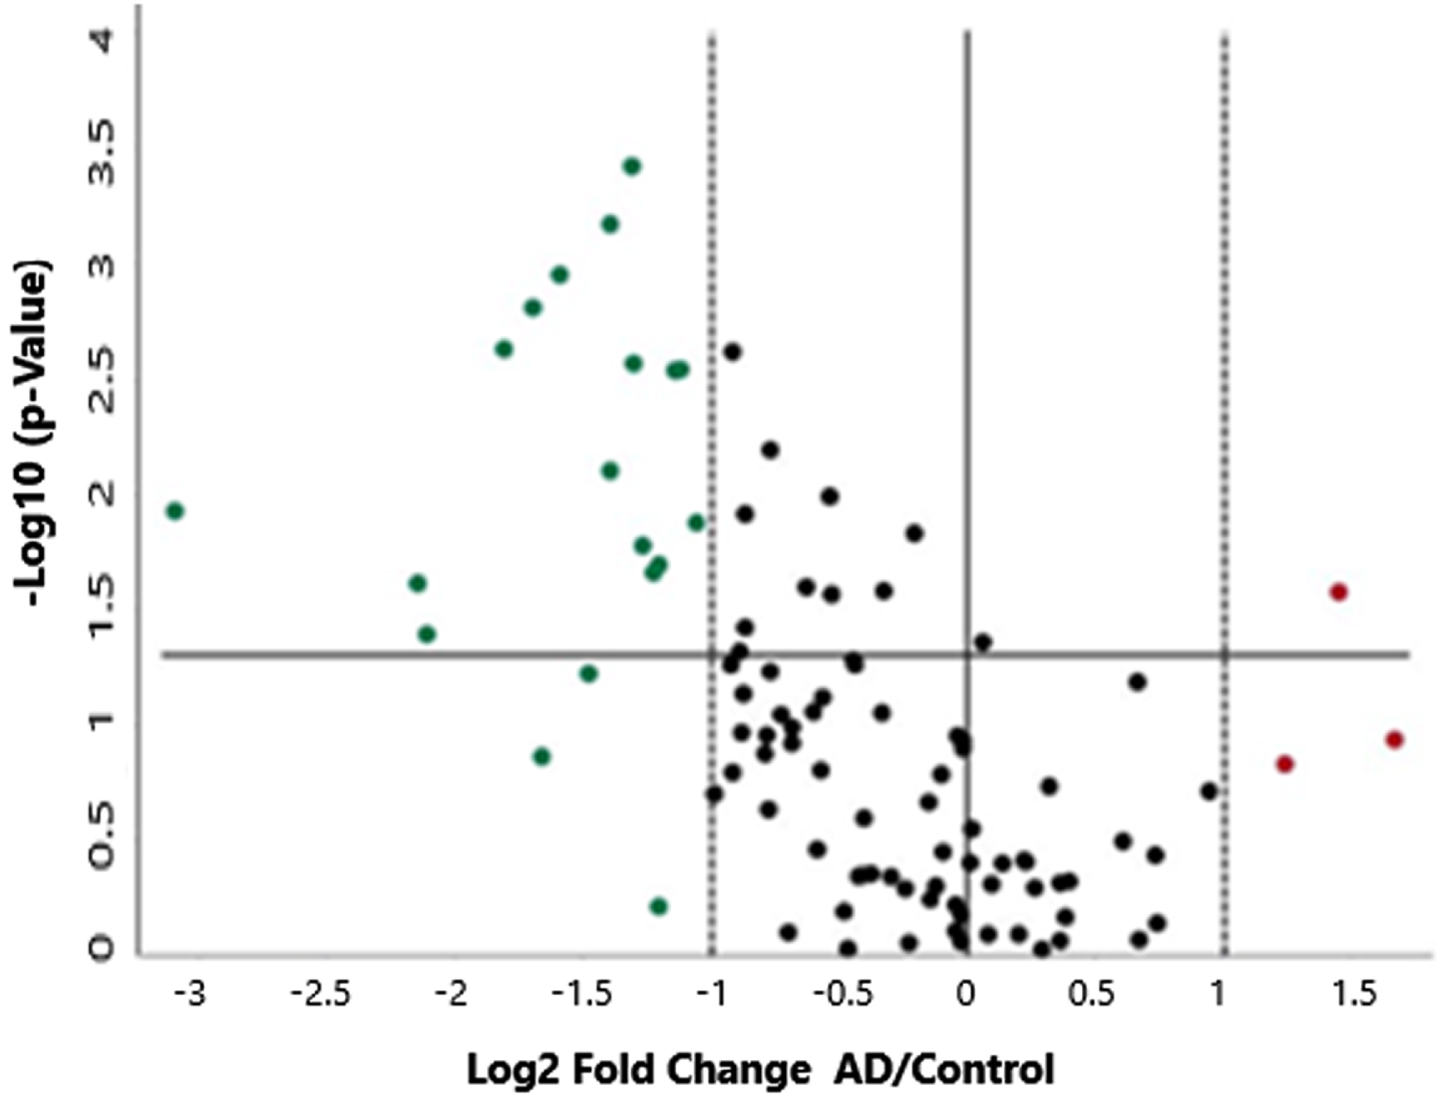
A volcano plot showing Mito Biogenesis gene expression differences between control and AD samples. The fold-regulation threshold boundaries are set at 2.0 and the horizontal line represents a p-value of 0.05. There are three upregulated genes shown in red and 19 downregulated genes shown in green.
The most upregulated gene is SOD2 (+3.18-fold), while the most downregulated gene is NEFL (–8.54-fold). The upregulated gene with the smallest p-value is CDKN2A (p = 0.027), while the downregulated gene with the smallest p-value is DNM1L (p = 0.00038). A list of the up and downregulated genes is shown in Table 2.
Over- and under-expressed genes in AD versus control brain
aEntries in red font reflect genes with p-values >0.05
Those entries shown in red font in Table 2 and all other tables have sizable changes in expression but have p-values greater than 0.05. The genes showing the strongest upregulation in the AD brains are SOD2 (+3.18-fold), CDKN2A (+2.73-fold), and B2M (+2.37-fold). The only upregulated gene with a p-value less than 0.05, CDKN2A, is overexpressed by 2.73-fold (p = 0.027). Most of the changes in gene expression were seen with the downregulated genes, where there are 19 under-expressed genes in the AD brain versus control comparison with 16 having p-values less than 0.05. The most under-expressed gene in the AD cohort was NEFL (–8.54) with a p-value of 0.012. Other genes of interest that were significantly downregulated were OPA1 (–3.24), FIS1 (–3.02), TP53 (–2.63), MFN2 (–2.34), and DNM1L (–2.47), which had the smallest p-value (0.00038).
Are all or some of these differentially expressed genes connected to well-established canonical pathways of cell function?
Almost all of the analysis of the gene expression data from the RT2-PCR arrays was performed using IPA software. The identification of canonical pathways, associations with known diseases or cellular dysfunctions, and the connection to biological networks were all achieved using IPA software. The only exception was the incorporation of the gene expression data for a subset of genes of interest into the mathematical model being constructed by our group. This analysis is described in more detail in a later section.
Analysis of the gene expression data using IPA software identified five significant or canonical biological pathways that are strongly associated with the genes showing either up- or downregulation in our AD brains. These pathways, shown in Fig. 3, are the Sirtuin Signaling, HIV-induced Apoptosis, p53 Signaling, Mitochondrial Dysfunction, and Apoptosis Signaling. The strong, non-random associations of these canonical pathways with our gene set are confirmed by the p-values (Sirtuin Signaling, p = 3.21×10⁻²⁵; Induction of Apoptosis by HIV1, p = 7.21×10⁻¹⁶; and p53 Signaling, p = 1.26×10⁻⁷) and z-scores (OXPHOS, z = –6.225; Sirtuin Signaling, z = 2.694).
Top 5 canonical pathways associated with our dataset. The horizontal bar refers to the pathway, with the number of genes comprising the canonical pathway indicated immediately to the right of the bar. The green and red colored segments of a bar reflect the percentage of the total number of genes that are comprised of genes in our dataset. The green represents downregulated genes and the red, upregulated genes. The negative log of the p-value is shown by the yellow box associated with each pathway, with the value shown in blue.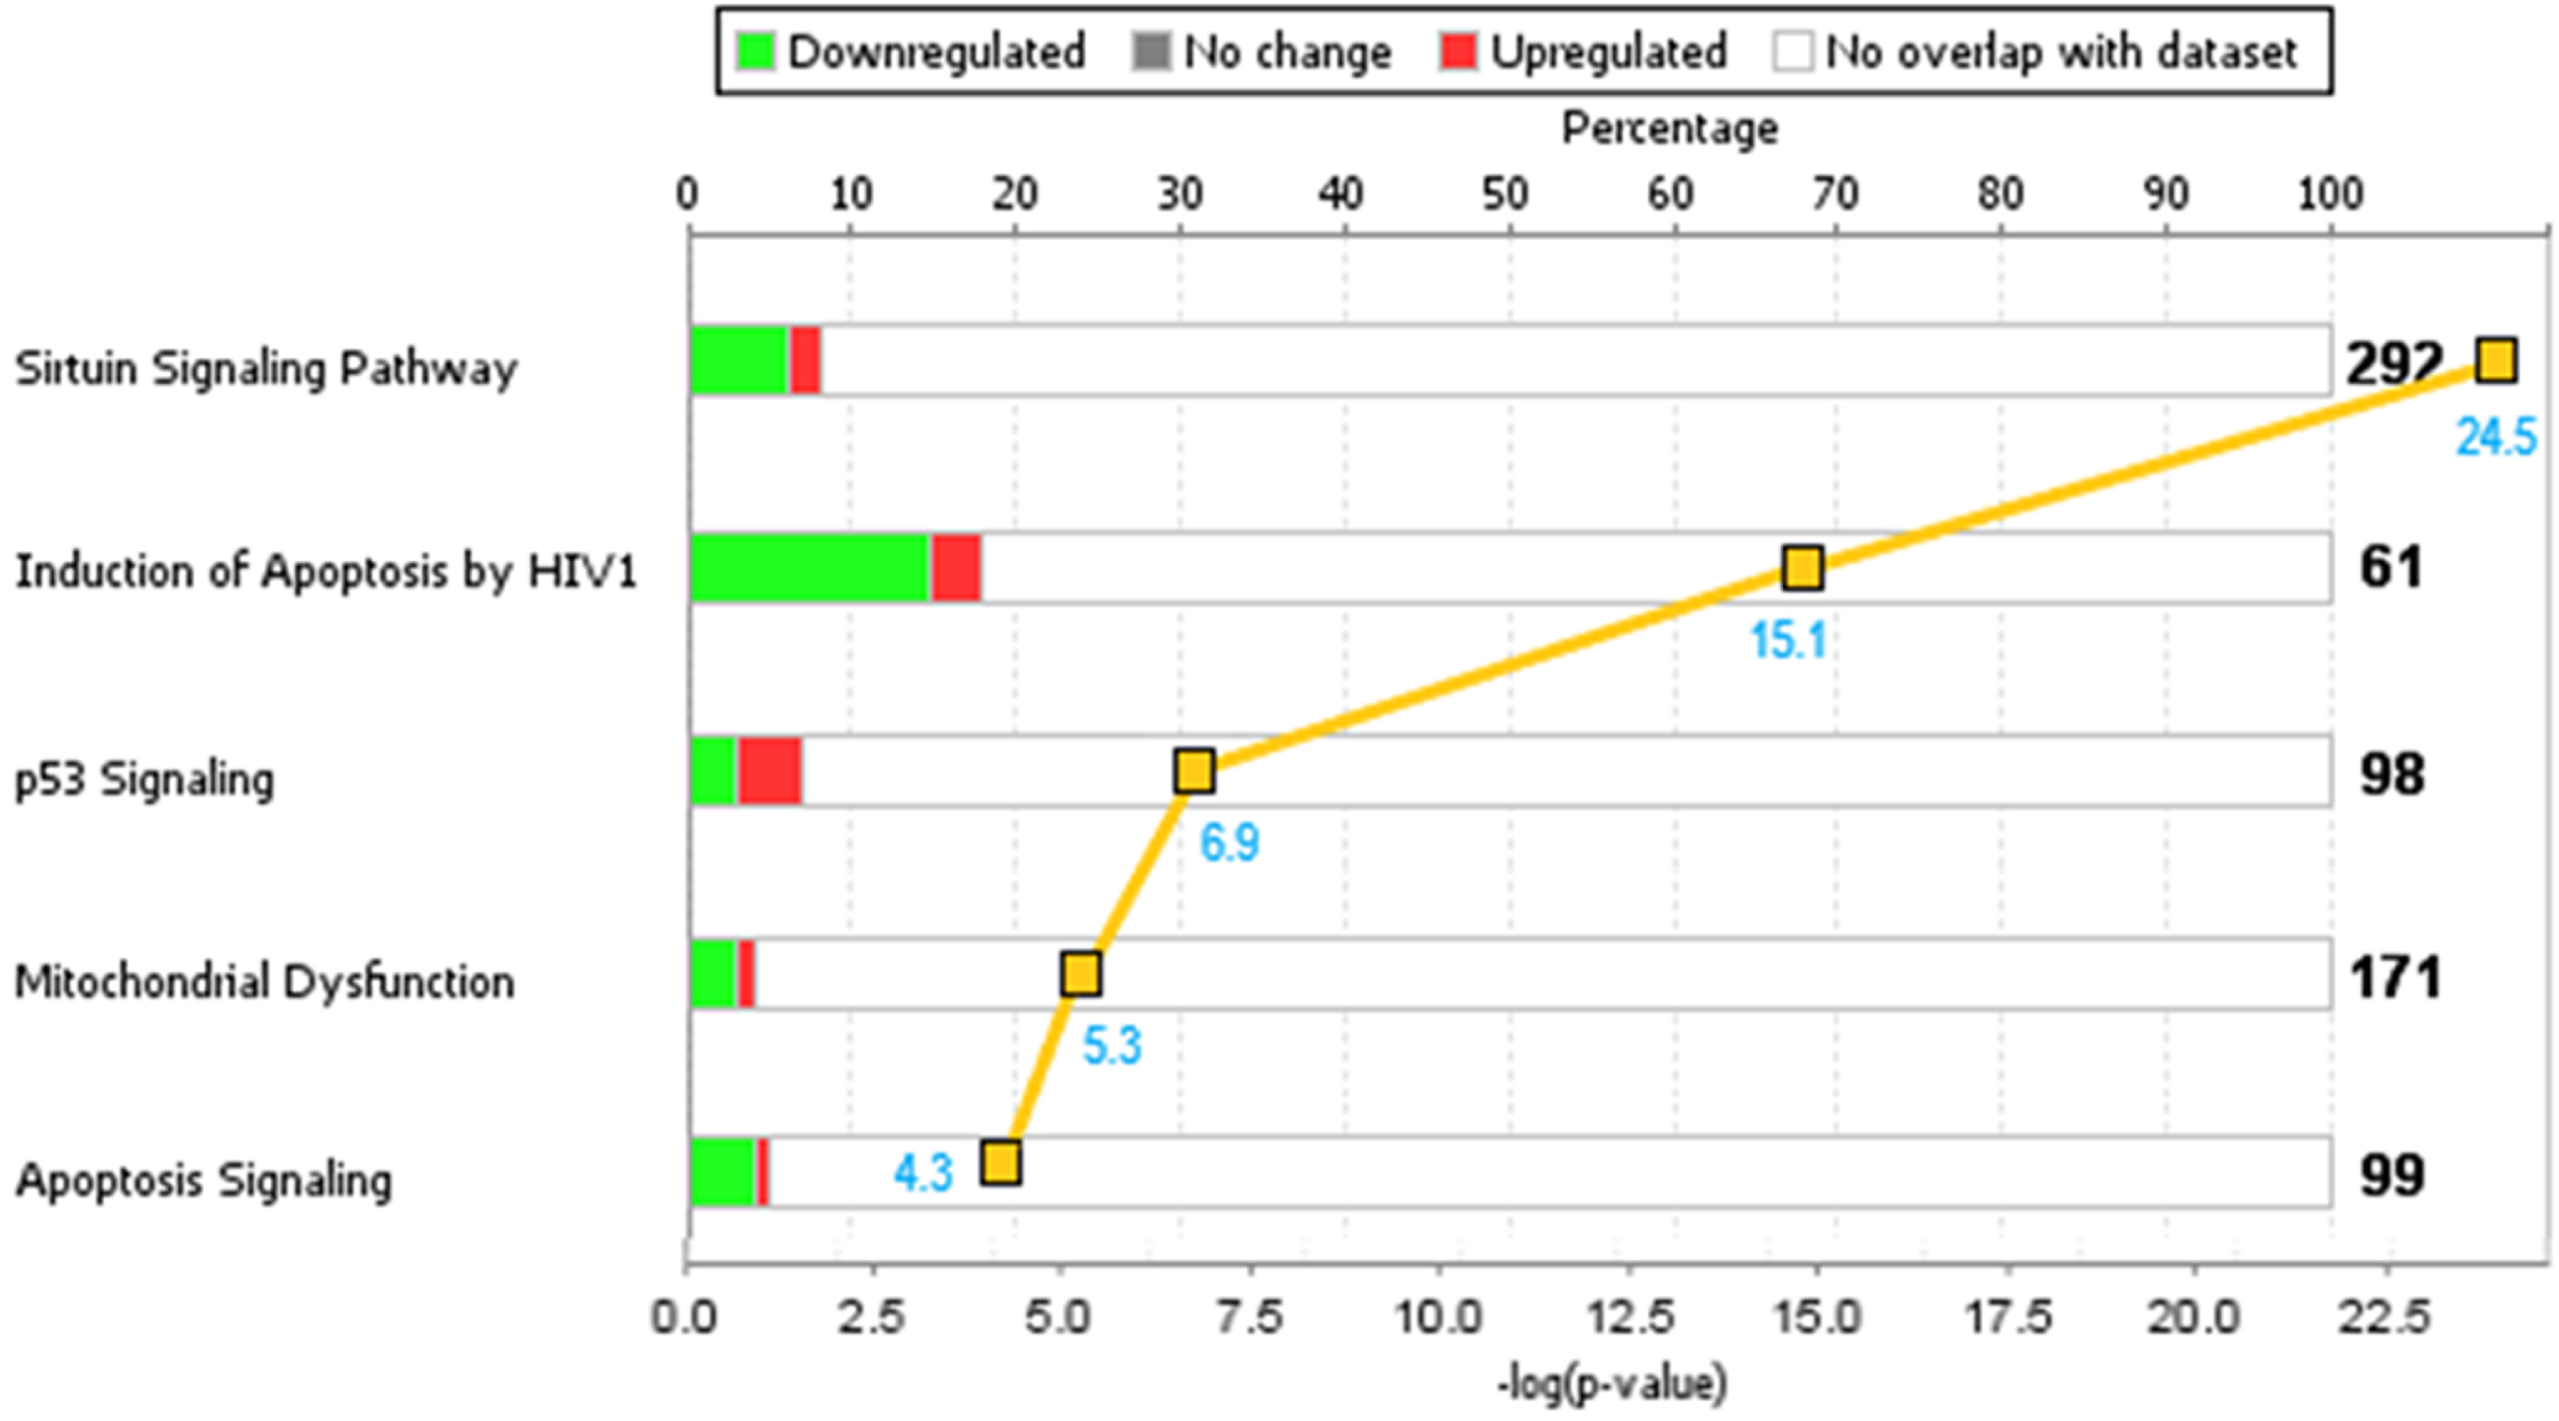
Are any or all of the genes in our differentially expressed dataset associated with known diseases or cellular dysfunction?
In addition to the strong linkages to these five canonical pathways, it was of interest to determine if our gene set was or could be linked to specific diseases in a statistically significant way. Table 3 shows the three top diseases or processes most strongly linked to the dataset of genes altered in the comparison of AD to control brains. Not unsurprisingly, two of the top three diseases are found to be neurological disease and metabolic disease. Neurological disease is associated with a variety of biological processes or functions with a non-random significance ranging from 10–4 to 10–14. Likewise, metabolic disease contains elements with p-values from 10–4 to 10–10. The third of the diseases identified is organismal injury, also with strong non-random associations with a variety of biological functions or processes with p-values ranging from 10–4 to 10–14.
Three top diseases or processes linked to our dataset
The top disease, neurological disease, has a number of biological functions or processes associated with it. The cell function with the most significant p-value is Cell Death of Brain Cells. Similarly, other top ranked cellular processes are Cell Death of Cortical Neurons, Alzheimer’s Disease, and Apoptosis of Brain Cells. As Table 4 shows, each of these is associated with a number of the genes in our dataset that have fold-regulations greater than±2.0. Table 4 also includes the p-values related to those fold-regulations, with the genes having non-significant p-values shown in red.
Essential biological processes or functions associated with neurological disease affected by our gene dataset
aThe last column in Table 4 indicates whether the particular gene has a known effect to either decrease or increase the function or process associated with that gene. If there is no known increase or decrease associated but there is a link of a gene to the process, the entry in Table 4 is “Affects.” bEntries in red font reflect genes with p-values >0.05.
Several of the genes in our data set (e.g., CDKN2A and SLK25A12) affect multiple processes associated with Neurological Disease, as shown in Table 4. This recurrence of a subset of genes within our data set affecting multiple processes signals their importance as influential genes in the pathogenicity of AD.
The second ranked disease linked to our study was organismal injury and abnormalities.
Supplementary Table 4 shows the most highly associated biological processes or diseases linked to the genes in our dataset. Cell Death of Brain Cells, Cell Death of Cortical Neurons, Mitochondrial Disorder, Amyloidosis, and Alzheimer’s Disease are significantly associated with our dataset, with p-values ranging from 6.76×10⁻¹⁴ (Cell Death of Brain Cells) to 1.53×10⁻⁷ (Alzheimer’s Disease). For those functions already listed in Table 4, the individual genes are not included in Supplementary Tables 4 and 5, just the function is listed. For those processes in Supplementary Tables 2 and 5 that are new, the genes, their fold-regulation, their p-values, and their effects on the process are indicated.
The third ranked disease linked to our study was metabolic disease. Supplementary Table 5 shows the most highly associated biological processes or diseases linked to the genes in our dataset.
In a manner similar to Table 4, Supplementary Table 5 lists Mitochondrial Disorder, Amyloidosis, and Alzheimer’s Disease as significantly associated with our dataset, with p-values ranging from 7.57×10⁻¹⁰ (Mitochondrial Disorder) to 1.53×10⁻⁷ (Alzheimer’s Disease).
In addition to diseases that could be associated with our differentially expressed gene set, there were also linkages to important cellular functions that included protein trafficking, cell morphology, cellular assembly, organization, function and maintenance, as well as cellular compromise. These cellular functions and the range of p-values representing the strength of these linkages to our dataset, are shown in Table 5.
The top five cellular functions linked to our mitochondrial biogenesis gene dataset
As can be seen in Table 5, the p-values range from 10–4 to 10–23. These ranges reflect the non-random association of various aspects of biological processes comprising the overall cellular function. For example, as seen in Table 6, the cellular function of protein trafficking has a single biological process—targeting of proteins—that has a p-value of 2.66×10⁻²³. There are four genes in our data set that affect this biological function: MFN2, TOMM40, TIMM17A, and FIS1.
Protein trafficking
Cell Morphology, shown in Supplementary Table 6, comprises multiple biological processes with significant factors such as Morphology of Mitochondria (p-value = 8.22×10⁻²³), Transmembrane Potential of Mitochondria (p-value = 2.21×10⁻²¹), and Permeabilization of Mitochondria (p-value = 1.35×10⁻¹⁶). Accordingly, a large number of genes in our dataset is found to affect these processes. Some, like SOD2, DNM1L, and TP53, as examples, can increase one function while decreasing another function.
Similarly, Cellular Assembly and Organization includes biological processes such as Morphology of Mitochondria, Depolarization of Mitochondria, Function of Mitochondria, and Opening of Permeability Transition Pores (Supplementary Table 7).
Here, several processes are found to be associated with previously described functions, such as Morphology of Mitochondria, so the genes associated with this process, which have already been discussed in Supplementary Table 6, are not included as separate entities in Supplementary Table 7. A similar decision was made for those processes of Cellular Function and Maintenance (Supplementary Table 8) and Cellular Compromise (Supplementary Table 9). However, newly identified processes such as Opening of the Permeability Transition Pore are seen to contain genes (e.g., SOD2, DNM1L, and TP53), also associated with other processes like Cellular Function and Maintenance or Cellular Compromise, further highlighting their importance in mitochondrial and cellular activity.
Of the 17 processes associated with the five cellular functions identified in Table 5, there are seven that are seen to be linked to a small number of proteins found in multiple processes. These seven processes are Cell Death of Brain Cells, Transmembrane Potential, Morphology of Mitochondria, Fragmentation of Mitochondria, Dysfunction of Mitochondria, Amyloidosis, and Alzheimer’s Disease. Comparison of the data in Supplementary Tables 4–9 indicates that a short list of nine genes is found to affect multiple diseases or biological processes/functions. These top genes of interest are TP53, MFN2 (which appear in all 7 of the top diseases/functions affected); DNM1L and OPA1 (which appear in 6 diseases/functions affected); and FIS1 (which appears in 5 diseases/functions affected). SOD2, CDKN2A, and GAPDH appear in 4 diseases/functions affected, and BNIP3 appears in 3 diseases/functions affected.
What are the most affected networks related to our gene dataset?
To investigate any broader interactions involving our gene set, we evaluated the top biological networks containing all or some of these genes. Table 7 indicates that there were four such biological networks.
The four top biological networks linked to the Mito Biogenesis gene changes found in the AD brains compared to controls
These four networks include Cell Morphology, Cellular Function and Maintenance, and Protein Trafficking; Amino Acid Metabolism, Molecular Transport, and Small Molecule Biochemistry; Cell Morphology, Cellular Assembly and Organization, and Cellular Compromise; and Neurological Disease, Protein Degradation, and Protein Synthesis.
The score associated with each network is derived from a p-value and indicates the likelihood of the Focus Genes in a network being found together due to random chance. Focus genes are user-defined by IPA software as important genes demonstrating a high level of interconnectedness within a particular network. We have included only those networks that have a score greater than 20. A score of 2 indicates that there is a 1 in 100 chance that the Focus Genes are together in a network due to random chance. Therefore, scores of 2 or higher have at least a 99% confidence or greater of not being generated by random chance alone. The top network with a score of 66 is comprised of 35 Focus Genes that include 28 genes within our data set. The next three networks, with scores of 32, 27, and 22 include 16, 14, and 12 Focus Genes, respectively.
Figure 4 depicts the interactions between the focus molecules in these four networks. To simplify visualization of this complex figure, the nine genes—TP53, CDKN2A, SOD2, FIS1, MFN2, OPA1, GAPDH, BNIP3, and DNM1L—identified above have been highlighted by locating them in a roughly circular pattern on the outside edges of Fig. 4. An important AD-related tenth molecule, APP has been located at the top of the figure. It is clear that these 10 molecules are linked to a large number of other molecules in these top biological networks, and collectively these networks are associated through numerous molecules with APP levels in the AD brain.
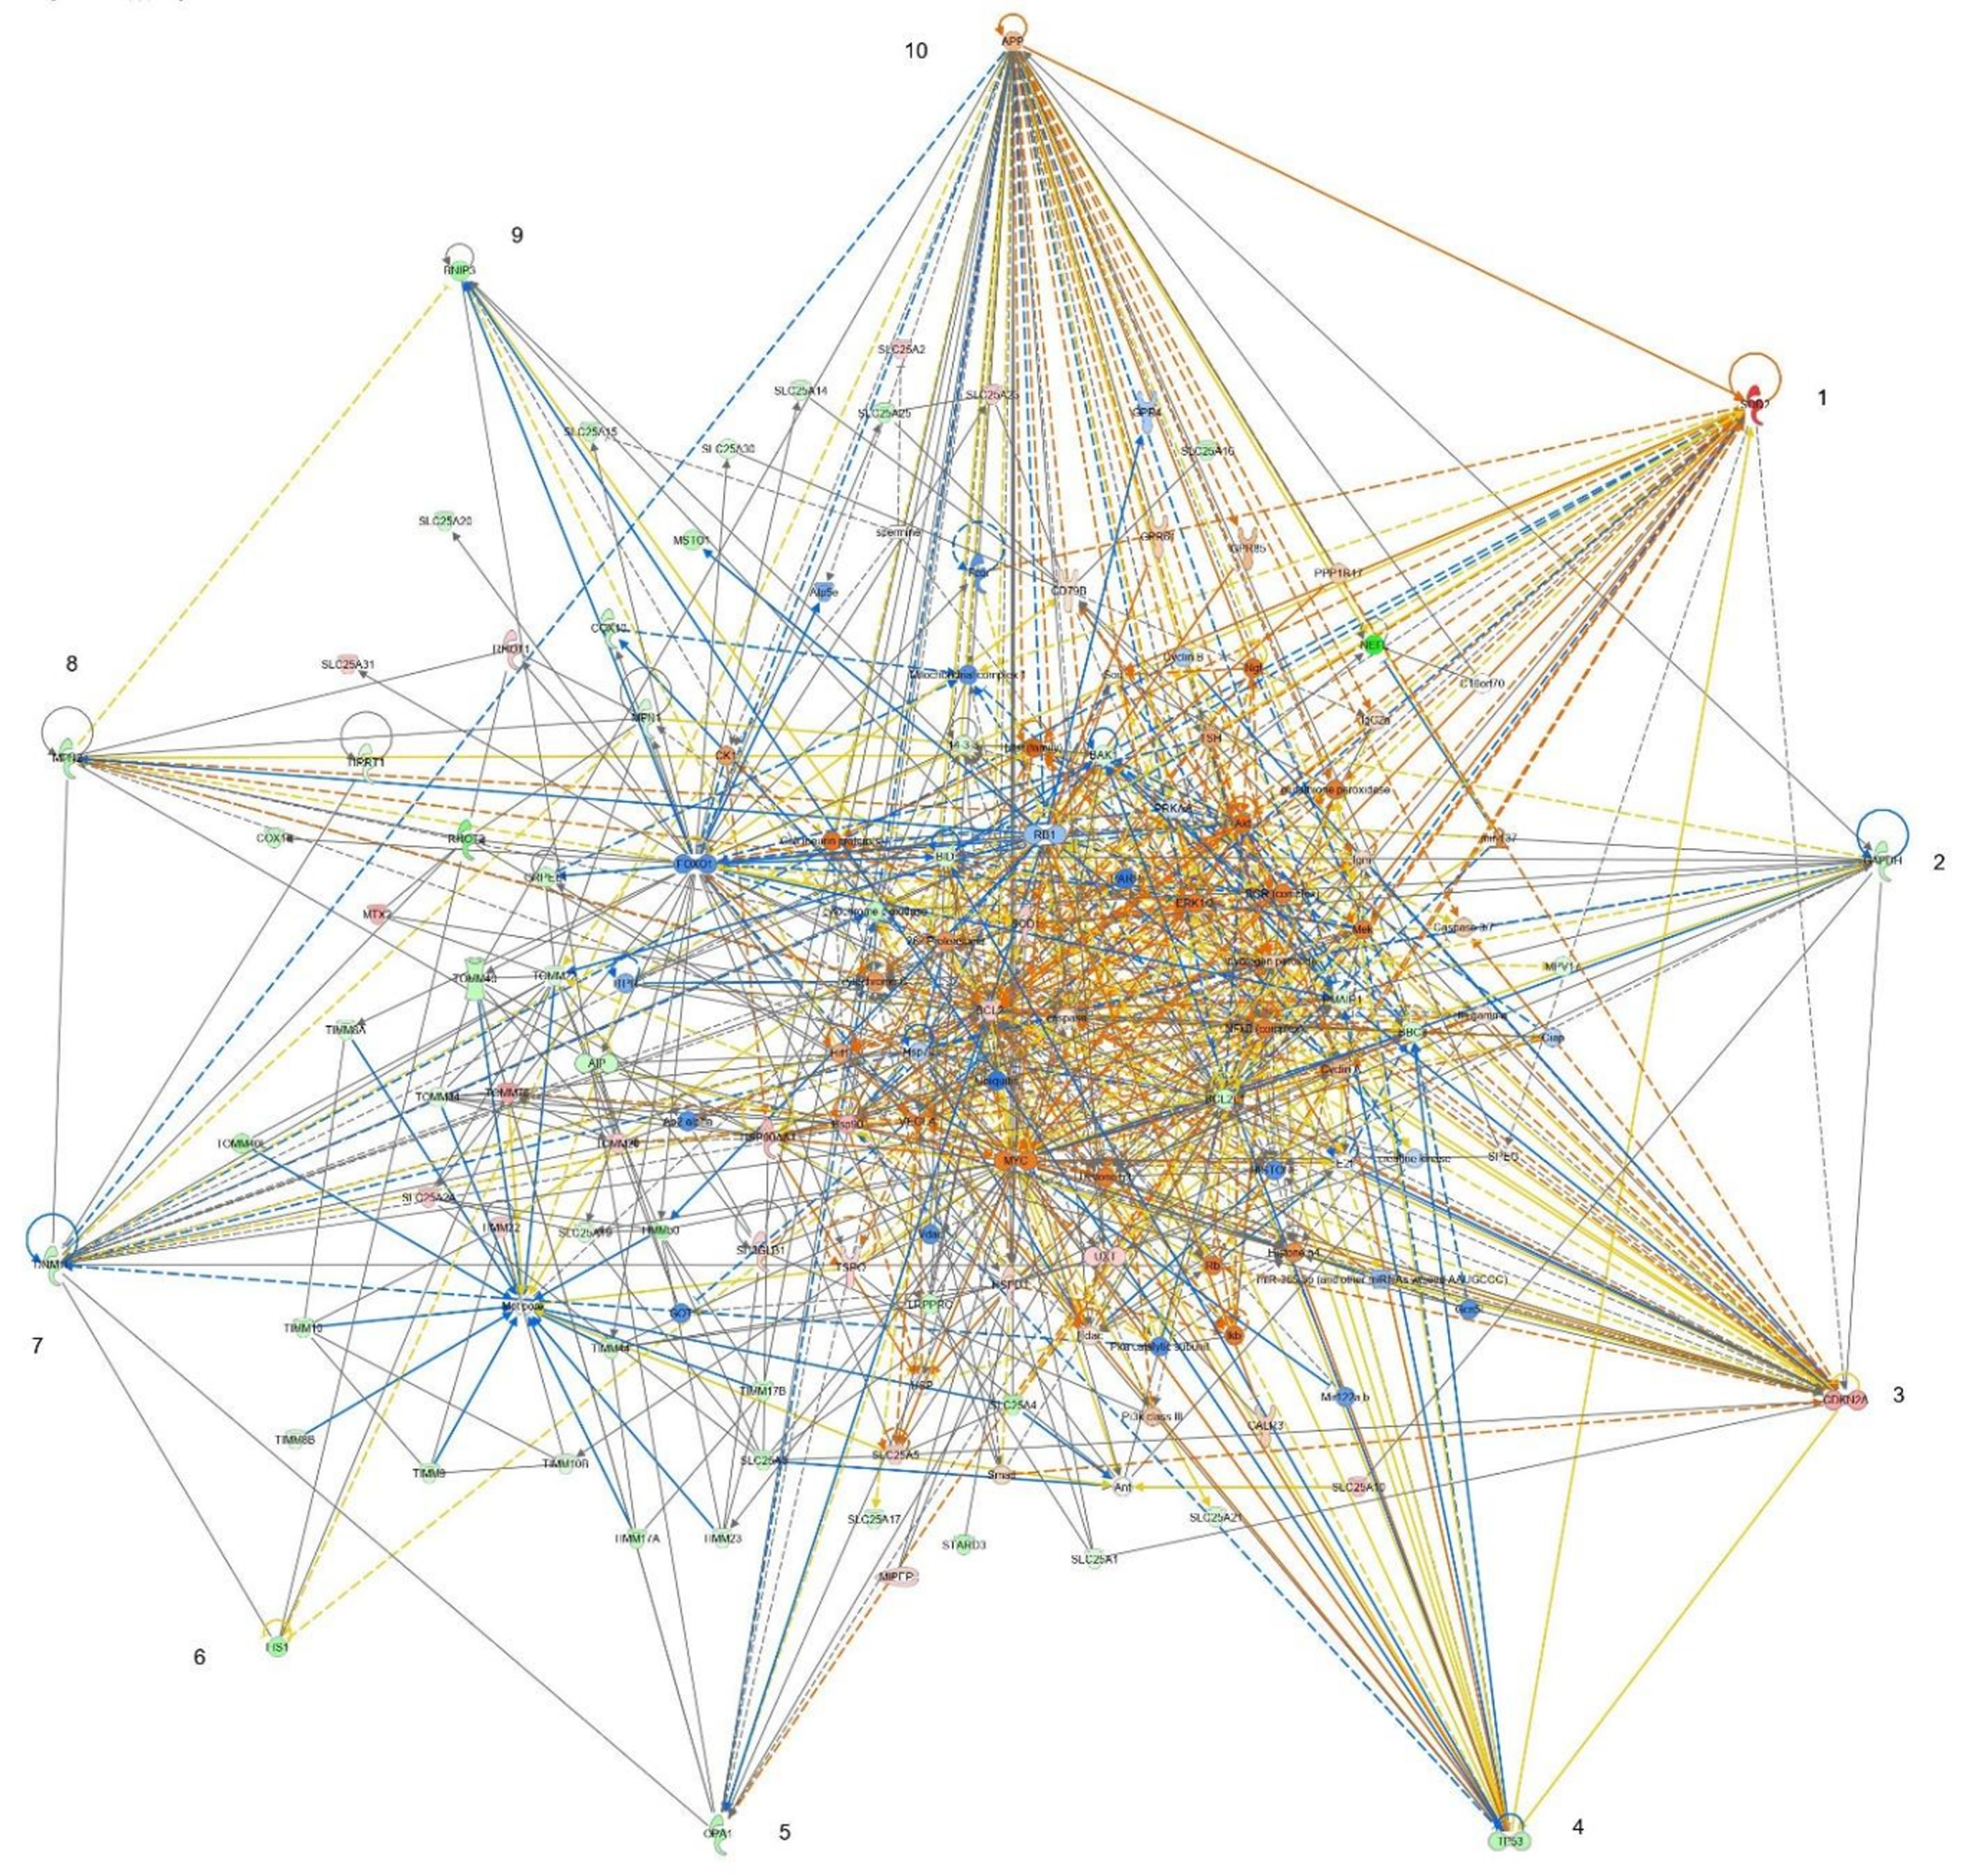
The four most prominent networks are merged. The nine genes identified in this study as strongly affecting mitochondrial transmembrane potential, morphology and apoptosis are placed along the outer edge of this diagram and are seen to be major hubs in these pathways, as noted by the numerous connections to other important genes within our dataset. The nine genes of interest (1–9) are numbered clockwise as 1- SOD2; 2- GAPDH; 3- CDKN2A; 4-TP53; 5- OPA1; 6- FIS1; 7- DNM1L; 8- MFN2; 9- BNIP3; and 10- APP.
Can these differentially expressed genes be used to predict an impact on the development of cellular, physiological or biochemical changes associated with AD: A working mathematical model for AD using protein and gene expression data from our dataset
The differential gene expression data was incorporated into a mathematical model for AD being developed by our group [30–32]. This model is being used to identify significant pathways in AD progression that then could be mathematically manipulated to simulate effects on cell function. Full details of the mathematical construction of the model are described in the accompanying paper by Shelton et al. [33]. In brief, our model utilizes a MatLab-based mathematical analysis and biochemical systems theory to perform dynamic computer simulations. Through the development and application of appropriate differential equations, the flux of various metabolites and small molecules will be simulated and used to generate a testable model of mitochondrial involvement in AD development, thus suggesting new potential therapeutic targets.
Figure 5 shows a simplified version of the model used to assess various aspects of mitochondrial function, specifically patterning oxidative stress, electron transport chain function, and mitochondrial biogenesis that were identified as areas of importance by our gene expression analysis. The function of these as well as other associated enzymes, proteins, and cofactors were then assessed using biochemical systems theory and kinetic modeling. For the initial studies with the mathematical model, genes assessed by RT2-PCR array with fold-changes greater than 2.0 and with multiple occurrences in IPA-identified diseases/functions and pathways were used. These genes are shown in Table 8. For the genes examined by qPCR, those with fold changes of 1.4 or greater were initially chosen; however, since SOD2 had a qPCR change close to 1.4 and it had the highest fold change from the array analysis, we included it in our mathematical modeling studies as well. Incorporation of all of the genes identified by qPCR was limited by current research on specific pathway activity as well as by cytoskeletal structure-function and membrane permeability that cannot be mimicked using kinetic modeling. These specific proteins were omitted from the modeling effort. However, additional cell regulators such as PGC1a and FOXO3 were identified as being important for pathogenesis of AD, and these were able to be incorporated into this early model.
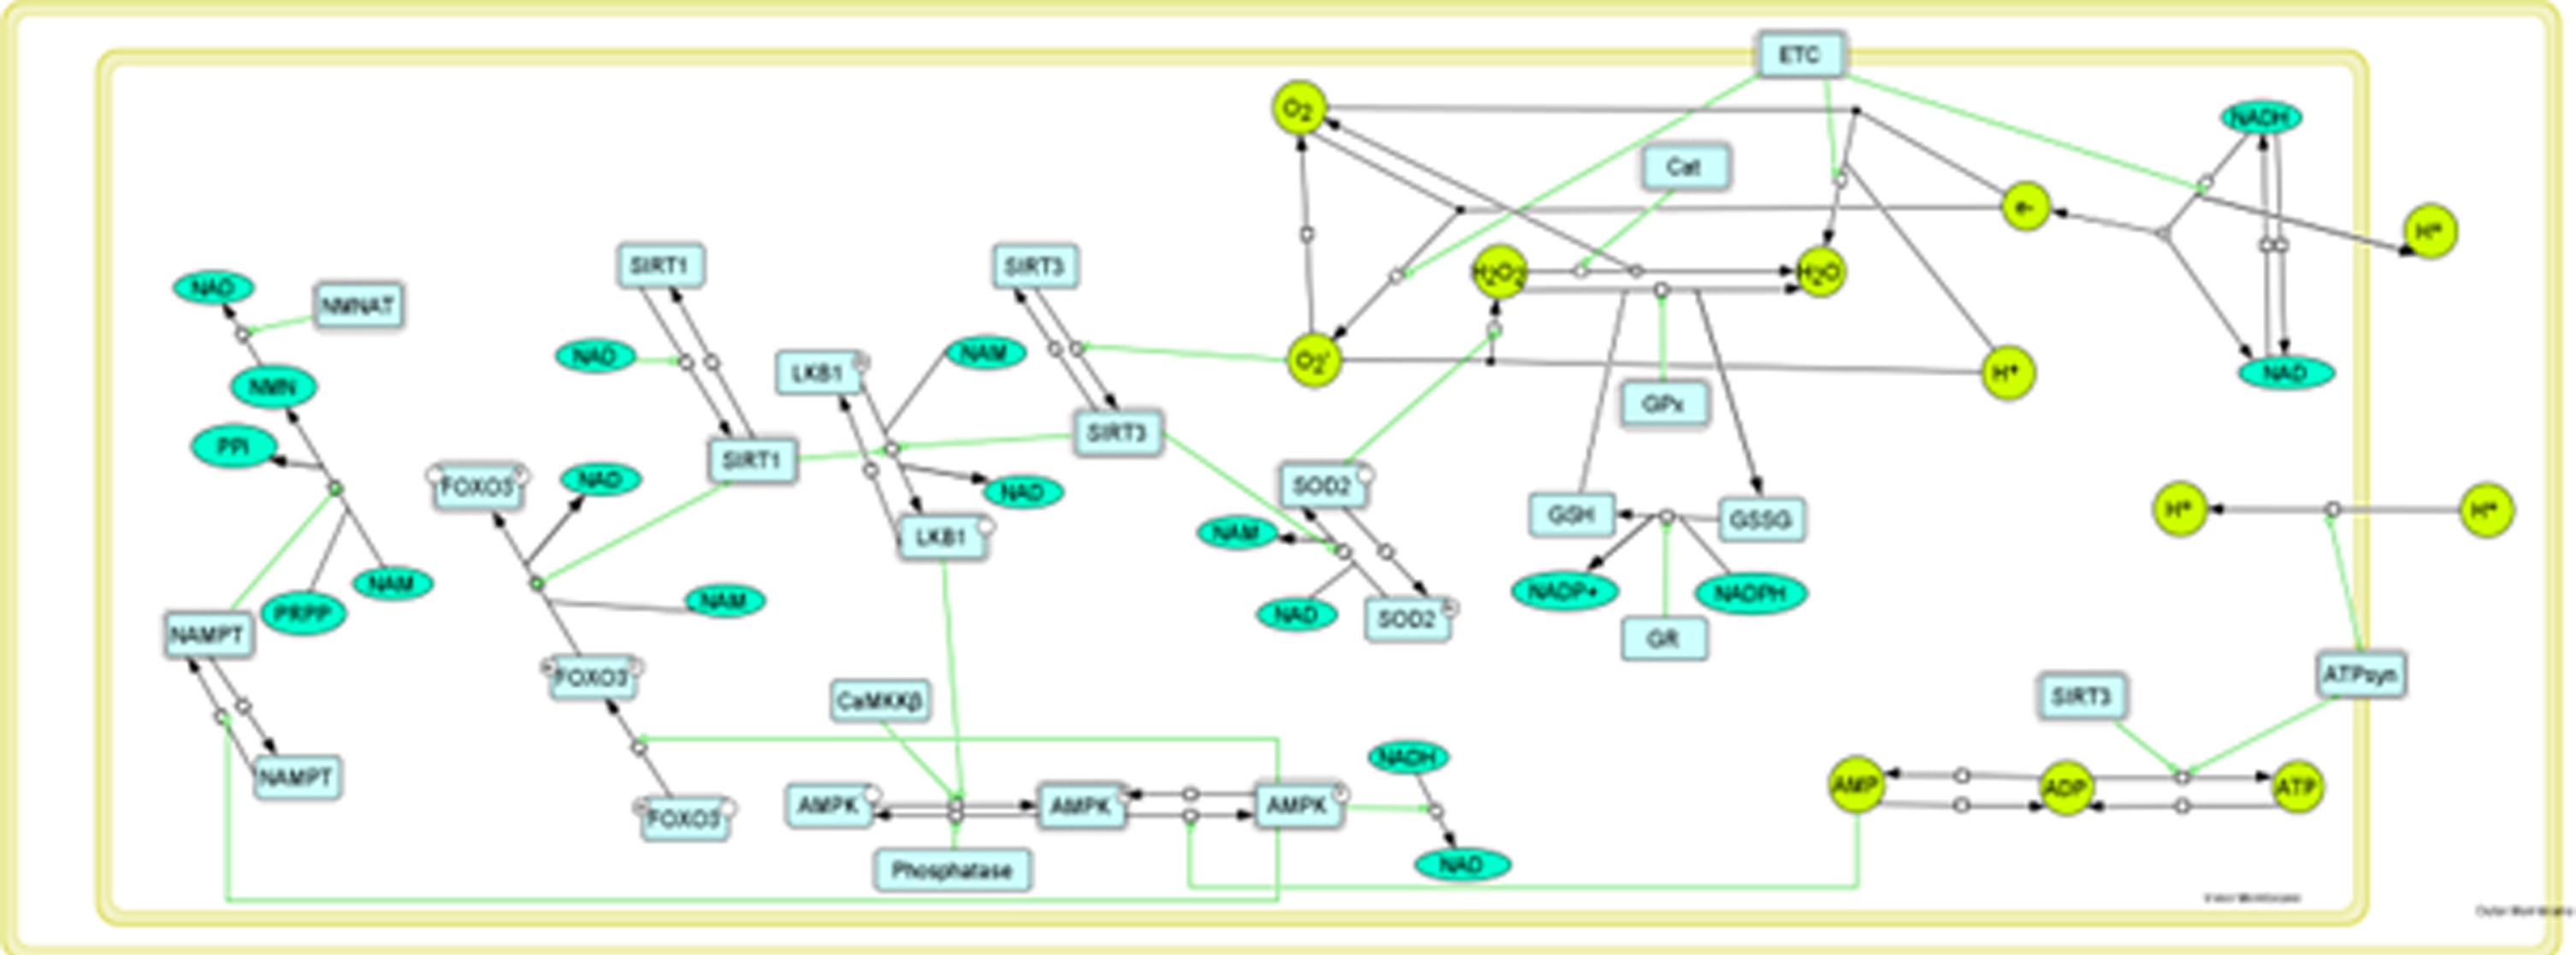
Working model of mitochondrial function based on qPCR data. Green ovals represent metabolites and lime green circles represent molecules and radicals. Light blue rectangles are enzymes and dashed lines around rectangles indicate an active enzyme, Enzymatic reactions and transport are indicated by black arrows. The small open squares within a black arrow indicate anchor points for including potential modifications for that reaction (inhibition, etc.). Green lines with open circles at their end indicate stimulation of a reaction. Black lines without arrowheads represent connections to cofactors or co-reactants.
Comparison of RT2-PCR array and individual qPCR analyses
aTheTP53 and OPA1 genes are highlighted in red font to emphasize the change in expression from down- to upregulation when comparing results from PCR arrays to qPCR analysis. *These genes marked by asterisks were not identified by RT2-PCR array analysis but were implicated by molecular model analysis and subsequently assessed by individual qPCR.
We confirmed the RT2-PCR array assessed gene expression data for these nine genes using individual quantitative PCR (qPCR). These data are summarized in Fig. 6 and Table 8. Seven of the nine genes identified in this study showed the same direction of change in expression (up or downregulated) when the results from PCR array analysis were compared to individual gene assessment by qPCR, although the extent of the changes varied. SOD2 and CDKN2A were found to be upregulated (1.32 and 1.57-fold, respectively) by qPCR as they were in the RT2-PCR array analysis. Likewise, GAPDH, MFN2, DNM1L, FIS1, and BNIP3, all shown by RT2-PCR array analysis to be significantly downregulated, were seen to be downregulated more than 1.4-fold by qPCR. Two of the genes (TP53 and OPA1) showed a contradictory result, with qPCR analysis indicating an upregulation but array PCR showing a downregulation. This 77% correlation between RT2-PCR array gene and individual qPCR analysis is similar to that seen in other studies [34]. Some of the variability of the comparative results from the PCR arrays and the qPCR assays could be due to the composition of the pooled AD and control samples or to the differences in the sequences of primers used in the RT2-PCR arrays and the individual qPCR reactions (see Methods). Interestingly, TP53 has been found to be upregulated in AD [35], which would agree with our qPCR finding. On the other hand, levels of OPA1 have been reported to be significantly decreased in AD [36], which would be in agreement with our array result but not the qPCR result for OPA1.
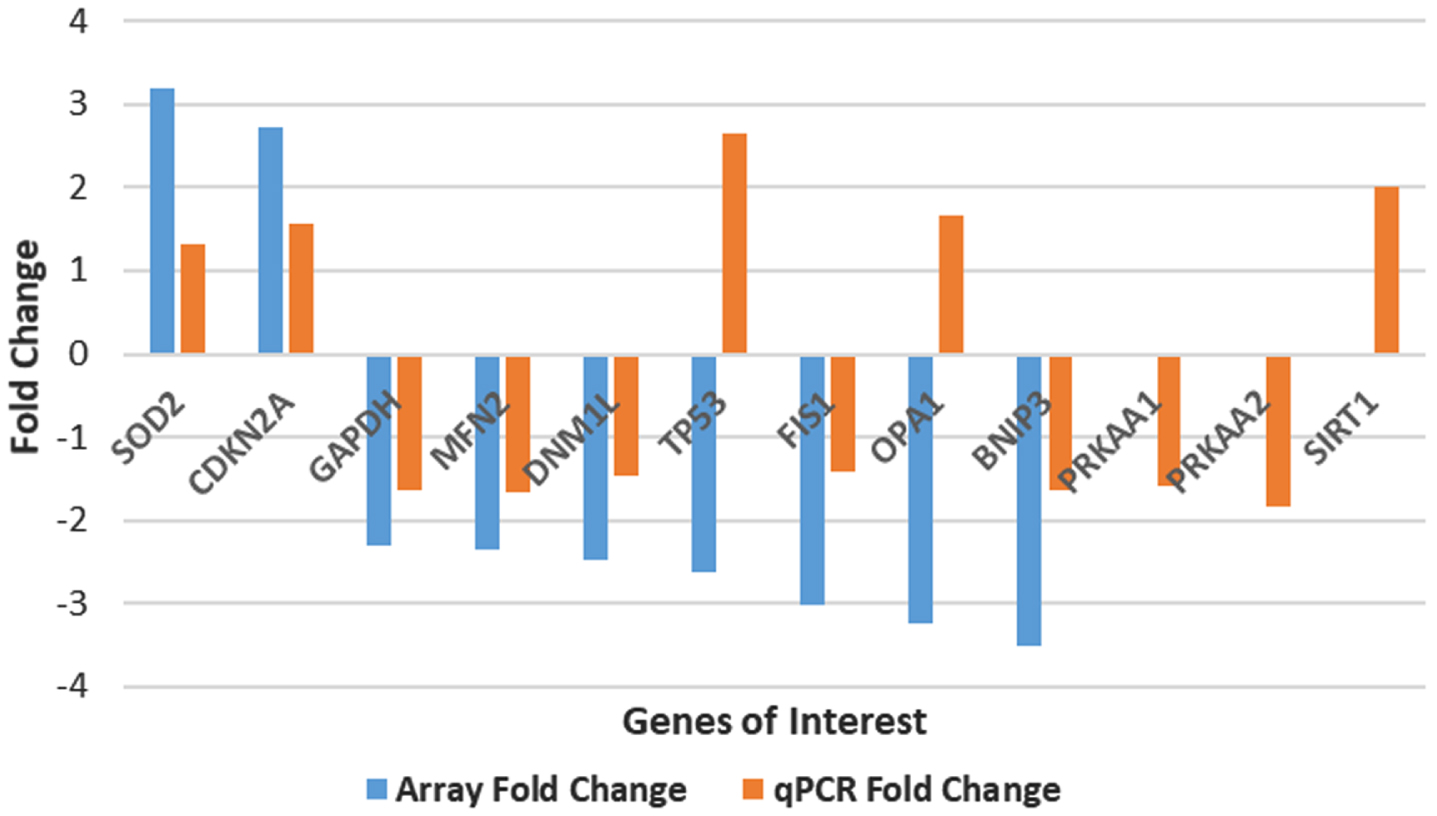
Plot of fold expression changes for 9 genes identified in this study. The blue bars represent the fold change obtained by PCR array analysis. The orange bars represent results from individual qPCR analyses. Three genes not included from our RT2-PCR array analysis are shown in this figure. These three genes—PRKAA1, PRKAA2, and SIRT—were identified as genes of interest from our molecular modeling analysis and thus warranted qPCR analysis.
The last three entries in Table 8 result from qPCR analysis of control and AD brain samples without array data. PRKAA1, which shows a downregulation of –1.59, and PKRAA2, with a downregulation of –1.84, are isoforms of AMPK. AMPK is a regulator that was identified as a potential therapeutic target after inclusion of our gene expression PCR array data into our mathematical model (see accompanying paper by Shelton et al. [33]). Similarly, SIRT1 was included in our qPCR analysis after our gene expression data was incorporated into the mathematical model, and SIRT1 was identified as a potential therapeutic target, with a fold change of 2.01.
Complementary protein evidence that our control- and AD-pools express known pathophysiological markers associated with AD
Although our analysis has focused on RNA and mitochondrial gene expression changes in AD, we undertook some preliminary protein analysis of markers of AD pathophysiology such as Aβ, phosphorylated tau, and MAP2. Our aim was to ensure that such markers would still be detectable and reflect known relationships with respect to levels in AD and control brain samples, some of which have been stored for two decades at –80°C.
Figure 7 shows the results of western blot analysis of protein from control-protein pools and AD-protein pools prepared from the same brains used to generate the control- and AD-RNA pools. As can be seen, Fig. 7A shows the detection of Aβ, phosphorylated tau, and MAP2 by western blot of proteins in the control (C) and AD (AD) sample pools. Figure 7B is a graphical representation of the protein expression related to the protein band density as determined by the Odyssey CLX. After normalizing to the β-actin loaded in each lane, the Aβ is found to be upregulated by 1.94-fold in AD compared to control, the phosphorylated tau is found to be upregulated by 2.33-fold in AD, and MAP2 is downregulated by 1.96-fold in AD. These changes in expression are consistent with reports in the literature [37–39]. The raw data for Fig. 7 is included as Supplementary Figure 1.
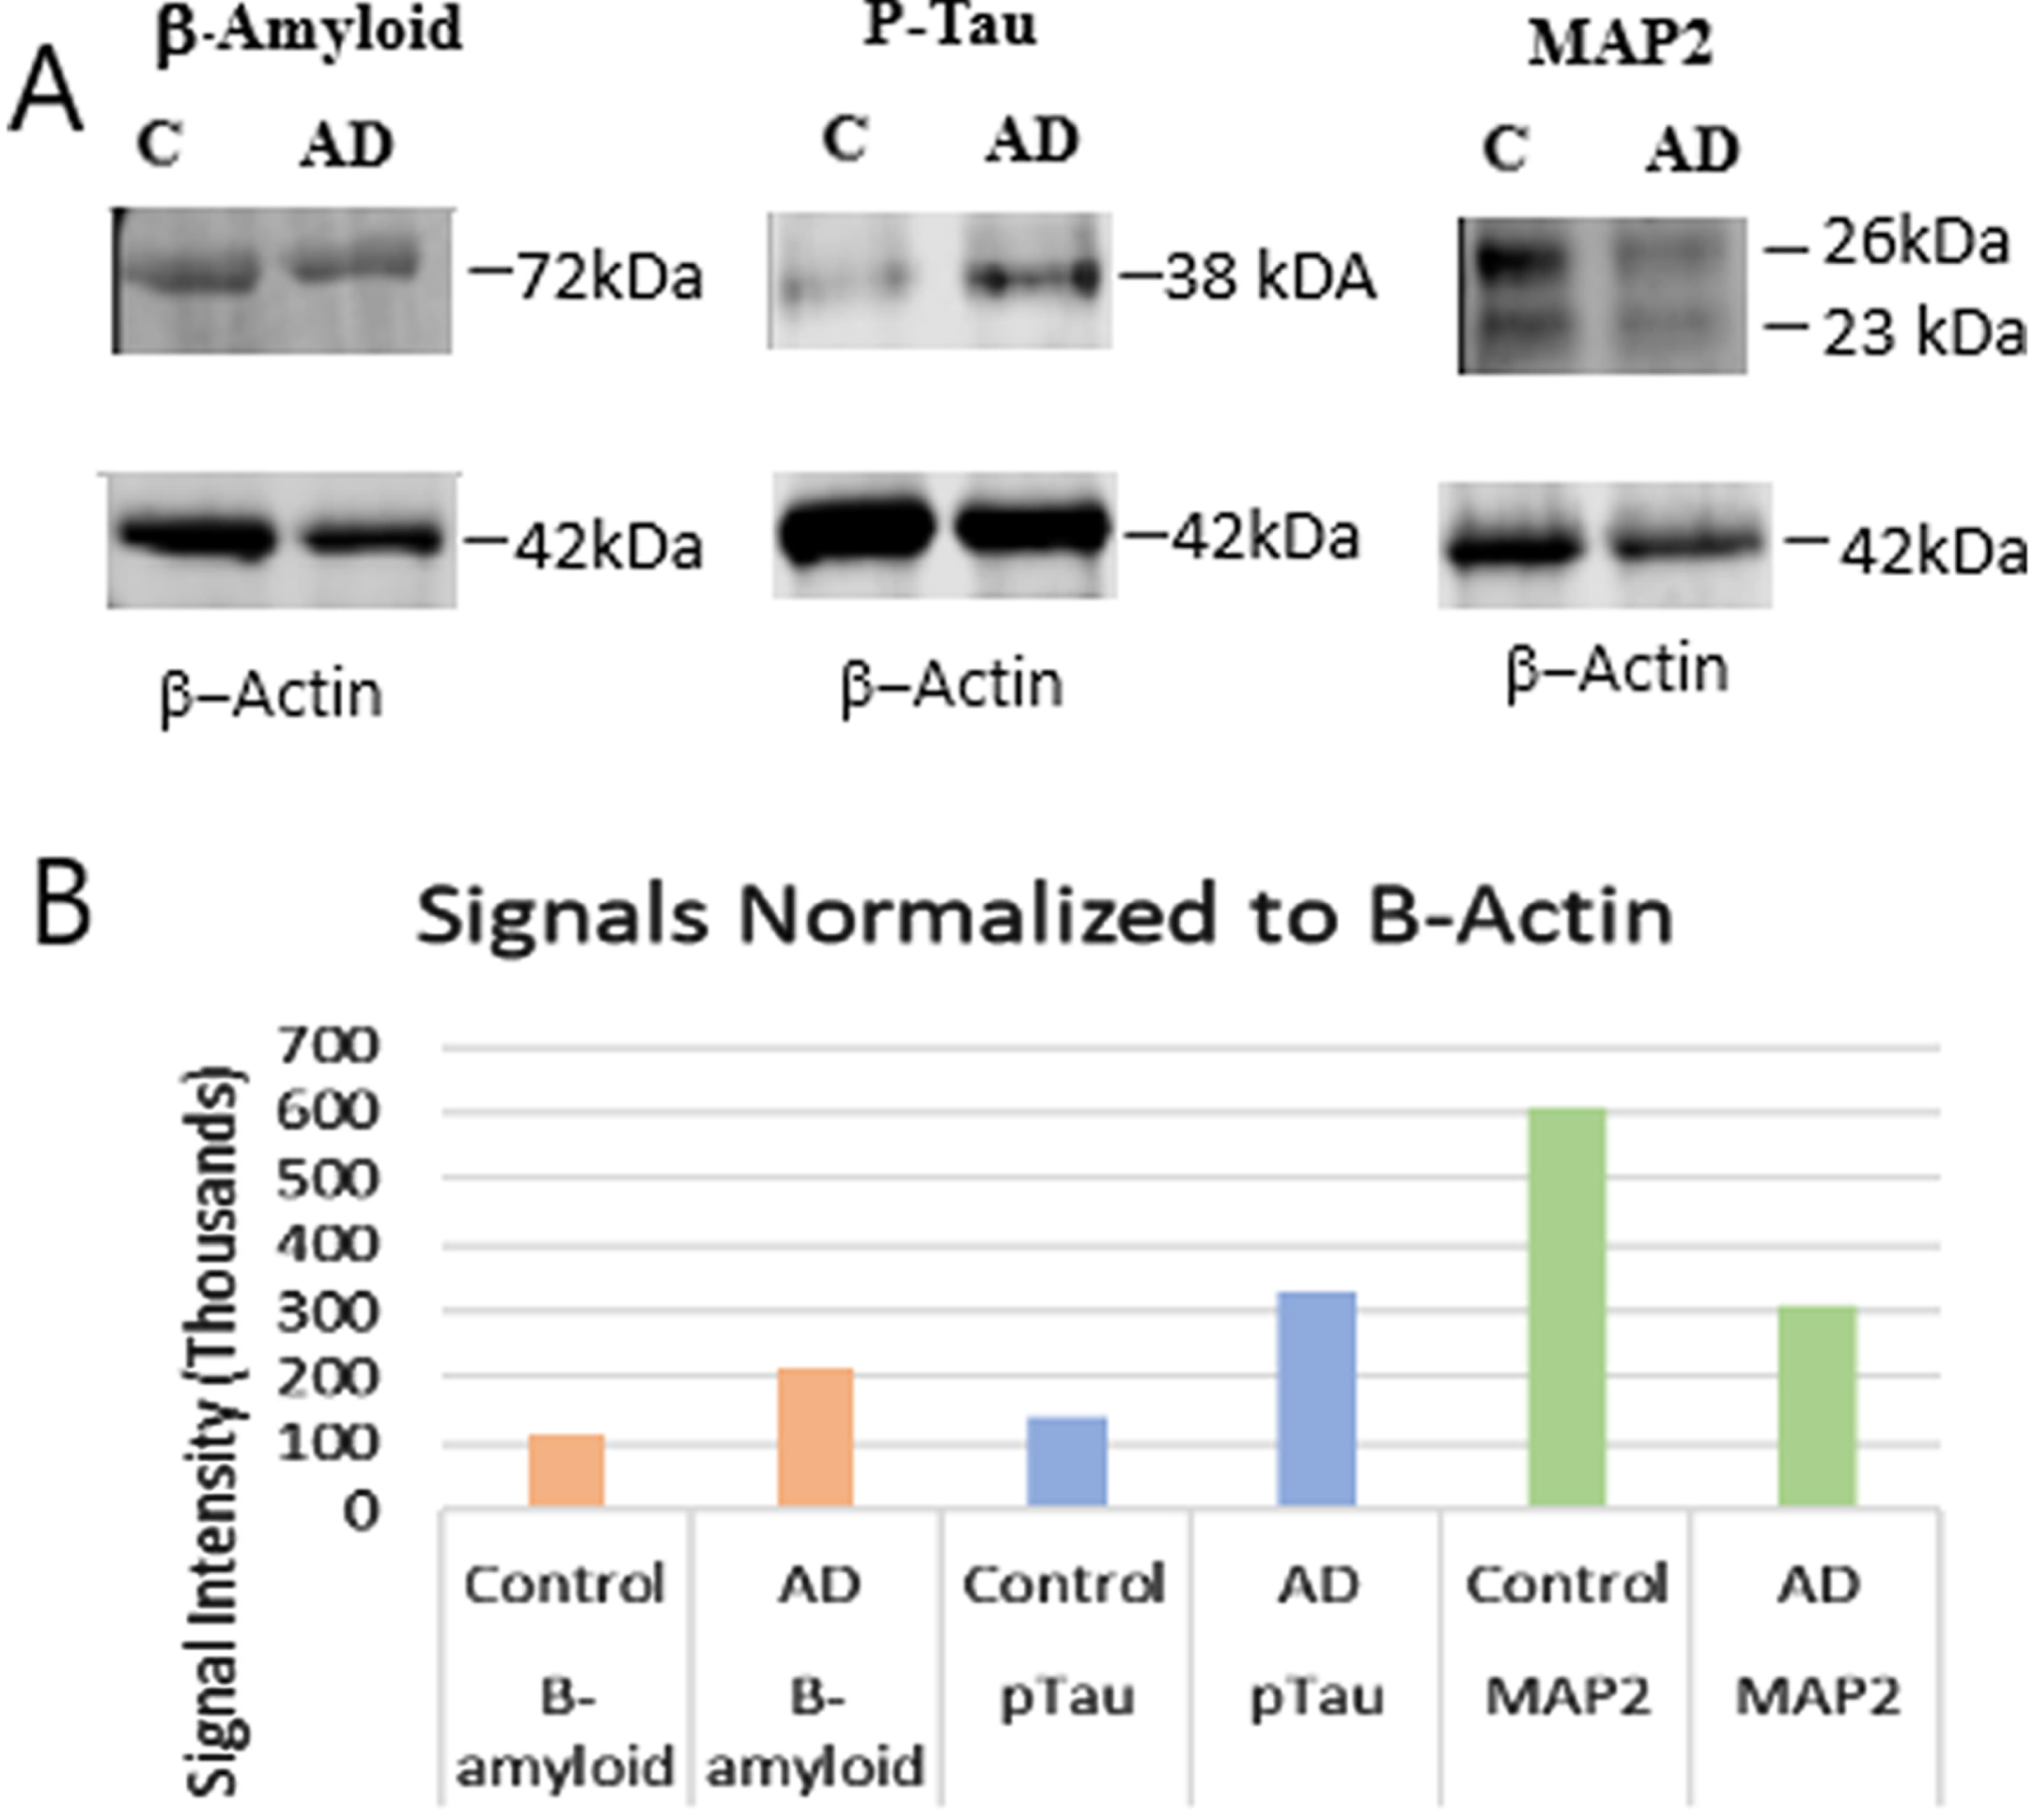
Western blot analysis of several pathophysiologic markers for Alzheimer’s disease. A) Detection of amyloid-β, phosphorylated tau, and MAP2. B) Graphical representation of the different densities of protein bands in the control and AD samples. Amyloid-β and P-tau are upregulated in the AD samples while MAP2 is downregulated in the AD samples.
DISCUSSION
Using RT2-PCR arrays probing nuclear encoded genes related to mitochondrial biogenesis, we originally found 22 genes in AD brain samples that showed differential gene expression relative to that in age- and gender-matched control samples. Three of these were upregulated (one with p < 0.05) and 19 were downregulated (16 with p < 0.05). We subsequently used several software analysis programs to identify biological processes and functions impacted by these genes. These results, combined with individual qPCR analyses, allowed us to filter the data set to 9 genes—TP53, DNM1L, MFN2, FIS1, SOD2, CDKN2A, OPA1, BNIP3, and GAPDH—involved in mitochondrial biogenesis in AD brains. These genes are differentially expressed and repeatedly associated with biological or disease processes linked to AD. This is the first report of this limited set of nuclear encoded mitochondrial genes being linked together to AD. The expression changes of this group of genes reflect the multifaceted changes in mitochondrial biogenesis that occur during development of AD, changes that affect mitochondrial membrane potential, morphology, permeability, fusion, fission, apoptosis, and subsequent neurodegeneration and neuronal cell death.
This gene set was found to be among the genes linked to several canonical pathways including the sirtuin signaling, apoptosis, and mitochondrial dysfunction pathways. Sirtuins or SIRTs are class III histone acetylases that use NAD+ as a co-substrate for their enzymatic activities [40]. There are 7 sirtuin members in mammals and these play important roles in aging, metabolism, cancer, inflammation, and cellular responses to stress. SIRT3 and SIRT4 are located within the mitochondrial matrix, and SIRT5 is found within the mitochondrial intermembrane space [41, 42]. SIRT3 directly influences SOD2 [43], which is strongly upregulated in our dataset. This upregulation will stimulate SOD2 to convert superoxide free radical into water and hydrogen peroxide (H2O2) helping to detoxify reactive oxygen species (ROS) formed in the mitochondrion. Likewise, the intermembrane associated SIRT5 interacts with SOD1 [44] to stimulate further ROS detoxification. SIRT1, on the other hand, is predominantly located in the nucleus, although it can translocate between the nucleus and cytoplasm in certain cell types [45]. It has been reported that overexpression of SIRT1 in mice reduced Aβ levels via activation of ADAM metallopeptidase domain 10 transcription with resulting upregulation of alpha-secretase processing of APP while deletion of SIRT1 increased Aβ levels [46].
The second most significant canonical pathway, with a p-value of 7.21×10⁻¹⁶, is that of HIV-stimulated apoptosis. The primary genes up- or downregulated in this HIV-linked pathway are Bid, tBID, BCL-XL, BAK, ANT, p53, and PUMA (all downregulated) and BCL-2 (upregulated). Examination of the apoptosis signaling pathway shows a similar group of genes—Bid, tBID, BCL-XL, BAK, and p53 being downregulated and the BCL2 being upregulated—clearly demonstrating the association of these mitochondrial genes to the general pathway of apoptosis signaling, absent induction by HIV. The central role of mitochondria in apoptosis has become increasingly realized since the early work of Wang and others [47]. Changes in mitochondrial membrane permeability that could destroy the electrochemical gradient across the mitochondrial inner membrane would compromise the synthesis of ATP and signal significant mitochondrial distress and dysfunction. This in turn can lead to the release of cytochrome c as well as apoptosis-inducing factor (AIF), endonuclease G, and other factors from the mitochondria into the cytoplasm where they can act to stimulate caspase activity (cyt c) or nuclear DNA degradation (AIF, endoG). In the cytosol, cytochrome c interacts with Apaf1 to form the apoptosome that activates caspase 9 to begin the caspase cascade leading to nuclear DNA degradation. It is of interest that a number of the genes in our data set have been linked to apoptosis and, therefore, via this study, to AD. These include FIS1 [48], MFN2 [49], DNM1L [50], and OPA1 [51], all four of which play important roles in maintaining the dynamic balance of mitochondrial fission and fusion; the tumor suppressor TP53 [52]; the reactive oxygen scavenging SOD2 [53]; the membrane associated and important glycolytic enzyme GAPDH [54]; and BNIP3 [55].
Finally, there is a strong non-random association of our dataset with mitochondrial dysfunction (p = 5.41×10⁻⁶). CPT1, MIRO2, UCP2, FIS1, and the Cytochrome c Oxidase respiratory complex are significantly downregulated while the mitochondrial SOD2 and BCL2 are upregulated in this canonical pathway. Our data herein also finds that SOD2 is strongly upregulated and FIS1 is downregulated.
There were three diseases most significantly associated with our set of genes. These were neurological disease, organismal injury, and metabolic disease. Each of these diseases can impact a variety of biological functions or processes to either increase or decrease the effect of these processes/functions. Death of brain cells and cortical neurons and apoptosis of brains cells were associated also with mitochondrial disorders and amyloidosis, all linked to development of neurological disease and, ultimately, to AD.
The primary functions affected by the differentially expressed genes in our data set were related to mitochondrial protein trafficking, morphology, and transmembrane potential as well as neuronal cell death. These biological functions are regulated by a variety of transcriptional and growth factors. A number of potential regulators involved in these functions are affected by or are affecting the expression of genes in our dataset. If regulators are grouped according to the p-values related to the association between those regulators and our dataset, there are 5 top regulators associated with these biological functions, and these are shown in Table 9.
Top upstream regulators by p-value
Four of these are transcription regulators—FOXO1 (Forkhead box 01), a member of the forkhead family of transcription factors; TP53, a tumor suppressor protein; RB1, retinoblastoma transcriptional corepressor 1 that negatively regulates the cell cycle; and PGC-1A, peroxisome proliferative active receptor gamma, coactivator 1 alpha, a transcriptional coactivator that regulates genes involved in energy metabolism. LEP or leptin is a growth factor that, in addition to playing a major role in regulation of body weight, is involved in regulation of the immune and inflammatory responses.
In addition to its role in glucose metabolism, FOXO1 plays an important role in apoptosis [56], particularly in the intrinsic mitochondrial pathway [57]. Interestingly, multiple genes in our dataset are associated with activated FOXO1. Twenty-two of these are downregulated while 7 are upregulated. Activated FOXO1 strongly upregulates two regulators—SOD2 and CDKN2A—that are key members of our data set. A polymorphism in the gene for SOD2 is associated with an increased risk of developing AD [58]. Recently, it has been shown that exogenously added Aβ142 oligomers leads to upregulation of SOD2 in microglial cell lines [59]. An increased expression of SOD2 was found to decrease superoxide accumulation and prevent memory loss in a mouse model of AD [60]. In concert with these earlier observations, the increase in SOD2 expression seen here would reflect a cellular response designed to increase survival of the affected neuronal cells in an effort to mitigate the ongoing neurodegeneration associated with AD.
CDKN2A, the cyclin-dependent kinase inhibitor, is a strong inhibitor of CDK4 and a regulator of cell cycle G1 progression, thereby also serving as an important tumor suppressor [61]. Immunohistochemical analysis has shown an increased level of CDKN2A in the brain and lymphocytes of a transgenic mouse model of AD [62]. We report here that gene expression of CDKN2A is upregulated, similar to our observation of SOD2 upregulation. The latter is most likely as a survival response to increasing ROS accumulation as mitochondrial function degenerates and the former, paradoxically, is most likely as a response to or instigator of disrupted cell cycle control. AD involves dysfunction in neuronal cell cycle reentry, which has led to the development of the two-hit hypothesis of AD. The first hit is abnormal cell cycle reentry, which typically results in neuronal apoptosis and prevention of AD. However, with the second hit of chronic oxidative damage preventing apoptosis, neurons gain “immortality” analogous to tumor cells. Once both hits are activated, AD can develop and produce senile plaques and neurofibrillary tangles throughout brain tissue [63].
In a similar way, activated TP53 is linked to the downregulation of 16 genes in our dataset, with a very strong inhibition of the transcriptional regulator PGC-1A. PGC-1A is a master regulator of mitochondrial biogenesis [64, 65], interacting with cAMP response element-binding protein (CREB) [66] and nuclear respiratory factors (NRFs) [67]. However, the reduction in expression of TP53 seen in our RT2-PCR array study would lead to increased levels of PGC-1A that in turn leads to the downregulation of seven genes in our data set associated with mitochondrial membrane potential uncoupling and apoptosis. Interestingly, PGC-1A has been suggested to be a therapeutic target for early intervention in another neurodegenerative disease, Parkinson’s disease [68].
Just as disrupted cell cycle regulation has been implicated in AD, disturbance of mitochondrial dynamics involving organelle fission and fusion may also play a role in AD pathogenesis [69]. However, the picture here is unclear. In mammalian cells, fusion is coordinated by the outer mitochondrial membrane-located mitofusin (MFN) 1, MFN2, and optic atrophy 1 (OPA1), located on the inner mitochondrial membrane, in separable sequential events [70, 71]. Fission, on the other hand, begins with outer mitochondrial membrane constriction at mitochondria-endoplasmic reticulum contact sites before the oligomerization of Drp1 (DNM1L). Several mitochondrial-bound proteins then aid in the recruitment of Drp1 to the mitochondria, including FIS1 [72]. Recent evidence demonstrates, in fact, that FIS1 promotes mitochondrial fragmentation both by activating fission and inhibiting fusion [73]. Early work on AD brain tissue revealed reduced levels of Drp1, OPA1, and Mfn2 with increased levels of FIS1 [36]. Contrary to this observation, Drp1 was reported to be upregulated in the cortex of Tg-AD mice after exposure to Aβ oligomers [59]. In our study, FIS1 is found to be downregulated.
Dysregulation of mitophagy, autophagy, and cell death is also associated with the development of AD. The mitochondrial protein BNIP3 is a primary contributor to these phagocytic processes. When BNIP3 dimerizes, it inserts into and alters the permeability of the mitochondrial outer membrane allowing release of several cytotoxic proteins into the cytoplasm [74]. BNIP3 has been found to be downregulated after 2 days of an ischemic event in a study of ischemia as a model for AD [75]. We also find BNIP3 to be strongly downregulated in our AD brains.
In total, the nine genes identified in this study are linked to changes in membrane potential and permeability and mitochondrial morphology via organelle fission and fusion, leading to mitochondrial dysfunction, apoptosis, amyloidosis and, ultimately, neurodegeneration, neuronal cell death, and AD. Figure 8 shows the interactions between members of our gene dataset when participating in the most affected biological networks and how these affect AD and associated conditions, such as neuronal cell death, morphological and transmembrane changes, and others.
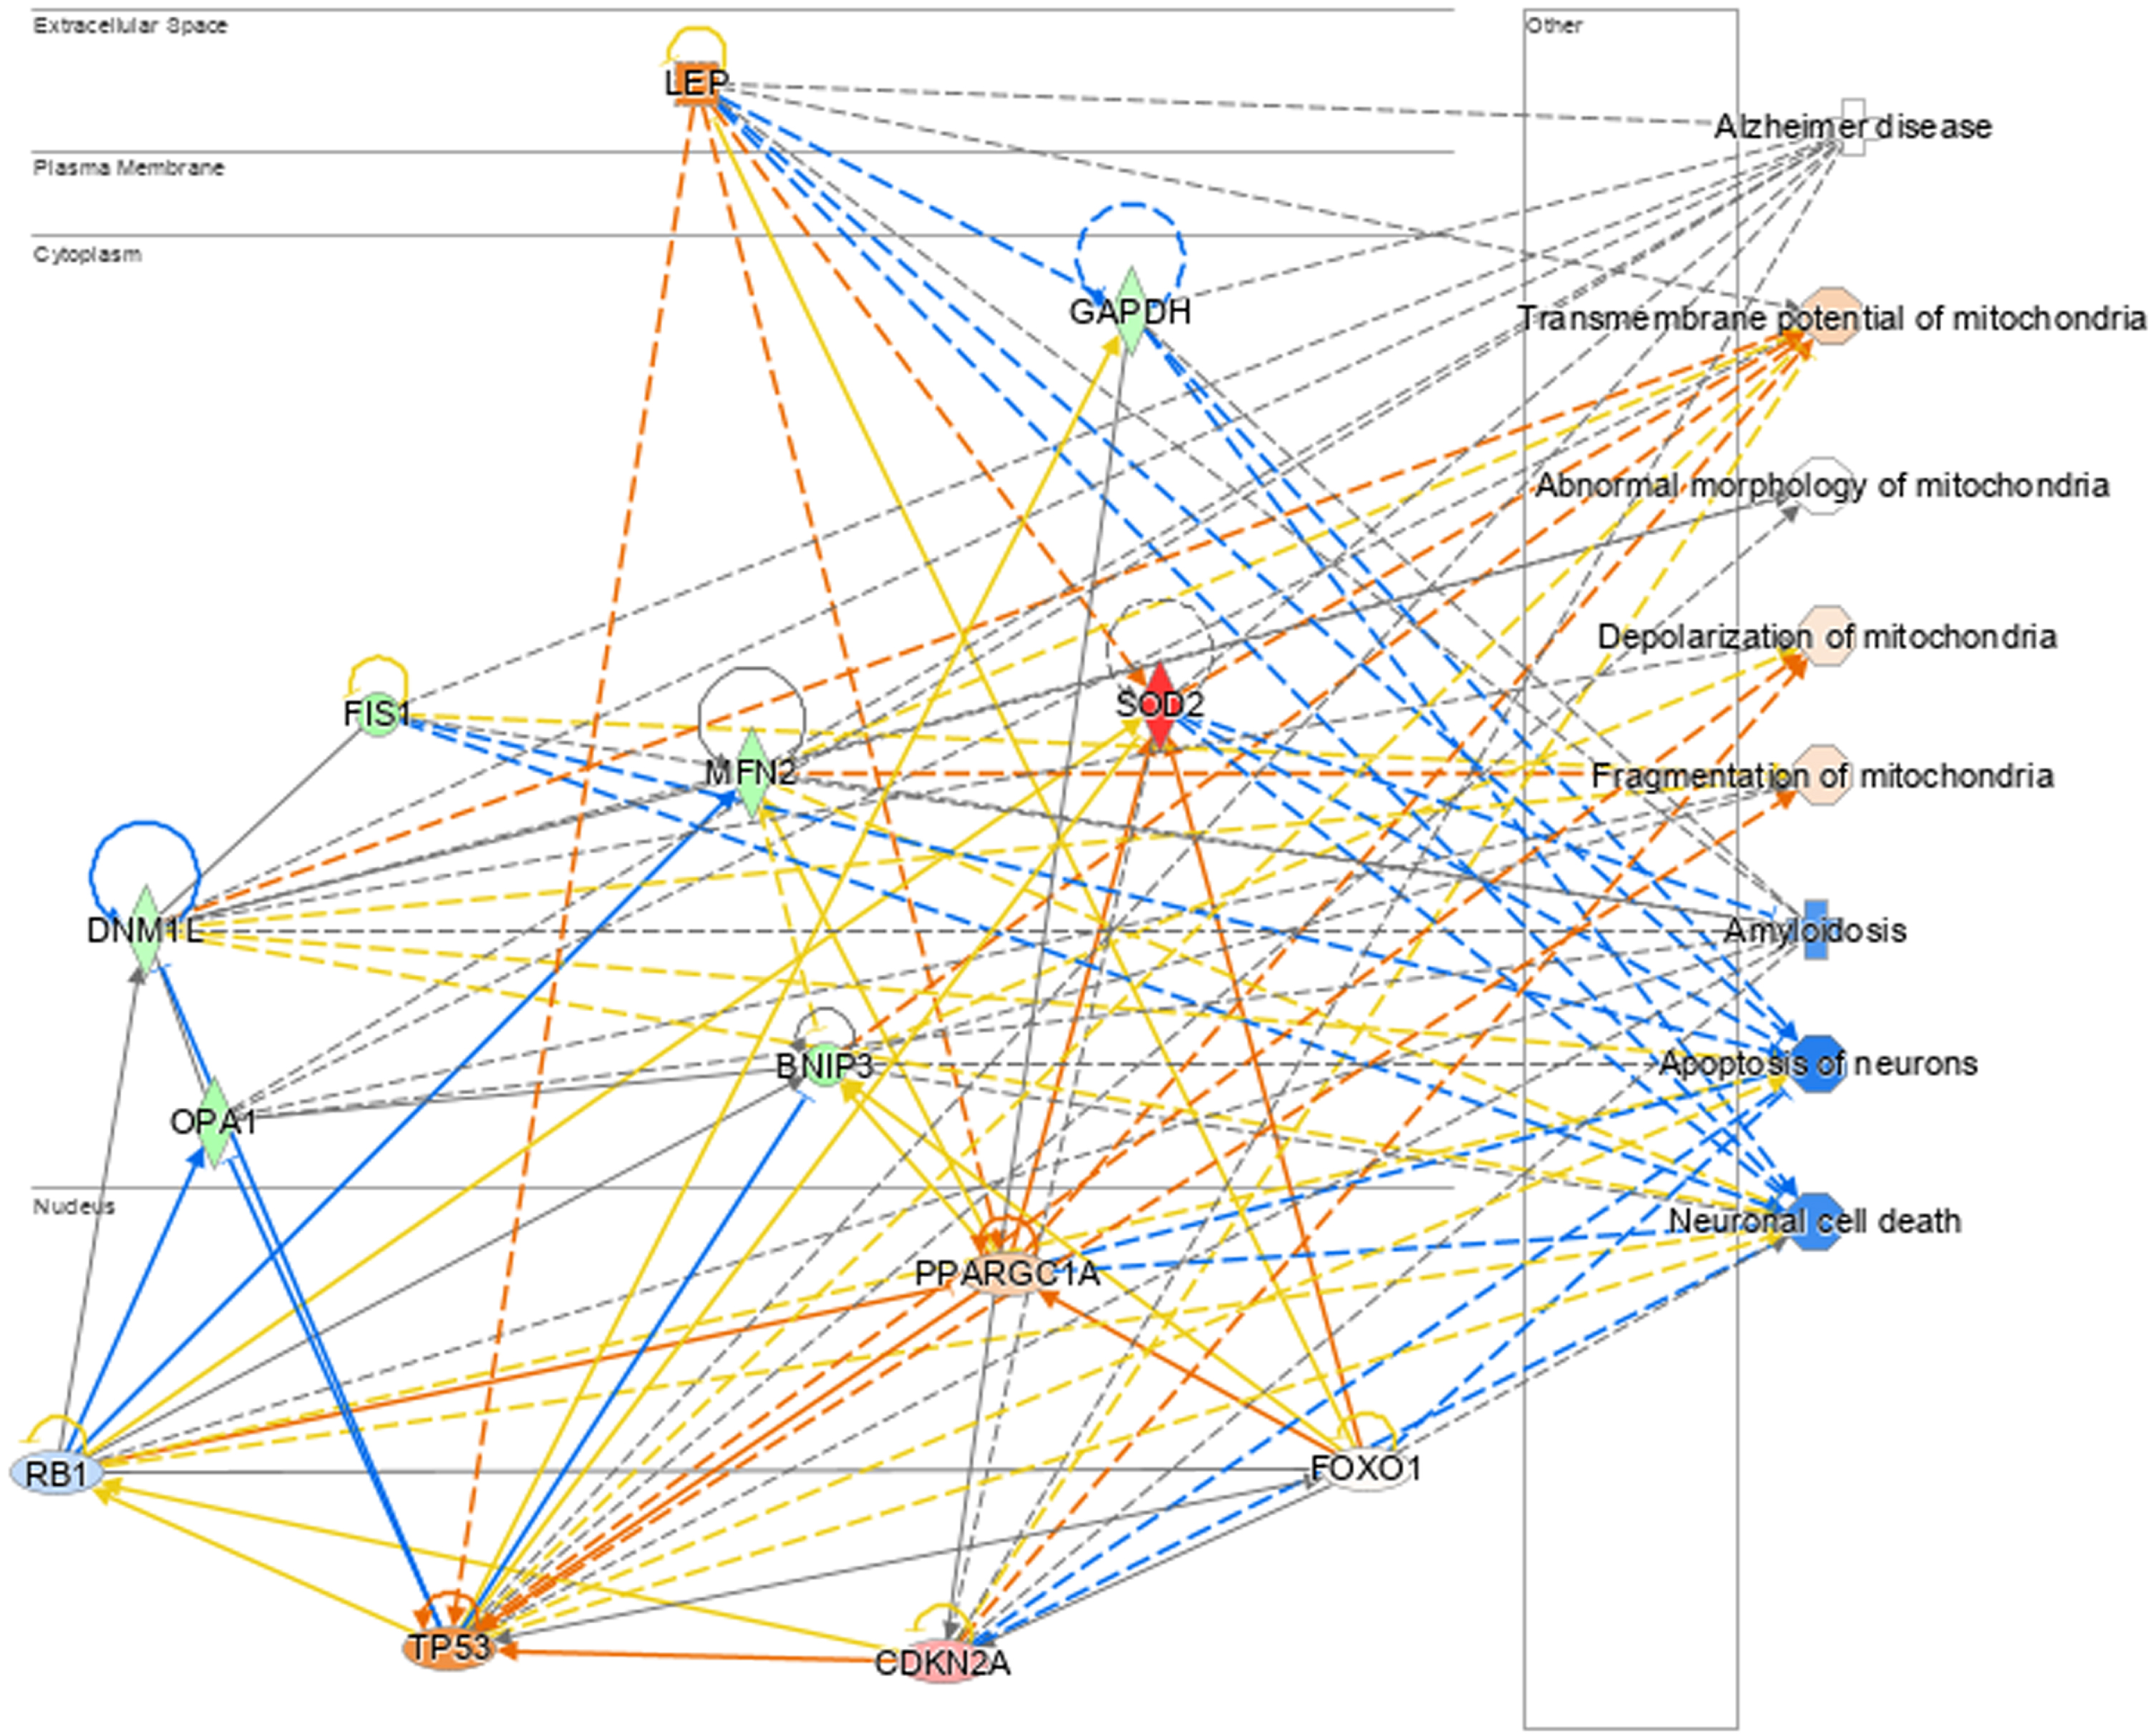
Association of the 9 genes of interest and several top upstream regulators to aspects of mitochondrial dysfunction and AD.
Finally, when these gene expression data are imported into a mathematical model under construction by our team, new and interesting genes that may represent therapeutic targets (such as AMPK and SIRT1) are identified. After model completion, computational manipulation will be carried out using COPASI and the kinetic principals described by systems biology mass action laws. The system will be analyzed in a diseased and baseline state to identify potential therapeutic targets. These targets will then be simulated to predict treatment efficacy before further in vitro testing. A full description of the model construction and its application incorporating this gene expression data are reported in an accompanying paper by Shelton et al. [33].