
Abstract
Background:
Alzheimer’s disease is a specific form of dementia characterized by the aggregation of amyloid-β plaques and tau tangles. New research has found that the formation of these aggregates occurs after dysregulation of cellular respiration and the production of radical oxygen species. Proteomic data shows that these changes are also related to unique gene expression patterns.
Objective:
This study is designed to incorporate both proteomic and gene expression data into a testable mathematical model for AD. Manipulation of this new model allows the identification of potential therapeutic targets for AD.
Methods:
We investigate the impact of these findings on new therapeutic targets via metabolic flux analysis of sirtuin stress response pathways while also highlighting the importance of metabolic enzyme activity in maintaining proper respiratory activity.
Results:
Our results indicate that protective changes in SIRT1 and AMPK expression are potential avenues for therapeutics.
Conclusion:
Combining our mitochondrial gene expression analyses with available protein data allowed the construction of a new mathematical model for AD that provides a useful approach to test the efficacy of potential AD therapeutic targets.
INTRODUCTION
Alzheimer’s disease (AD) is characterized by the aggregation of neurofibrillary tangles and amyloid plaques [1, 2]. However, cell death and impairment of mitochondrial respiration can be seen before aggregate accumulation [1, 3–5]. Current research suggests that the mitochondria play a significant role in risk and onset of dementia [1, 6]. These findings produced the Mitochondrial Cascade Hypothesis which proposes that genetics determine the efficiency of cells’ respiratory complexes. To further investigate this theory, we conducted early work with qPCR showing that there are differences in mitochondria-related gene expression in patients with AD compared to patients without the disease. These differences in gene expression become more apparent with age as the mitochondria in the brain are more prone to damage from oxidative stress [7]. Over the decades, there is an increasing occurrence of electron leakages across the inner membrane leaving the mitochondria more susceptible to oxidative damage from the accumulating radical oxygen species (ROS) [8, 9]. Continual impaired energy production ultimately increases ROS concentrations and changes cellular signaling by activation of Sirtuins (SIRTs) and AMP kinases (AMPKs) [2, 11]. These signaling cascades ultimately alter transcription of antioxidant and autophagic genes via transcription factors Forkhead Box O3 (FOXO3) and Peroxisome proliferator-activated receptor gamma coactivator 1-alpha (PGC1α) [12]. By comparing AD and control transcriptomes and proteomes, we can identify changes related to AD progression. Our analysis of autopsy-confirmed human brain samples of AD via gene expression and in silico modeling indicate that the pathways related to the changes in cellular steady state, defense, and energy production are altered.
Our proposed mitochondrial model focuses on how oxidative stress, the initial antioxidant defense system, and induction of secondary response cascades can alleviate cellular stress from excessive ROS production during the progression of AD. Through careful analysis, we propose two possible therapeutic targets— SIRT1and AMPK— for in vitro AD analyses.
MATERIALS AND METHODS
Sample acquisition
Autopsy-confirmed brain samples were kindly supplied by the following: Dr. W.W. Tourtelotte of the National Neurological Research Specimen Bank (NNRSB), VAMC, Los Angeles, CA 90073. Tissue/fluid specimens obtained from the NNRSB, are sponsored by NINDS/NIMH, National Multiple Sclerosis Society, Hereditary Disease Foundation, Comprehensive Epilepsy Program, Tourette Syndrome Association, Dystonia Medical Research Foundation, and Veterans Health Services and Research Administration, Department of Veterans Affairs; Dr. Peter Davies of the Department of Pathology at Albert Einstein College of Medicine, New York, NY; Dr. Deborah C. Mash, University of Miami Brain Endowment Bank, Miami, FL.
Brain mRNA isolation
RNA was isolated from age-matched, autopsy-confirmed AD (n = 11) and control (n = 6) brain samples originating from the parietal cortex. Age-matched brain samples taken from the parietal cortex of 17 samples: 6 controls and 11 AD autopsy brain samples, average ages of 75 and 74, respectively. Total RNA was isolated from 80–100 mg frozen autopsy brain samples using RNeasy Plus Universal Mini kits per manufacturer’s instructions.
RNA assessment
The integrity and purity of the isolated RNA was determined by absorbance spectroscopy and agarose or capillary gel electrophoresis. Capillary electrophoresis was performed on an Agilent Bioanalyzer using a Nano II total RNA kit. Capillary electrophoresis assesses the quantity, size and integrity of the mRNA and is used to calculate an RNA integrity number (RIN).
Mitochondrial biogenesis gene expression analysis
The Qiagen RT2 PCR Profiler PCR Array consisting of 12 controls and 84 nuclear encoded genes involved in mitochondrial biogenesis was used for gene expression analysis. Relative changes in SYBR green fluorescence were used to assess levels of gene expression using a BioRad CFX96 thermocyler and web-based Qiagen software. Based on expression change values and network and pathway associations, a filtered group of nine genes were selected for input into the mathematical model.
Power calculations and sample size
Based upon results from our prior RT2 Profiler PCR Array analysis of AD and control brains, we found that the average fold-change in expression of the nine selected genes included in the model building was 2.83-fold in absolute value, reflecting both up- and downregulation of individual genes. A continuous endpoint, two independent sample study with a mean of 1±1.5 for control brain fold-regulation and an average % change of 183% in the selected genes for the AD group was used. A minimum sample size for adequate study power was determined to be 17 (6 control and 11 AD brains) with an alpha of 0.07 and a power of 0.8, using a sample size calculator from ClinCalc.com.
Due to limited availability of a number of our samples, separate pools of control-RNA and AD-RNA were generated for qPCR analysis. Thus, statistical analysis of results from individual brain samples was not possible. The RT2 PCR Array analysis and all qPCR reactions were performed in triplicate.
AD mathematical model creation
The model was created in CellDesigner 4.2 and was converted into a series of mathematical equations by SBMLsqueezer [13]. Analysis was done in COPASI, a biological pathway simulation program [14]. Every arrow within the model is represented by a “flux equation.” Formation of a species results in a positive flux value while depletion of a species yields a negative flux value. If the reaction is enzyme catalyzed, then the equation takes the form of a Michaelis-Menten (M-M) equation. When the reactions are not enzyme catalyzed, they are represented by a simple mass action equation. For reactions with more than one substrate, the M-M equation is modified to accommodate a second substrate assuming a random order mechanism (Equation 1). These equations and others defined are combined to form a series of flux equations that describe the entire reaction as defined by Systems Biology kinetic laws [15]. Model equations can be found in Supplementary Material 1.
Model species concentrations
Concentrations (μM) of proteins were calculated using brain tissue specific abundances from the PAXdb [16] and the molecular weights from the UniProt [17] database. If brain tissue specific abundancies could not be found, Uniprot data for Saccharomyces cerevisiae, a common cell model, was used. Metabolite concentrations were taken from the Human Metabolome Database, and parameters from the BRENDA database [18]. After parameter optimization, these values were adjusted to reflect the changes in gene expression identified through RNA assessment in order to mimic cellular activity of a brain affected by aging and AD.
Parameter fitting
To fit parameter values found in the literature to our model, a series of optimization tasks were carried out in COPASI using the Hooke & Jeeves method [19] using in vitro species concentration values in order to fit in vitro rate constants to a smaller theoretical system. Those that could not be found were given an initial value of 0.01 for Km (μM) and 1 for kcat (min–1). Parameter units for kcat and Km are min–1 and μM, respectively. All initial parameters can be found in Supplementary Material 3. These values were later optimized in COPASI to produce parameters within the range of human function and can be found in Supplementary Material 2.
Optimization
While deterministic mathematical models can enhance understanding of biological processes, they are a simplification of complex systems. To reduce potential model bias, standard data collection and processing measures are taken to ensure the best possible representation of the biological system includes utilization of rate constants and protein concentrations determined from in vitro testing whenever possible as well as parameter optimization. Parameter optimization is a series of iterations that adjusts the in vitro rate constants to better fit a smaller model with more limited functions. The computational process of optimization based on cellular function criteria that include NADH/NAD ratios, ATP production, and basal free radical production as seen in normal cells. The rate constant values are randomly adjusted up or down at small increments thousands of times within Copasi until the output remains “fixed” despite further adjustments to the rate constant values. The aim of optimization is to find the best fit of a given parameter set to replicate normal cell function and is unrelated to the later perturbations done within the model to evaluate the impact of AD on cellular activity.
Sensitivity data
A sensitivity analysis (SA) of the model was performed in COPASI to quantify target treatment species. The results are presented as the average percent dependency of a dependent variable’s value on the initial concentration being varied.
Treatment tests
Theoretical treatment efficacy was determined using COPASI’s time course task. Changes in gene transcription, mimicking knockdown treatments, were simulated by adjusting the protein concentration up or down 50%. The efficacy of treatment was calculated as the percent difference from the control using R, version 3.5.2 [20].
Model
Based on the mitochondrial cascade hypothesis [9] and our gene expression studies, we propose that by reestablishing basal mitochondrial function, increasing ATP (adenosine triphosphate) and decreasing ROS production, we can successfully minimize or halt the accumulation of amyloid and tau aggregates.
Model assumptions
In living cells, the NAD/NADH pools are linked by the reduction and oxidation of metabolites, which connects glycolysis in the cytosol to energy production in the mitochondria. These two separate pools have differing NAD/NADH ratios to facilitate normal compartment activity, regulate energy production within the mitochondria, and to serve as cofactors in the cytosol. AMPK also regulates the NAD/NADH ratio in the cytosol, as it does in vivo [21]. In this model (Fig. 1), we assumed that the two pools, cytosolic and mitochondrial, were separate and that the mitochondrial changes in the NAD/NADH ratios were only changing in response to respiratory activity, local metabolism and ROS production. Cytosolic NAD/NADH ratios changed in response to AMPK-mediated metabolic changes. ATP consumption was also generalized to hydrolysis of ATP to AMP rather than ADP. Though both do occur, this simplification to only show ATP and AMP levels was done to emphasize how ATP consumption not only provides energy but also serves to activate AMPK through AMP binding.

Diagrammatic representation of the mathematical model for Alzheimer’s disease outlining interactions between electron transport chain activity, radical production, and mitochondrial as well as cellular stress response. Green ovals represent metabolites, light blue circles represent molecules and radicals, and red hexagons indicate ATP or AMP. Purple rectangles are enzymes and dashed lines around rectangles indicate an active enzyme, e.g., Catalase or ETC. Enzymatic reactions and transport are indicated by black arrows. The small open squares within a black arrow indicate anchor points for including potential modifications for that reaction (inhibition, etc.). Green lines with open circles at their end indicate stimulation of a reaction. The open white circles on the edges of the purple rectangles indicate points of post-translational modifications (phosphorylation, acetylation, etc.). Black lines without arrowheads represent connections to cofactors or co-reactants.
Mitochondrial biogenesis is a delicate process facilitating mitochondrial activity through increased antioxidant and mitochondrial subunit expression in response to changes in ATP and ROS production. When energy production cannot be salvaged, persistent oxidative stress places the cell at risk of apoptosis as well as autophagy and mitophagy. This mitochondrial AD model looks at the interactions between more than 40 different proteins predicted to be important to AD progression based on qPCR data and utilizes this information to adjust enzymatic concentrations within the model to better mimic mitochondrial function during AD progression rather than the function of normal, healthier mitochondria. A sensitivity analysis was performed to identify potential therapeutic targets. Viable targets were those that increased the concentration of beneficial cofactors (glutathione, NAD, NADPH), restored the proton gradient, reduced peroxide and superoxide, or increased the activation of PGC1α or FOXO3. Activation of PGC1α and FOXO3 are important for modulating changes in antioxidant gene transcription to restore function in dysregulated mitochondria as well as in modulating autophagic gene transcription to remove terminally dysfunctional mitochondria [22].
RESULTS
Preliminary sensitivity analyses (SA) assess the impact of a 1% change in a single model specie concentration on the other model species and reaction rates and tests all species for the impacts on the entire system. The species with the greatest impact on the model output identified by a 1% perturbation were used as potential therapeutic targets. These species were further evaluated with time course simulations increasing or decreasing specie concentrations by 50% to predict that changes in mitochondria function. Analysis of potential therapeutic targets used two groups of enzymes, mitochondrial and cytosolic.
Mitochondrial targets
This preliminary SA of mitochondrial targets produced three potential targets: ETC, metabolic enzymes, and SIRT3 (Table 1). Theoretical mitochondrial functionality was evaluated by the concentrations of radicals and antioxidant molecules such as NADPH and glutathione dimers (GSSG). The SA of mitochondrial targets (Table 1) also evaluated changes in reaction rates (“Fluxes”) related to formation of peroxide, a marker for inefficient electron capture, as well as GSSG reduction which permits continued antioxidant activity of antioxidant enzyme glutathione peroxidase [23] (See pathway in Fig. 1). If the mitochondria were persistently dysfunctional, transcription factor FOXO3 would be subsequently released to modify gene transcription [24]. This modification can result in either improved oxidative stress response or apoptosis [22].
Scaled SA analysis of the oxidative stress model to perturbations in therapy target species ETC, metabolic enzymes, and SIRT3
The scaled sensitivity assays for our analysis of the effects of oxidative stress on possible therapeutic targets are shown in Table 1. In Table 1,
The mitochondrial target SA analysis (Table 1) predicts that increasing expression of SIRT3 will activate the mitochondrial stress response by triggering FOXO3 export to a greater degree than induction of increased activity of SOD2 (superoxide dismutase 2) and peroxide formation. Export of FOXO3 from the mitochondria leads to beneficial changes in gene expression with minimal impacts on energy production [25]. This is shown in Table 1 by the absence of change in free radical production, an increase in FOXO3 export flux, mild increases in electron capture, and the lack of change in NADH availability. This SA also predicts that treatments affecting ETC concentration and metabolic enzyme concentrations will have opposing effects on NADH availability. ETC concentration will minimally impact NADPH availability and GSSG reduction rates all of which influence the mitochondria’s redox state (Table 1).
Based on this analysis, increasing metabolic enzymes is predicted to increase peroxide formation as well as superoxide concentrations. Increasing peroxide and superoxide results in more oxidative stress within the cell than can be counteracted by antioxidants GSH or NADPH. Furthermore, changes in FOXO3 export are insufficient to lead to adaptive transcriptional changes needed to handle the increasing superoxide load. The increased metabolic enzymes also lead to increased availability of NADH and electron capture demonstrating an unsustainable increase in metabolic activity. Conversely, beneficial decreases in NADH availability, increased electron capture, and minimal change in peroxide formation with ETC treatment shows promise in reducing mitochondrial stress before activating FOXO3.
Therefore, we considered treatments that would beneficially decrease ROS production or activate the stress response system. Our model was then re-evaluated using the following three therapeutic simulations: 50% decrease in metabolic enzymes to reduce mitochondrial stress, 50% increase in SIRT3 and 50% increase in ETC (see Fig. 2).
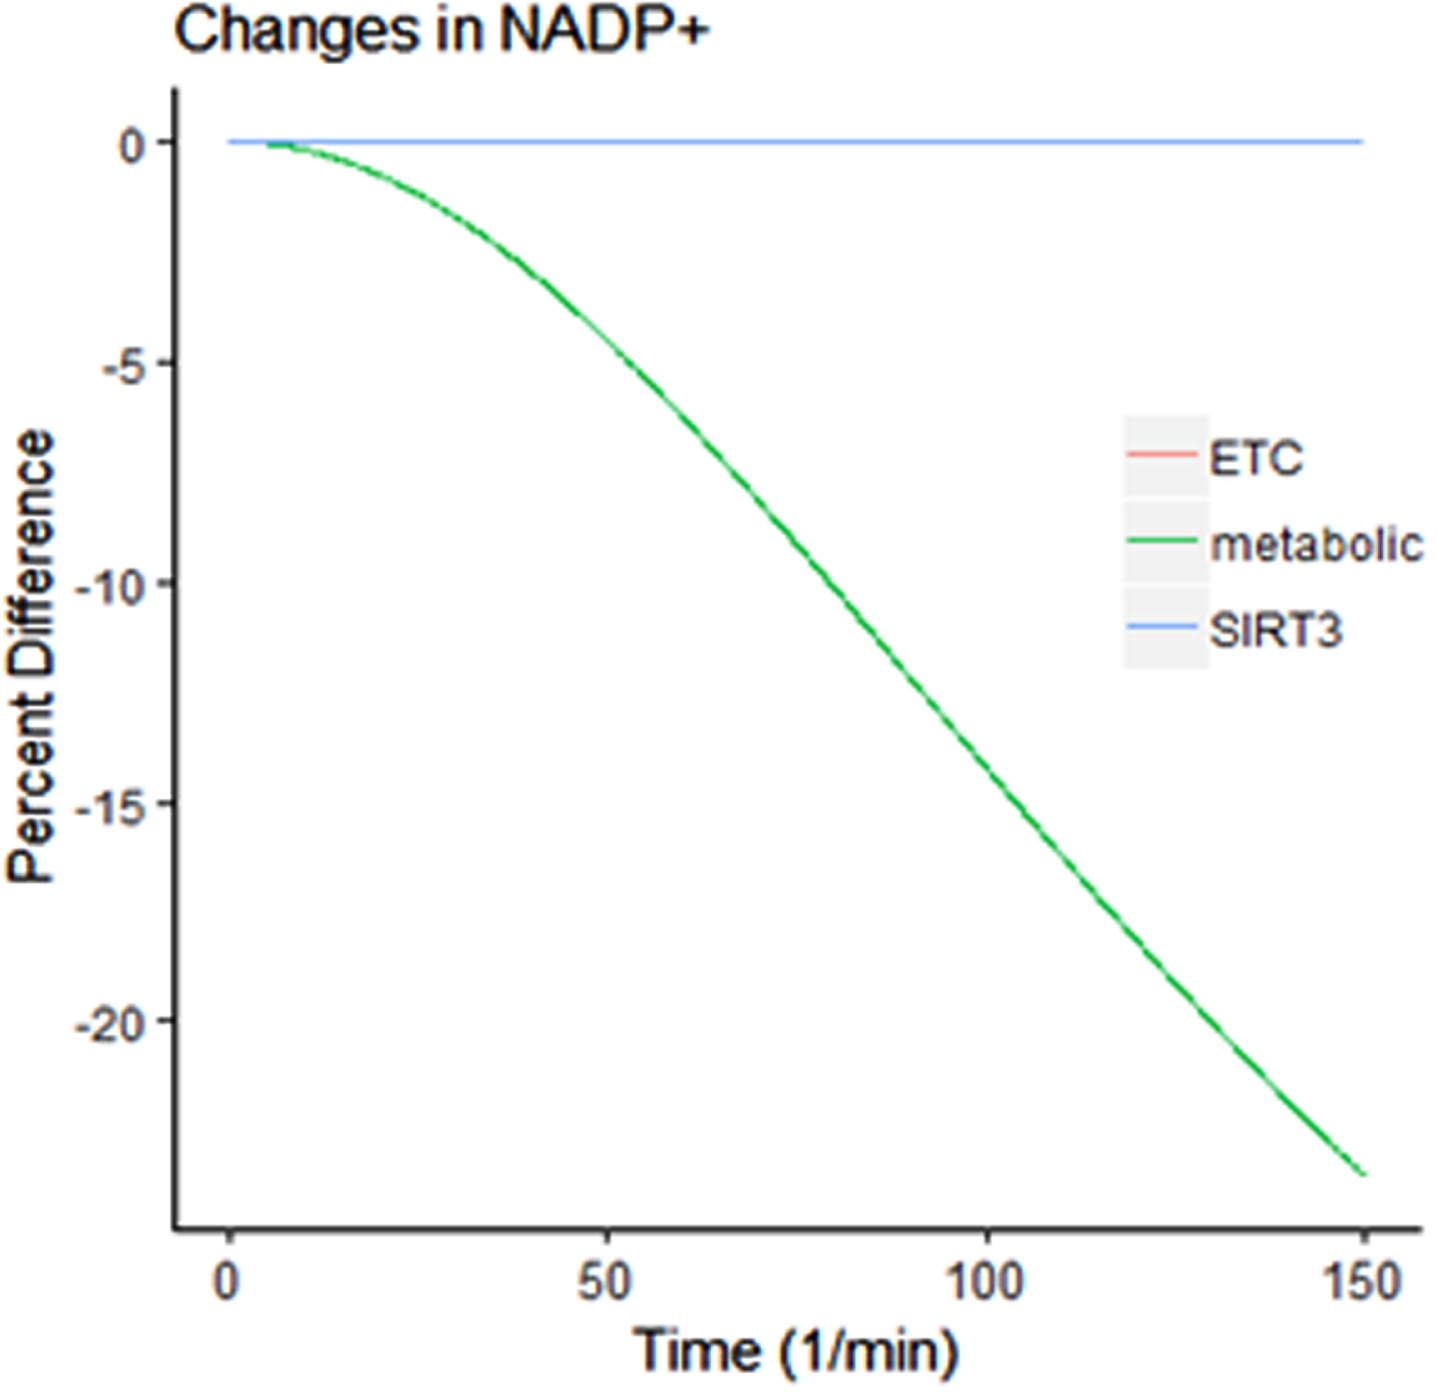
Percent change in NADP+concentration with ETC, metabolic enzyme, and SIRT3 treatment compared to control.
The decreasing NADP+concentration with metabolic treatment (Fig. 2) demonstrates that the antioxidant cofactor is becoming more reduced with treatment and the mitochondria then have a heightened ability to eliminate ROS. Another aspect of mitochondrial function is the availability of NAD and NADH (Fig. 3).

Changes in mitochondrial NAD/NADH ratios with target treatments. Metabolic enzyme treatment (blue) made the largest impact on the NAD/NADH ratio. The stabilized ETC treatment (green) caused the ratio to triple while SIRT3 treatment (purple) did not change the NAD/NADH ratio
The NAD/NADH ratio governs metabolic activity, influences antioxidant cofactor availability, and the rate of energy production [26]. The ratio varies with cell type, during energy production and in response to environmental factors. If the ratio gets too high, living systems show increased oxidative stress and inefficient energy production [27]. Due to variability and the importance in maintaining general homeostasis, it is important to evaluate potential therapeutic targets for their impact on the mitochondrial NAD/NADH ratio to reduce the potential impact on normal mitochondrial activity. As seen in Fig. 3, increasing SIRT3 made no difference in the NAD/NADH ratio despite use of NAD as a cofactor while ETC and metabolic therapeutic targets increase the ratio three to five-fold.
Cytosolic targets
The SAs of cytosolic therapeutic targets highlight important relationships between the signaling pathways, feedback loops, and transcription factor activation. PGC1α and FOXO3 both require SIRT1 deacetylation and AMPK phosphorylation to enter the nucleus [28]. LKB1 acts as an intermediate facilitating AMPK activation after SIRT1 activation [21]. These changes lead to beneficial alterations in respiratory gene expression to reduce oxidative stress. Table 2 shows the SA analysis of several of these cytosolic targets. The upper half of Table 2 includes the concentration sensitivities of active transcription factor concentration and the NAD/NADH ratio to targets AMPK, LKB1, and SIRT1. Changes in AMPK concentrations are predicted to have the greatest impact on the NAD/NADH ratio (+0.587); LKB1 also increased the NAD/NADH ratio (+0.346). SIRT1 concentration increases predicted an increase in FOXO3 expression (+0.578) as indicated by increasing concentration. The lower half of Table 2 shows the sensitivities of reaction fluxes to perturbations in enzyme concentrations. NADH oxidation in the cytosol was minimally affected by any of the target species. SIRT1 had the greatest effect on NAM conversion to NMN (+0.587) of all three increased conversions. AMPK was only slightly activated by increases in LKB1 or SIRT1 concentrations.
Cytosolic Target SA of impact of concentration changes on dependent species as well as reaction rates
Based on initial sensitivity analysis (Table 2), both AMPK and LKB1 had a minor impact on PGC1α and FOXO3 activation, but they were able to increase the flux of NMN synthesis, an indicator of SIRT1 activity and the AMPK positive feedback loop. The sensitivity of active FOXO3 to SIRT1 concentrations indicates that SIRT1 is important for FOXO3 activation. The correlation between AMPK activity and the NAD/NADH ratio can lead to additional SIRT1 activation as the sirtuin cofactor NAD becomes more available. This means that AMPK therapy could bring about a beneficial increase in SIRT1 activity as shown by the increase in NAM. Similarly, LKB1 had moderate effects on the model, predominantly increasing AMPK activation.
Further analysis of SIRT1, LKB1, and AMPK CRISPR Cas9 simulations were done with time course analysis. The goal of cytosolic target-based therapies are to improve mitochondrial stress signaling and initiate changes in gene transcription via FOXO3 and PGC1α. Activity of both these transcription factors increases with increasing oxidative stress in vitro, but this model shows a preferential activation of FOXO3 (Fig. 4). SIRT1-based therapy caused the greatest increase in FOXO3 activation, increasing FOXO3 activation by 25%. LKB1 therapy had no effect on transcription factor activation, and AMPK therapy caused a moderate increase in FOXO3 activation.

Transcription factor activation with therapy targets SIRT1 (A), LKB1 (B), and AMPK (C). The model predicts that FOXO3 will be preferentially activated by changes in ROS production. AMPK and SIRT1 are the most effective treatment options.
DISCUSSION
By utilizing qPCR data with respect to changes in gene expression between AD and control samples, we were able to develop a mathematical model to demonstrate mitochondrial activity during the progression of AD. We then used this model to simulate various CRISPR gene therapies. This mathematical mitochondrial model predicts that increased SIRT3 activity may be a way of strengthening mitochondrial stress response without interfering with normal respiratory activity. Although it is well known that SOD2 activation is important for limiting the accumulation of superoxide species, this model predicts that increased oxidative stress results in increased SIRT3 activation and a change in gene expression. This is more important within mitochondria affected by AD as a method to reduce oxidative stress than changes in SOD2 activation. Changes in metabolic activity also impact oxidative stress within the cell. Figure 3 and Table 1 show that decreasing metabolic enzymes had a beneficial impact on the NAD/NADH ratio. Increasing stable ETC leads to a notably higher ratio. This higher ratio favors activation of antioxidant pathways which can decompose any stress-related increases in superoxide not handled by the decreased demand and oxidation of the individual complexes.
The model predicted that FOXO3 is preferentially activated by oxidative stress. The lack of PGC1α activation indicates that it is more sensitive to ATP availability and production which deactivates AMPK. SIRT1 is predicted to be the more effective therapeutic target due to the changes in the FOXO3 activation (Fig. 4). AMPK is a second potential target. It plays an important role in both FOXO3 and PGC1α activation, but the low PGC1α activation in this model hints that changes in ATP availability may be more important for PGC1α activation than FOXO3. Depending on the goal of therapy (eliminate dysfunctional mitochondria or restore respiratory activity) different targets should be considered.
These model predictions about transcription factor activation may be of importance when understanding the mitochondrial differences between elder and long-lived individuals. People who live to be older than 75 years have defective mitochondria with high peroxide concentrations and low ATP levels [30]. The results of this model would predict that this unique trait may be due to sequential changes in gene transcription allowing for mitochondrial fusion (changes in bioenergetics) before autophagy activation. This sequence could prevent autophagic degradation because the hyperfusion of mitochondria make them resistant to degradation. It is unclear how this adaptation relates to AD, but the correlation with lifespan is favorable. Further work studying the effects of subunit and antioxidant therapies on mitochondrial stress response in vitro to assess the utility of these treatments is required to confirm these predictions.
Footnotes
ACKNOWLEDGMENTS
This work was supported by grants from the Virginia Center of Aging Alzheimer’s and Related Diseases Research Award Foundation and from the Commonwealth Health Research Board. The funders had no role in study design, data collection and analysis, decision to publish, or preparation of the manuscript.