
Abstract
Background:
The activation of microglia and neuroinflammation has been implicated in the pathogenesis of Alzheimer’s disease (AD), but the exact roles of microglia and the underlying mechanisms remain unclear.
Objective:
To clarify how the metabolic reprogramming of microglia induce by amyloid-β (Aβ)1-42 to affect the release of proinflammatory cytokines in AD.
Methods:
MTS assay was used to detect the viability of BV2 cells treated with different concentrations of Aβ1-42 for different periods of time. The expression levels of proinflammatory cytokines were determined by qRT-PCR and western blot assay in BV2 cells and hippocampus of mice. RNA sequencing was applied to evaluate the gene expression profiles in response to HK2 knockdown in BV2 cells treated with Aβ1-42.
Results:
Low concentrations of Aβ1-42 increased the viability of BV2 cells and promoted the release of proinflammatory cytokines, and this process is accompanied by increased glycolysis. Inhibition of glycolysis significantly downregulated the release of proinflammatory cytokines in BV2 cells and hippocampus of mice treated with Aβ1-42. The results of RNA sequencing revealed the expression of chemokine ligand 2 (Cxcl2) and ephrin receptor tyrosine kinase A2 (EphA2) were significantly downregulated when knocked down HK2 in BV2 cells. Subsequently, the expression of proinflammatory cytokines was downregulated in BV2 cell after knocking down EphA2.
Conclusion:
This study demonstrated that EphA2/p38 MAPK pathway is involved the release of proinflammatory cytokines in microglia induced by Aβ1-42 in AD, which is accompanied by metabolic reprogramming from oxidative phosphorylation (OXPHOS) to glycolysis.
Introduction
Alzheimer’s disease (AD), one of the most common chronic progressive neurodegenerative diseases, is characterized by cognitive dysfunction, abnormal mental behavior, and decreased social life function [1, 2]. Studies have shown that the intracellular neurofibrillary tangles and extracellular senile plaques formed by deposits of amyloid-β (Aβ) protein in brain are two major neuropathological hallmarks in AD [3–5]. The deposition of Aβ can be phagocytosed by microglia and astrocytes and eventually be cleared in lysosomes [6]. In the other hand, microglia can be activated by Aβ and lead to the release of proinflammatory cytokines such as interleukin-1β (IL-1β) and tumor necrosis factor-α (TNF-α), which induce the production of Aβ protein precursor (AβPP) in turn. The increase of AβPP makes the production of Aβ protein higher and further initiate a vicious cycle [1, 7]. Although the short-term activation of microglia may promote fragment removal and tissue repair, continuous activation of microglia will induce the chronic release of proinflammatory cytokines, leading to inflammatory cascade reactions and neurotoxic effects in neurodegenerative diseases [8–10]. The involvement of neuroinflammation in AD has been an intense focus of recent studies, but the exact role of microglia in the pathogenesis of AD remains unclear.
Studies have shown that changes in energy metabolism, especially the abnormal glucose metabolism and mitochondrial dysfunction are the early events in the progression of AD [11]. Recently, it has been reported that the cellular metabolism is reprogrammed from oxidative phosphorylation (OXPHOS) to aerobic glycolysis, a phenomenon named as the Warburg effect, during the process of inflammatory response in AD [12, 13]. Although the glycolysis produces a little energy, its main physiological function is to provide energy quickly in case of hypoxia [14, 15]. A study from Seoul National University has reported that exposure to Aβ triggers acute microglial inflammation, which is accompanied by metabolic reprogramming from OXPHOS to glycolysis. However, long-term exposure to Aβ makes the microglia reach a chronic immune tolerant phase, resulting in impaired overall metabolism [16]. In this process, the underlying mechanism of increased glycolysis induced by Aβ enhances the proinflammatory cytokine release in microglia remains ambiguous.
In this study, the changes of cell viability and morphology were detected in BV2 cells induced by Aβ1-42. Then the expression of proinflammatory cytokines were investigate when glycolysis was inhibited by 2-deoxy-D-glucose (2-DG) or hexokinase 2 (HK2)-shRNA in vitro and in vivo. As the first rate-limiting enzyme in the process of glycolysis, HK2 can phosphorylate glucose and promote it entry into cells [17]. So the gene expression profiles in response to knockdown of HK2 were analyzed in BV2 cells by RNA sequencing. Finally, we observed if EphA2/p38 MAPK signaling pathway is involved the microglial metabolic reprogramming and inflammation induced by Aβ1-42. This study will provide an experimental basis for further exploring the potential treatment strategy of AD.
Materials and methods
BV2 cell line and animals
The BV2 cell lines, purchased from the Cell Resource Center of Institute of Basic Medical Sciences, Chinese Academy of Medical Sciences (Beijing, China), were maintained in Dulbecco’s Modified Eagle’s Medium (DMEM) with 10% fetal bovine serum (FBS, Hyclone, USA) and 0.2% penicillin/streptomycin (Sigma-Aldrich, St. Louis, MO, USA) and grown at 37°C in a humidified 5% CO2 incubator on 6 well plates.
The 6-month-old C57BL/6N male mice in clean grade, weighing 30 to 35 g, were purchased from Charles River (Beijing, China). All animal procedures have been approved by the Animal Protection and Utilization Committee of Hebei Medical University.
Preparation of oligomer form of Aβ1-42
The synthetic Aβ1-42 were purchased from Sigma (Sigma-Aldrich) and prepared following the protocols described previously [18]. The Aβ1-42 was dissolved in 1, 1, 1, 3, 3, 3-hexafluoro-2-propanol (HFIP, Sigma Aldrich) at 1 mg/ml concentration. The HFIP was allowed to evaporate in the fume hood, and Aβ1-42 was preserved in a film and kept at -80°C until use. The membrane (1 mg Aβ1-42) was re-suspended with 40μl DMSO (Yongda chemistry, Tianjin, China) and then diluted with 1960μl PBS. After incubation at 4°C for 24 h, they were centrifuged and obtained Aβ1-42 oligomer solution with a final concentration of 100μM.
MTS assay
BV2 cells were treated with different concentrations of Aβ1-42 (0, 2.5, 5, and 10μM) (Abcam, Cambridge, UK) for different periods of time (3, 6, 12, and 24 h). Cell viability was measured using MTS Cell Proliferation and Toxicity Detection Kit (Bestbio, Shanghai, China) following the manufacturer’s instructions. In a 96 well plate, 100μl of culture medium per well was added with 20μl of CellTiter96 ®AQueous One Solution Reagent (Promega, Madison, WI, USA), and then was incubated at 37°C and 5% CO2 for 1∼4 h. The cells were measured for absorbance using the Infinet 200 enzyme labeling instrument (TECAN, Männedorf, Switzerland) (λ= 490 nm) and the relative cell viability values were calculated as % of control cultures.
Quantitative real-time reverse transcription polymerase chain reaction (qRT-PCR) assay
Total RNA from BV2 cells or hippocampus of mice were extracted using the SV Total RNA Isolation System (Promega, Madison, WI, USA) and reverse transcribe 2μg total RNA with GoScriptTM Reverse Transcriptase (Promega). qRT-PCR assay was performed using the detection system (Thermo, Waltham, MA, USA). The reaction conditions of PCR were as follows: 95°C, 2 min in stage 1 and 95°C, 15 s and 60°C, 1 min in stage 2, a total of 40 cycles. The relative multiple change of gene expression was calculated by function POWER (2 –ΔΔCT). β-actin was used as a reference gene to normalize the results.
Western blot assay
The proteins from BV2 cells (30μg) were separated with 10% sodium dodecyl sulfate polyacrylamide gel and transferred to the polyvinylidenefluoride membrane (Millipore, Billerica, MA, USA). The membranes were then blocked with 5% milk in 0.1% TBS/Tween-20 buffers for 2 h at room temperature and incubated overnight at 4°C with diluted primary antibodies (HK2, IL-1β, TNF-α, EphA2, p-JNK, JNK, or β-actin from Proteintech, Wuhan, China; p-Erk1/2, Erk1/2 or p-p38 from Cell Signaling Technology, MA, USA; p38 or GADPH from Abcam, Cambridge, UK). The membranes were then blotted with the secondary antibody for 2 h at room temperature. The Bole ChemiDocchemiluminescence imaging system (Bio-rad, Hercules, CA, USA) was used to image the polyvinylidenefluoride membrane, and the Image Lab software (Bio-rad) was used to analyze the gray scale value.
Determination of lactic acid levels
The intracellular lactic acid contents in BV2 cells stimulated with2-Deoxy-D-Glucose (2-DG) for 12 h were measured by L-Lactate Assay Kit (Lanso, Shanghai, China) using colorimetric analysis (λ= 450 nm) with Infinet 200 enzyme labeling instrument (TECAN, Männedorf, Switzerland). After generating a standard curve, the lactic acid concentrations of the samples were calculated.
Brain stereotaxic injection
The 6-month-old C57BL/6N male mice were anesthetized by inhalation of 3% isoflurane for induction and 2% isoflurane for maintenance using a small animal anesthesia system (Hebei Zhongmai Pharmaceutical Development Co., Lt, Shijiazhuang, China) and fixed on the brain stereotaxic instrument (Neurostar, Germany). The top of the head was disinfected with alcohol and made a longitudinal incision to expose the bregma and lambda located by software. Taking the bregma point as the coordinate origin, the bilateral hippocampal CA1 area was located by the built-in mouse brain atlas (left: ML = –2.29 mm, AP = –2.28 mm, DV = 1.70 mm; right: ML = 2.29 mm, AP = –2.28 mm, DV = 1.70 mm). Microinjection pump was set to a volume of 1μl, a rate of 0.05μl/min, a time of 20 min and a remained time of 5 min after the injection.
Thirty-six C57BL/6N mice were randomly divided into four groups: Control group (0.9% normal saline), Aβ group (5μM of Aβ1-42), 2-DG group (24μg/ml of 2-DG), and Aβ1-42+2-DG group. For the Aβ1-42+2-DG group, our treatment for mice was as follows: intraperitoneal injection of 2-DG (MedChemexpress, NJ, USA) was performed for three consecutive days, followed by bilateral hippocampal stereotaxic injection of Aβ1-42, and continued injection of 2-DG until one day after operation. The samples of the four group mice were taken 24 h after stereotactic localization.
Knockdown of HK2 or EphA2 with RNA interference
BV2 cells were transfected with short hairpin RNA (shRNA) targeting HK2 or small interfer RNA (siRNA) targeting EphA2 at 40–50% or more confluence on 12 or 6 well plates. The cells were maintained in 0.5 or 1 ml DMEM with HK2-shRNA (including 90955, 90056, 90957), or Lipofectamine2000 and EphA2-siRNA, or the nc-shRNA, or the nc-siRNA at 37°C for 12 h, respectively. After replacing the medium with 1 or 2 ml DMEM containing 2% FBS, the cells were cultured for another 72 h. The knockdown efficiency was assessed by qRT-PCR and western blot as described above.
Immunofluorescence staining
Mouse brain tissues were fixed with 4% paraformaldehyde at 4°C for 24 h, and then incubated in 30% sucrose at 4°C for 48 h. Next, continuous coronal sections of the brain (30μm thick) were made with a frozen slicer (Leica CM1950, Nussloch, Germany). The slices were blocked with PBST (0.01M PBS and 0.3% Triton X-100) for 30 min and then with PBST containing 5% goat serum for 1 h at room temperature. The slices were incubated overnight at 4°C with primary antibody in PBST containing 1% normal goat serum (rabbit anti-IBA1, Cell Signaling Technology, MA, USA). Then slices were incubated with the secondary antibody (Alexa Flour 488 anti-Rabbit Donkey IgG (H+L), Thermo, Waltham, MA, USA) at room temperature for 1.5 h. After re-dyeing with DAPI for 15 min, the slices were fixed on glass slides and sealed with anti-fluorescence quenchant. All images were acquired by confocal microscope (Olympus, Tokyo, Japan) at a resolution of 1024×1024.
RNA sequencing (RNA-seq)
BV2 cells were transfected with nc-shRNA or HK2-shRNA and stimulated with Aβ1-42 for 12 h, then these cells were harvested for RNA-seq (n = 3). According to the manufacturer’s suggestion, the NEBNextUltraTMIIRNA library Prep Kit from Illumina (NEB, Ispawich, USA) was used to generate the sequencing library and add the index code to the attribute sequence of each sample. The library fragments were purified by AMPure XP (Beckman, CA, USA), and the cDNA fragments with length of 250∼300 bp were obtained. Agilent Biological Analyzer 2100 system (Agilent Technologies, Santa Clara, CA, USA) was used to evaluate the quality of the library. On the cBot cluster generation system, TruSeq PE Cluster Kit v3 cBot Cluster (Illumina, CA, USA) was used to cluster the index coding samples. The preparation of the library was sequenced on the IlluminaHiseq platform (Illumina, CA, USA). Finally, the pairing end sequences of 125 bp/150 bp were generated. The differentially expressed genes (DEGs) analysis was performed by using the DESeq2R software package (1.16.1). The significance threshold is defined as adjusted p < 0.05 and [log2Fold Change (FC)]>1. The functional enrichment analysis was performed to identify the significantly enriched KEGG pathways and GO terms, including biological process (BP), molecular function (MF), and cellular component (CC).
Statistical analysis
Statistical analyses were performed by SPSS software version 22.0 (IBM Corp., Armonk, NY, USA). Data are expressed as the mean±SD of at least three independent experiments. Differences between groups were analyzed by one-way analysis of variance (one-way ANOVA) followed by Bonferroni post hoc tests. Relative expression levels of mRNA were calculated by the 2–ΔΔCt method. All tests were two-sided, and p < 0.05 was considered as statistically significant.
RESULTS
Aβ1-42 induced activation of microglia and promoted the release of proinflammatory cytokines
MTS assay was used to detect the changes of BV2 cell viability after stimulating with different concentrations of Aβ1-42 for different periods of time. When the BV2 cells were treated with 2.5 or 5μM Aβ1-42 and incubated for 6 or 12 h, the cell viability was significantly higher than that of control group (Fig. 1A). Moreover, the counts of BV2 cells were gradually increased to the peak, and the morphology of cells changed from branching to amoeba, accompanying by cell body enlargement after the BV2 cells were treated with Aβ1-42 for 12 h under microscope (Fig. 1B-D). The results of qRT-PCR and western blot analysis showed that the expression levels of IL-1β (Fig. 1E, G, H) and TNF-α (Fig. 1F, G, I) in each group were significantly increased compared with control when stimulation of BV2 cells with different concentrations of Aβ1-42 for 12 h. Notably, the expression of IL-1β and TNF-α reached the highest levels at the concentration of 5 Mm Aβ1-42, indicating that5μM Aβ1-42 greatly promoted the release of proinflammatory cytokines from BV2 cells. Therefore, stimulation of BV2 cells with 5μM of Aβ1-42 for 12 h was used in the follow-up experiments.
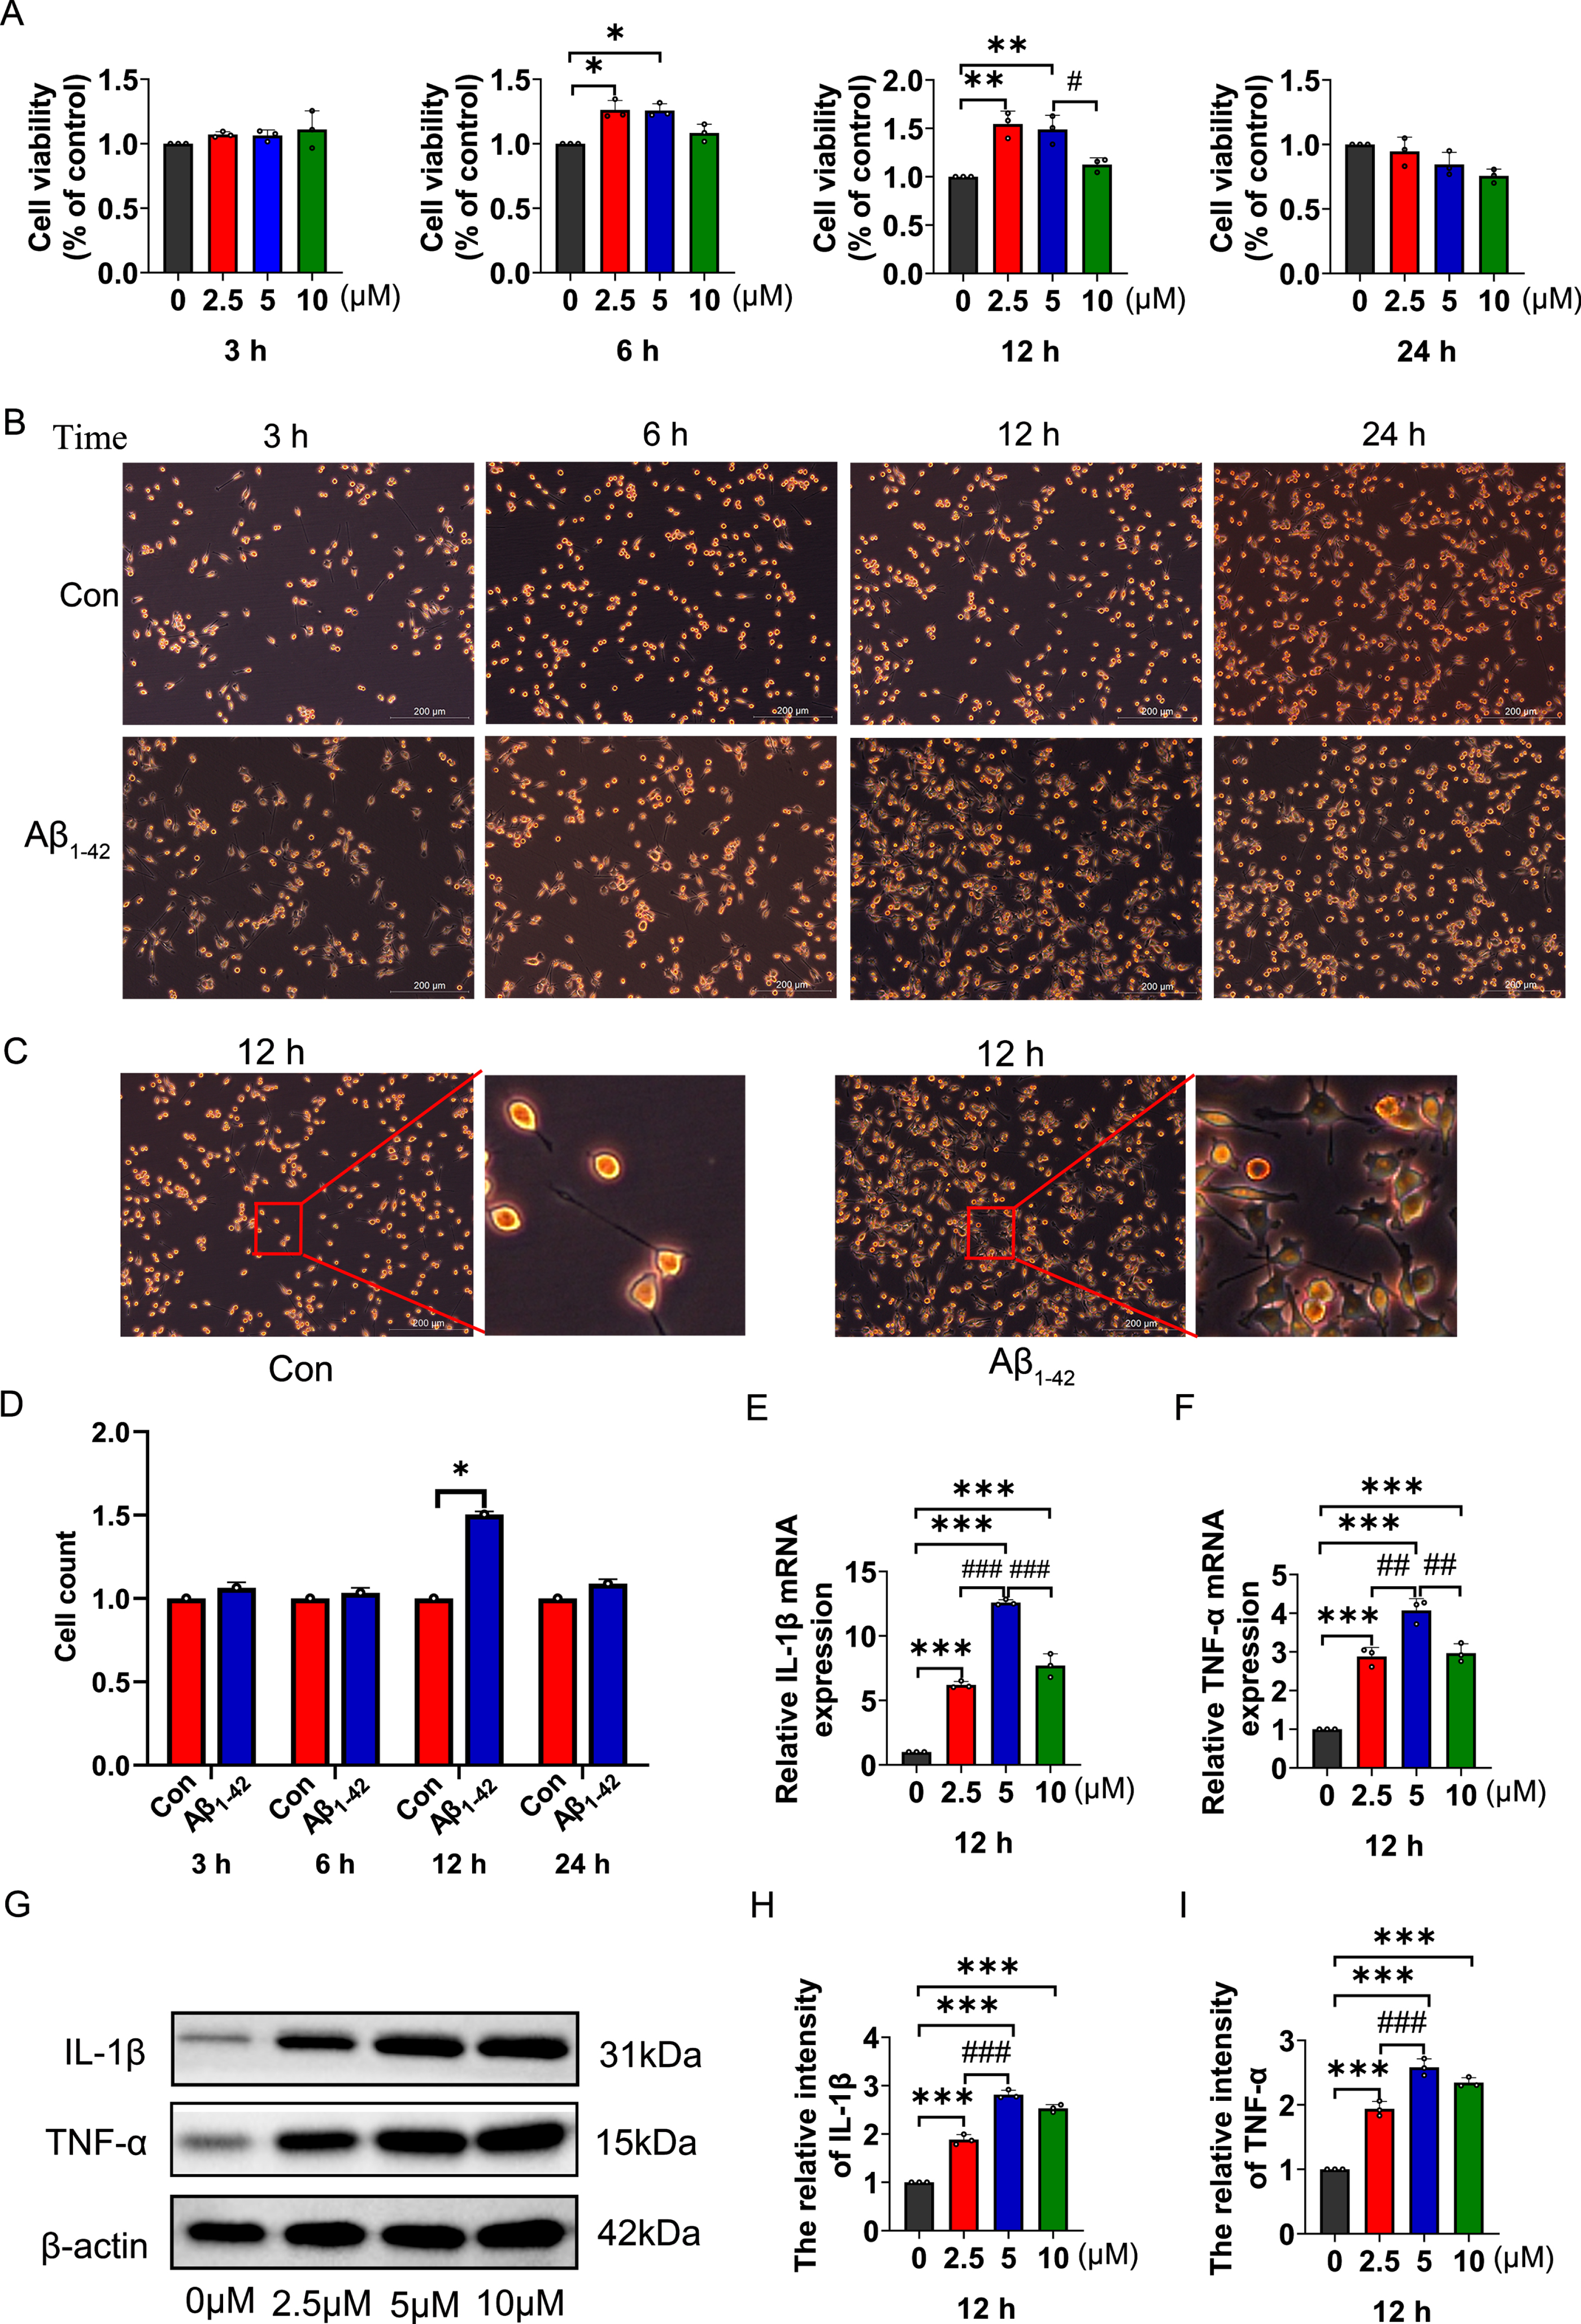
Changes in cell viability, morphology, and the expression of proinflammatory cytokines in BV2 cells induced by Aβ1-42. A) The viability of BV2 cells were analyzed by MTS assay after stimulating with different concentrations of Aβ1-42 for different period of time. B, C) The representative images of cell proliferation (B) and morphological changes (C) in BV2 cells treated with 5μM Aβ1-42 for indicated time. Scale bar 200μm. D) The numbers of BV2 cells stimulated with 5μM Aβ1-42 for different time. E, F) The relative expression levels of IL-1β (E) and TNF-α (F) mRNA were detected by qRT-PCR assay in BV2 cells stimulated with different concentrations of Aβ1-42 for 12 h. G-I) Expression of IL-1β (G, H) and TNF-α (G, I) at protein levels in BV2 cells stimulated with different concentrations of Aβ1-42 for 12 h. The data are expressed as the means±SD. *p < 0.05, **p < 0.01, ***p < 0.001 versus Control, #p < 0.05, ##p < 0.001, ###p < 0.001 versus 5μM group, n = 3.
To investigate if the Aβ1-42 triggers metabolic reprogramming of microglia from OXPHOS to glycolysis during the process of acute inflammation, the BV2 cells were treated with Aβ1-42 and incubated with or without 2-DG (a glucose analog that inhibits glycolysis) for 12 h. The results of qRT-PCR analysis showed that the expression levels of IL-1β (Fig. 2A) and TNF-α (Fig. 2B), as well as the contents of lactic acid (Fig. 2C), were significantly increased in Aβ group compared with the control group. However, the Aβ1-42 induced increase of IL-1β and TNF-α expression, as well as the content of lactic acid, could be blocked by 2-DG, indicating that the Aβ1-42 induced release of proinflammatory cytokinesis accompanied by the metabolic reprogramming from OXPHOS to glycolysis in BV2 cells.

The acute inflammation induce by Aβ1-42 was dependent on the metabolic reprogramming from oxidative phosphorylation to glycolysis in BV2 cell. A-C) The relative mRNA expression of IL-1β (A) and TNF- α (B), and the content of lactic acid (C) in BV2 cells treated with 5μM Aβ1-42, with or without 2-DG (a glucose analog that inhibits glycolysis) treatment for 12 h. D, E) Expression of HK2 mRNA (D) and protein (E) levels in BV2 cells transfected with scramble shRNA or three different shRNAs. F) The viability of BV2 cells transfected with HK2-shRNA was analyzed by MTS assay after stimulating with Aβ1-42 for 12 h. G-J) Expression of IL-1β (G, H) and TNF-α (I, J) at mRNA and protein levels in BV2 cells treated with 5μM Aβ1-42 and transfected with shRNA 90956. The data are expressed as the means±SD. *p < 0.05, **p < 0.01, ***p < 0.001 versus Control, NC group or nc-shRNA group, ##p < 0.01, ###p < 0.001 versus Aβ1-42 group, 90956 group or nc-shRNA+Aβ1-42 group, n = 3.
To further validate the relationship of glycolysis and the production of proinflammatory cytokines in BV2 cells, we knocked down the HK2, a key enzyme in the process of glycolysis, in BV2 cells by designing three shRNA for transfection, which were 90955, 90956, and 90957, respectively. Compared with the other groups, the expression of HK2 at the mRNA and protein levels in BV2 cells were largely decreased in group of 90956 (Fig. 2D, E). Subsequently, when the 90956 shRNA was transfected to BV2 cells, the increase of cell viability (Fig. 2F) and the expression of IL-1β (Fig. 2G, I) and TNF-α (Fig. 2H, J) at mRNA and protein levels induced by Aβ1-42 were rescued by knocking down of HK2 in BV2 cells. These results indicated that the acute inflammation of microglia triggered by Aβ1-42 was dependent on the metabolic reprogramming from OXPHOS to glycolysis in vitro.
To further investigate the in vivo effects of the enhanced glycolysis induced by Aβ1-42 on the expression of proinflammatory cytokines in microglial cells of hippocampus, the C57BL/6N mice were treated by stereotaxic injection of Aβ1-42 into the hippocampus and intraperitoneal injection of 2-DG (Fig. 3A, B). We found that the microglial cells were obviously activated in the hippocampus of Aβ1-42 group compared with that of control group (Fig. 3C), while the number of microglial cells in hippocampus of Aβ1-42+2-DG group were significantly less than that of Aβ1-42 group (Fig. 3D). The results of qRT-PCR analysis showed that the levels of IL-1β (Fig. 3E) and TNF-α (Fig. 3F) in Aβ1-42 group were significantly higher than that in control group, but the Aβ1-42 induced increase of proinflammatory cytokine release from microglial cells could be blocked by inhibiting glycolysis in mice. These results suggested that inhibition of glycolysis ameliorated the Aβ1-42 triggered acute inflammation of microglia in hippocampus of mice.

The glycolysis was involved in the activation of microglia and the increased expression of proinflammatory cytokines in hippocampus of C57BL/6N mice induced by Aβ1-42. A) The schematic diagram of the stereotactic injection of Aβ1-42 and intraperitoneal injection of 2-DG in 6-month-old C57BL/6N mice. B) The location of stereotaxic injection with Aβ1-42 in the brain of C57BL/6N mice. C, D) The representative fluorescence images (C) and changes in the activation of microglia (D) in hippocampus of C57BL/6N mice in indicated groups. E, F) The relative expression of IL-1β (E) and TNF-α (F) mRNA in hippocampus of acute AD model mice treated with or without 2-DG. The data are expressed as the means±SD. **p < 0.01, ***p < 0.001 versus Control, #p < 0.05, ###p < 0.001 versus Aβ1-42 group, n = 9.
Given that the acute inflammation of microglia triggered by Aβ1-42 is dependent on the glycolysis in vitro and in vivo, then we performed the RNA-seq to further identify how the enhancement of glycolysis by Aβ1-42 affect the gene expression in BV2 cells. Our data indicated that the overall distribution of the Fragments Per Kilobase of transcript sequence per Millions (FPKM) value were consistent between nc-shRNA+Aβ group and HK2-shRNA+Aβ group. The FPKM values represented relative gene expression abundance, and the results showed that RNA-seq data were reproducible in the experiment (Fig. 4A). The heat map suggested that there were significant differences in gene expression between nc-shRNA+Aβ group and HK2-shRNA+Aβ group (Fig. 4B). Differentially expressed genes (DEGs) analysis suggested there were 346 significantly upregulated genes (FC >1, p < 0.05) and 197 downregulated genes (FC <1, p > 0.05) by the comparison of the nc-shRNA+Aβ group with HK2-shRNA+Aβ group (Fig. 4C). We have identified several significantly enriched GO terms, and the most significant enrichment were “primary metabolic process”, “cell metabolic process”, and “biosynthesis process” among the top 30 terms (Fig. 4D). Moreover, 30 significantly enriched KEGG pathways were identified to be involved in the regulation of HK2 in BV2 cells, which were related to glycolysis and immune inflammation, such as glycolysis/gluconeogenesis, MAPK signaling pathway, IL-17 signaling pathway, and TNF signaling pathway (Fig. 4E). These results suggested that inhibition of glycolysis induced by Aβ1-42 could change the expression of genes related to acute inflammation in microglial cells, and the underlying mechanisms of these altered genes in regulating the metabolism and inflammatory response remain unclear.
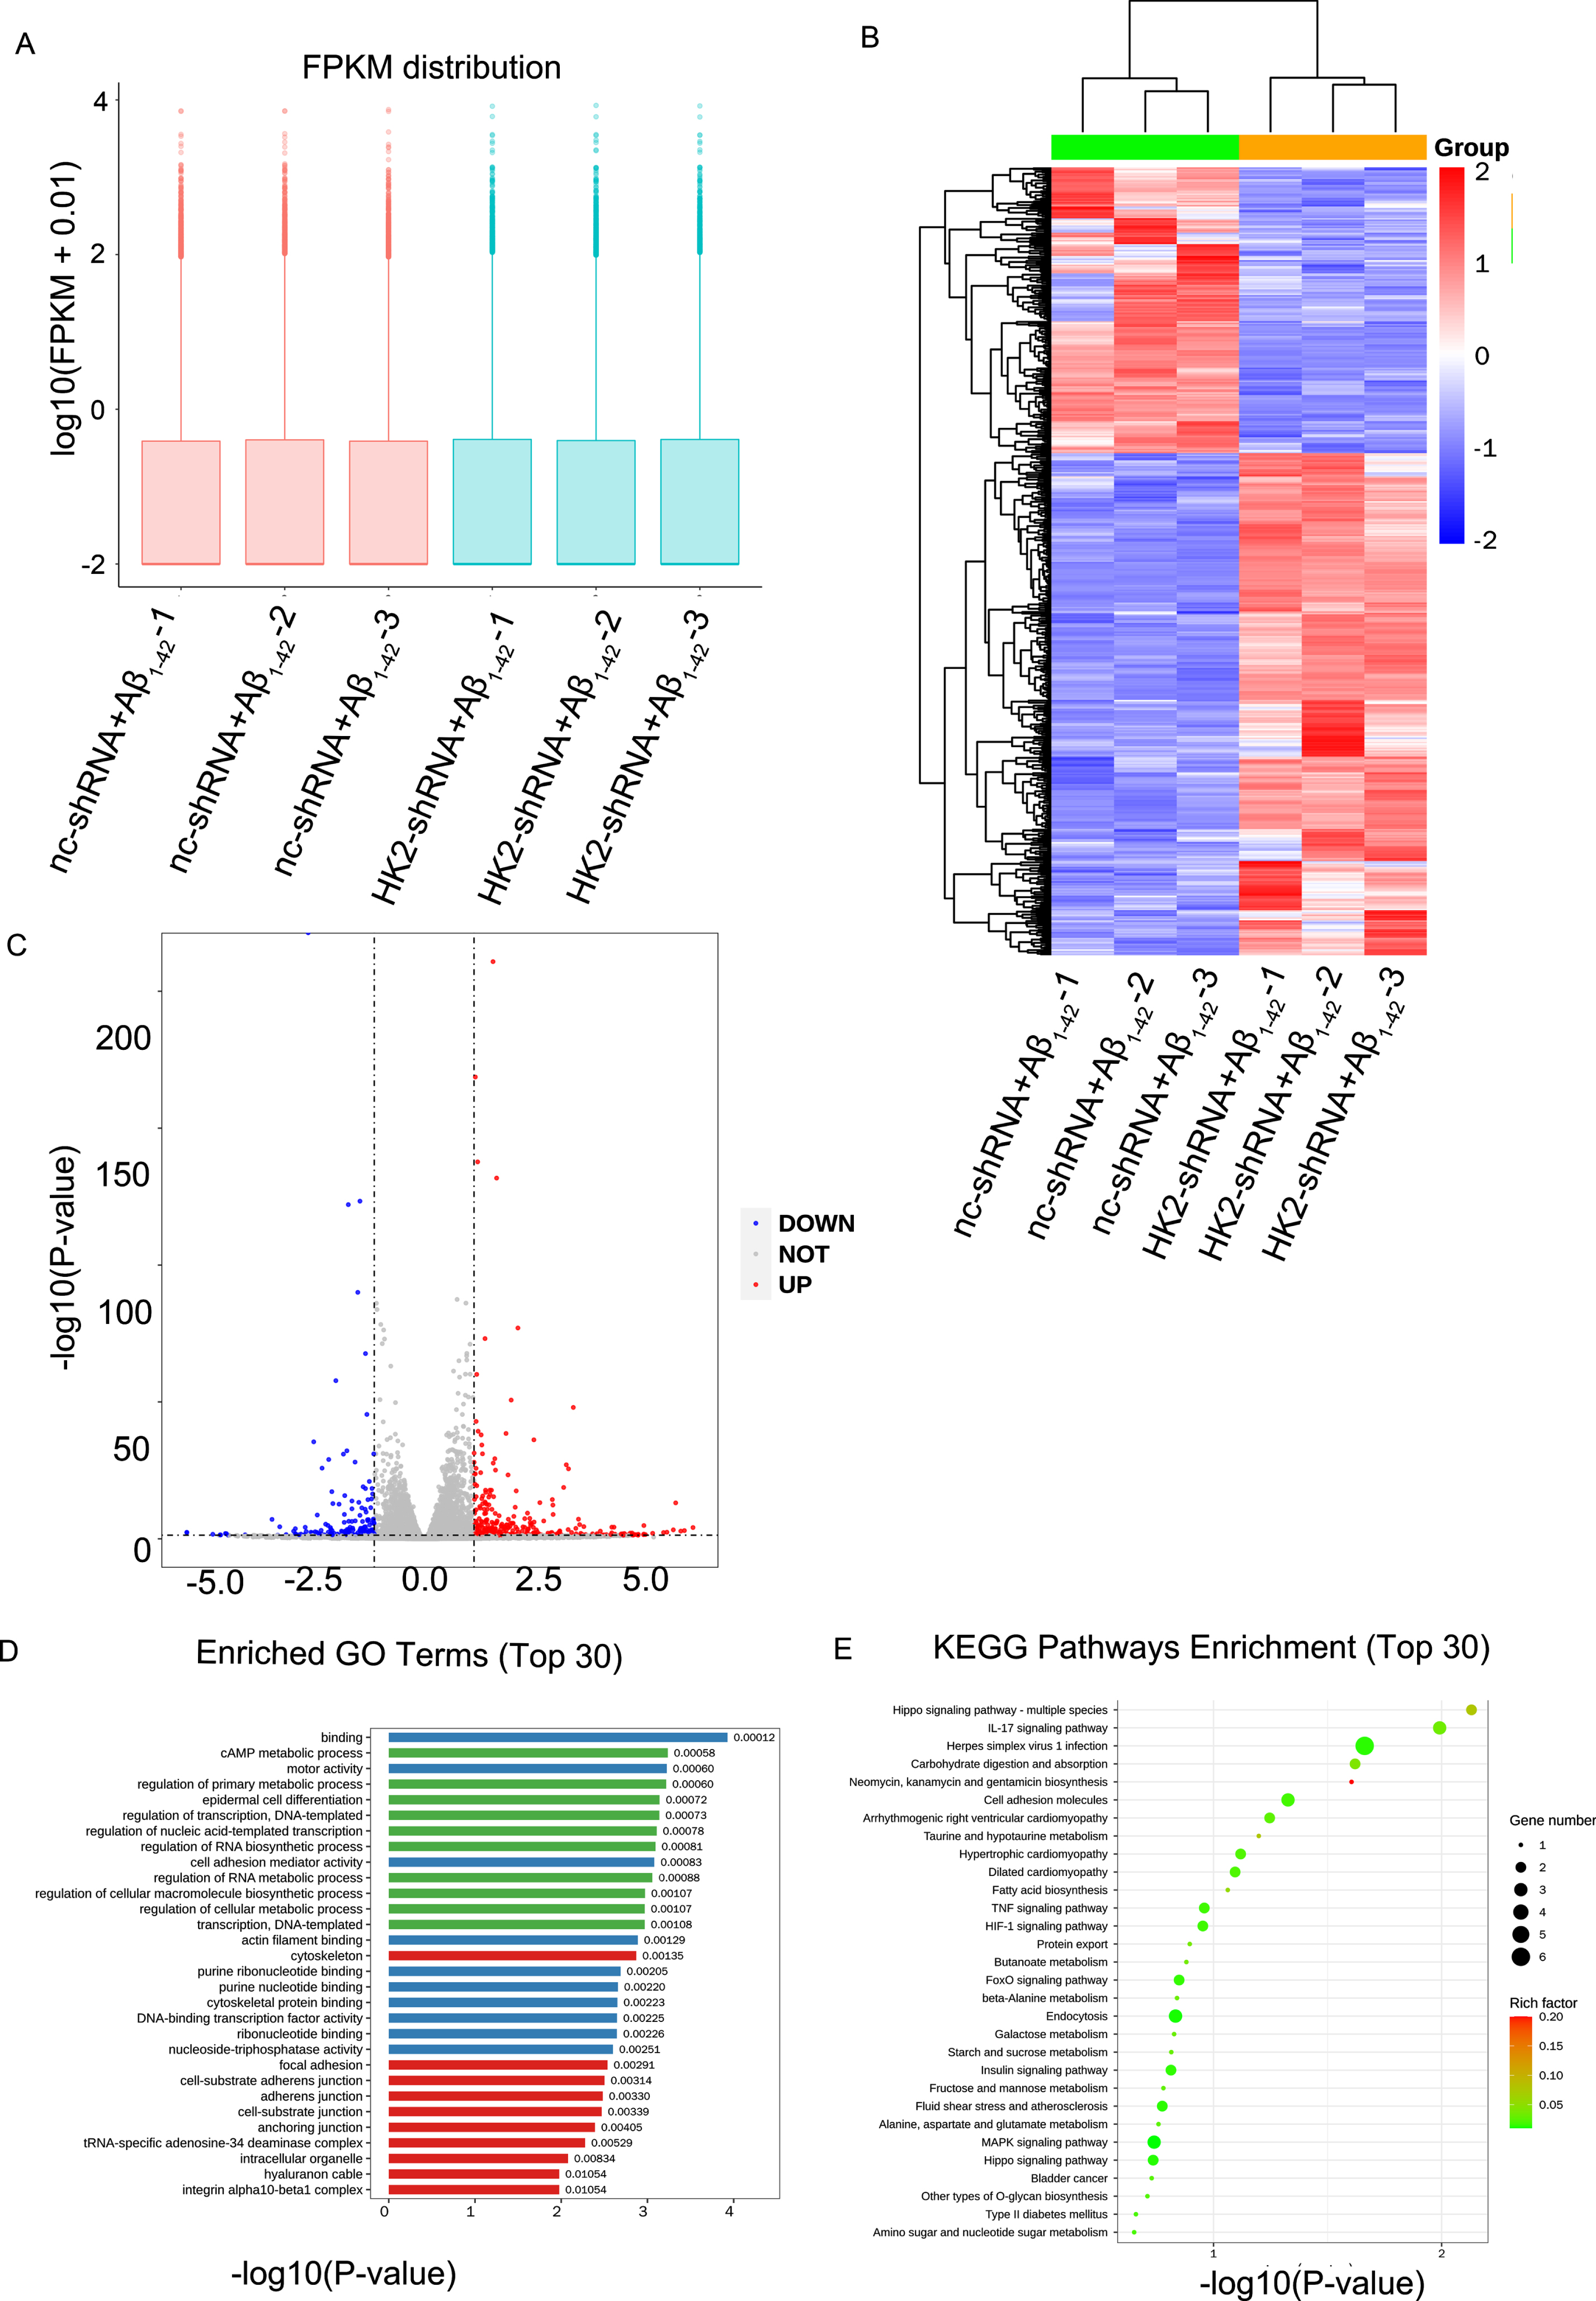
The analysis of differentially expressed genes (DEGs) and functional enrichment by RNA sequencing (RNA-seq) in Aβ1-42 treated BV2 cells knocked down HK2. A) The box plot based on values of log10 (FPKM + 0.01) showed the whole gene expression distribution of the two groups, including nc-shRNA+Aβ1-42 group and HK2-shRNA+Aβ1-42 group. B) The heatmap showed the expression patterns of 543 significantly dysregulated genes with p value less than 0.05, including 346 upregulated genes and 197 downregulated genes, by comparison of the HK2-shRNA+Aβ1-42 group with the nc-shRNA+Aβ1-42 group. C) The scatter plot showed the results of DEGs based on the values of log2 (Fold Change) and -log10 (p value), including 346 downregulated genes and 197 upregulated genes. D) There were three pathway categories including cellular composition (red), biological process (green) and molecular function (blue). The bar chart showed every category of top 10 significantly downregulated pathways. E) The plot showed the top 30 significantly downregulated Kyoto Encyclopedia of Genes and Genomes (KEGG) pathways of DEGs in BV2 cells knocked down HK2. Round size represents the gene number of each pathway, and the color represents the rich factor.
EphA2/p38 MAPK pathway was involved in the regulation of acute inflammation by the Aβ1-42-triggered microglial metabolic reprogramming
To investigate the underlying mechanisms of the glycolysis mediated alteration of genes in regulating the inflammatory response in microglia, we selected 4 important DEGs, including chemokine (C-X-C motif) ligand 2 (Cxcl2) [19], dual specificity phosphatase 10 (Dusp10) [20], ephrin type A2 receptor (EphA2) [21, 22], and matrix metallopeptidase 9 (Mmp9) [23] for the subsequent validation by qRT-PCR assay among the downregulated genes related to inflammation. The results showed that the expression of EphA2 and Cxcl2 were significantly decreased in the BV2 cells knocked down HK2 (Fig. 5A).

EphA2/p38 MAPK pathway was involved the process of inflammation induced by Aβ1-42, accompanied by metabolic reprogramming in BV2 cells. A) Validation of altered expression genes including Cxcl2, Dusp10, EphA2, and Mmp9 screened by RNA sequencing in BV2 cells treated with or without knockdown of HK2. B) The relative protein expression of EphA2, p-JNK, JNK, p-Erk, Erk, p-p38, and p38 were detected by western blot in BV2 cells treated with 5μM Aβ1-42 for 12 h, with or without knockdown of HK2. C) The relative protein expression of EphA2, p-JNK, JNK, p-Erk, Erk, p-p38, and p38 were detected by western blot in BV2 cells treated with 5μM Aβ1-42, with or without knockdown of EphA2. The data are expressed as the means±SD. *p < 0.05, **p < 0.01, ***p < 0.001 versus nc-shRNA or nc-siRNA group, n = 3.
At the same time, the results of sequencing showed that MAPK signaling pathway was significantly inhibited in HK2-shRNA+Aβ group compared with nc-shRNA+Aβ group. MAPK signaling pathway was reported to be involved in the activation and occurrence of inflammation. EphA2 was reported to be related to MAPK signaling pathway [21, 25]. Therefore, EphA2 may regulate the process of inflammation through the MAPK signaling pathway. We further examined the changes in MAPK signaling pathway regulated by EphA2, including p-JNK, JNK, p-Erk, Erk, p-p38, and p38 proteins by western blot assay. The results indicated that the proteins of EphA2 and p-p38/p38 were significantly downregulated in HK2-shRNA+Aβ group of BV2 cells (Fig. 5B). Moreover, when the expression of EphA2 gene were knocked down in BV2 cells by transfecting siRNA, the protein expression levels of EphA2, p-p38, IL-1β, and TNF-α were significantly decreased compared to nc-siRNA+Aβ group (Fig. 5C). These results indicated that EphA2/p38 MAPK pathway was involved in the regulation of acute inflammation response by the Aβ1-42-triggered microglial glycolysis.
Discussion
With the intensification of the aging process of the population, the incidence of AD is increasing year by year. It is estimated that the number of people with dementia will increase to more than 115 million by 2050 worldwide, which is really a heavy economic burden to family and society [26, 27]. The pathological hallmarks of AD are the deposition of cerebral extracellular amyloid plaques and intracellular neurofibrillary tangles [28, 29]. Nowadays more and more people focus on the changes in brain energy metabolism and sustained neuroinflammation in AD, but the results are still controversial. Studies have reported that abnormal glucose metabolism had been observed in the prodromal and progressive stages of AD [30, 31], and the levels of glycolysis were enhanced in the animal model treated with Aβ or in the early stage of AD patients, which is accompanied by an increased release of proinflammatory cytokines, such as IL-1β and TNF-α. Phagocytic immune cells such as microglia are activated and recruited to inflammatory sites to remove toxic substances [16]. Additionally, the number of neurons and axons grow fast after increasing the level of glycolysis in the chronic Aβ stimulation model and the late stage of AD [32, 33]. However, some studies have suggested that the transformation of microglia from OXPHOS to glycolysis will lead to microglial dysfunction and Aβ accumulation [34, 35], so the exact roles of microglia in the pathogenesis of AD remain unclear.
As resident innate immune cells of the brain, microglia continuously monitor the extracellular brain environment. When the nervous system is invaded or damaged by pathogens or other dangerous substances, microglia show inflammatory phenotype, accompanied by increased expression of proinflammatory cytokines. Aβ stimulate the aggregation and activation of microglia, which form a physical barrier enclosing neurotoxic Aβ, restricting plaque growth and reducing neurotoxicity [36, 37]. In order to confirm the effect of Aβ on microglia cell viability and inflammation, we tested the cell viability and proinflammatory cytokines expression in BV2 cells after stimulation with different concentrations of Aβ1-42. The viability of BV2 cells and the levels of proinflammatory cytokines were increased with the prolongation of lower concentrations of Aβ1-42 stimulation, while they were significantly decreased in BV2 cells treated with higher concentrations of Aβ1-42. In addition, we also found that the proliferation of BV2 cells reached the peak and the expression levels of IL-1β and TNF-α were highest when treated cells with low concentration of (5μM) Aβ1-42 for 12 h, accompanied by cell body enlargement and the morphology changed from branching to amoeba, which were consistent with previous reports [38]. These results suggested that the microglia could be activated and release proinflammatory cytokines at low concentration of Aβ1-42 protein.
Studies have reported that Aβ can induce the activation of microglia and inflammation, accompanying with elevated level of glycolysis [16, 33]. HK2 is the first rate-limiting enzyme in the process of cell glycolysis, which mainly controls the catalytic process of cell glycolysis and is a key molecule in the regulation of cell energy metabolism [17]. As an inhibitor of HK2, the structure of 2-DG is similar to that of glucose. It is transported to cells by glucose transporter and competes with glucose for binding to HK2. After 2-DG was phosphorylated by HK2, 2-deoxyribose-6-phosphate (2-DG-6-P) was formed that could not pass through glycolysis, resulting in the decrease of ATP production [17]. At the same time, 2-DG can competitively inhibit HK2 through 2-DG-6-P, exerting the inhibitory effect of glycolysis [39]. In this study, we found that the expression of proinflammatory cytokines (including IL-1β and TNF-α) and the contents of lactic acid were increased significantly in BV2 cells after Aβ stimulation. After inhibiting glycolysis with 2-DG, they were significantly decreased during this process. In addition, we also found that Aβ1-42 could stimulate the chemotaxis and activation of microglia, accompanied by a significant increase in the level of proinflammatory cytokines in vivo. While after inhibiting glycolysis, the chemotaxis and activation and the levels of inflammation were significantly lower in microglia. These results indicated that Aβ1-42 can stimulate the chemotactic activation of microglia and promote the occurrence of inflammation, and this process is accompanied by the metabolic reprogramming from OXPHOS to glycolysis.
Given that the acute inflammation of microglia triggered by Aβ1-42 is dependent on the glycolysis, then we investigated the underlying mechanism of the glycolysis in regulating the release of proinflammatory cytokines in microglia. Based on the expression levels of IL-1β and TNF-α were significantly decreased in BV2 cells treated with Aβ1-42 after knocking down HK2, we performed RNA-seq to further identify how the enhanced glycolysis induced by Aβ1-42 stimulation affect the gene expression in BV2 cells. The results showed that 346 genes were significantly upregulated and 197 genes were downregulated, and the pathways related to cell metabolism and immune inflammation were significantly downregulated inBV2 cells treated with Aβ1-42 and knocking down HK2. Among the top 30 downregulated GO terms, “primary metabolic process", “cellular metabolic process", and “biosynthesis process” were most significantly enriched, indicating that inhibition of glycolysis resulted in decrease of cell metabolism. In addition, some of these pathways are related to glycolysis and immune inflammation, such as IL-17 signaling pathway, MAPK signaling pathway, and TNF signaling pathway, which further confirmed that the cell metabolism and inflammatory response are downregulated after inhibition of glycolysis in BV2 cells. Then to validate the results of RNA-seq, we determined four genes (Cxcl2, EphA2, Dusp10, and Mmp9) related to inflammation by qRT-PCR and our results further confirmed that the levels of Cxcl2 and EphA2 mRNA were significantly downregulated after knocking down HK2, which was consistent with the results of sequencing. These results suggested inhibition of glycolysis induced by Aβ1-42 could change the expression of genes related to acute inflammation in microglial cells, and these altered genes may play roles in regulating inflammatory response in AD.
As a member of the Eph family of receptor tyrosine kinases (RTK) [40], EphA2 is a 130 kDa protein containing 967 amino acid residues and a type I transmembrane glycoprotein [41]. Studies have shown that EphA2 is involved in MAPK signaling pathway [21, 22], which is the main intracellular signal transduction system. There are mainly three pathways of MAPK signaling pathway in mammalian cells, including Erk, JNK, and p38, and the p38 MAPK plays an important role in regulating the inflammation response [24, 25]. Therefore, it is speculated that Aβ-induced glycolysis may regulates the microglial inflammation response through EphA2-MAPK pathway. In this study, we observed the MAPK pathway was downregulated and the release of proinflammatory cytokines were decreased in BV2 cells after knockdown of EphA2 and inhibiting glycolysis. Our subsequent experiments confirmed that the expression of EphA2 were significantly decreased at mRNA and protein levels, and the expression of p-p38 MAPK protein was also significantly downregulated after Aβ1-42 stimulation and knockdown of HK2. Then the expression of EphA2were knockdown by transfection with siRNA, and we found that the expression of p-p38 protein was significantly downregulated after Aβ1-42 stimulation. Therefore, it is concluded that the Aβ induced glycolysis may ultimately enhance the release of proinflammatory cytokines through p-p38 MAPK signaling pathway by regulating the expression of EphA2.
In summary, the acute inflammation induced by Aβ1-42 was dependent on the metabolic reprogramming from oxidative phosphorylation to glycolysis in BV2 cells. The enhanced glycolysis induced by Aβ1-42 altered the expression of genes related to acute inflammation in microglial cells. It is concluded that the EphA2/p38 MAPK pathway is involved in the metabolic reprogramming and inflammation response of microglia in early stage of AD, which provide a new potential direction for exploration of the pathogenesis and treatment of AD.
Footnotes
ACKNOWLEDGMENTS
This work was supported by the National Natural Science Foundation of China (82171582), the Science and Technology Research Project of Higher Education Institutions in Hebei Province (ZD2020105), the Hebei Provincial Natural Science Foundation (H2020206597) and the Postgraduate Innovation Project of Hebei Education Department (CXZZBS2020106).