
Abstract
Background:
Alzheimer’s disease (AD) is a neurodegenerative pathology that disrupts processing of facial expressions of emotion. The impairment was demonstrated for negative emotions in tasks of matching, discriminating, and labeling facial expressions but no study has included the expression of pain in its protocol.
Objective:
The objective was to study the processing of emotional facial expressions in AD with a particular interest in pain expression.
Methods:
Twenty-seven controls, 15 mild AD patients, and 15 moderate AD patients had to perform four emotional tasks: identification of facial expressions, matching pain expressions, discriminating the intensity of pain expressions, and judging pain intensity.
Results:
Some emotions were less efficiently recognized by AD patients compared to controls (p < 0.001), specifically fear from the mild stage (p < 0.05), pain and disgust from the moderate stage (p < 0.05 and p < 0.001 respectively). The Exploratory Factor Analysis showed that recognition of pain and recognition of other discreet emotions were underpinned by two different latent factors. Performances on pain expression matching task and pain intensity discrimination task did not differ by group. (p = 0.334 and p = 0.787 respectively). Finally, moderate AD patients judged the pain less intensively than the Control group for both, moderate, and severe pain intensity (p < 0.001).
Conclusion:
Our data suggest that AD disrupts the recognition of pain expression along with recognition of fear and disgust. Additionally, AD patients seem to underestimate pain intensity compared to controls. The self-rated pain scales should be adapted to the pain processing deficit of AD patients.
INTRODUCTION
Alzheimer’s disease (AD) is a neurodegenerative disorder that gradually affects cognitive functions such as memory, executive, or even praxis capacities. It also disrupts emotional processing and can lead to behavioral problems or reduce the social life of patients [1].
Several studies have shown that the alteration of medial temporal cortex, including the amygdala, was negatively correlated with the ability to identify emotions [2, 3]. The amygdala is affected early in the development of AD, and it was indeed shown that there is a specific impairment of the decoding of emotional expression in AD [4]. These authors pointed out that the decrease in cognitive capacities may contribute to the impairment that was demonstrated during tasks of matching, discriminating, and labeling facial expressions, especially negative ones (e.g., [5]). Thus, the processing of joy would be rather spared as it is mainly characterized by lips region processing [6]. However, the literature remains controversial as to whether there is a global deficit in the recognition of negative emotions in the early stages of AD. For example, Bucks and Radford [7] did not show such deficit, while Richard-Mornas et al. [8] observed deficit in recognition of fear, Chainay and Gaubert [9], in recognition of anger and Kessels et al. [1] in recognition of disgust, anger, and fear. Furthermore, different studies do not always examine the same expressions, and, to our knowledge, no studies have included the expression of pain in their protocols.
Similar to the basic emotions [10] the facial expression of pain contains specific units of action defined by facial action coding system [11]. Kunz and Lautenbacher [12] described four different facial activity patterns of pain: 1) narrowed eyes with furrowed brows and wrinkled nose; 2) opened mouth with narrowed eyes; 3) raised eyebrows; and 4) furrowed brows with narrowed eyes. Furthermore, pain recognition activates a specific neural network [13] that strongly involves the amygdala, the somatosensory cortex, the thalamus, the anterior insula, and the anterior cingulate cortex [14]. While the recognition of the expression of pain is a specific process as previous studies suggest, it is of interest to study its processing in AD compared to other emotions. Disruption of pain processing could impact pain detection based on self-report pain scales.
Thus, the objective of this research was to study the processing of emotional facial expressions in AD with a particular interest on the expression of pain, and the correlation to the progression of the disease. The results of this preliminary research may guide future work on the accessibility of self-report pain scales in AD. As reported in other studies, patients are expected to have difficulties with facial expression processing tasks and specifically tasks involving negative emotions and pain.
METHODS
Participants
A total number of 57 participants including 27 controls, 15 mild AD patients (Mild group), and 15 moderate AD patients (Moderate group) participated in this study after having given their written informed consent. In all patients, the diagnosis was probable or possible AD based on the NINCDS-ADRDA criteria [15]. Patients were separated based on Mini-Mental State Examination (MMSE) score [16], a score between 22 and 30 corresponding to the mild stage and between 16 and 21 corresponding to moderate stage. All participants were screened for anxiety-depressive disorder with Hospital Anxiety and Depression scale (HAD) [17] and should not have both sub-scores higher than 10 points. They also had to have a correct or corrected vision to normal.
Controls were recruited from associations for elderly people and among patient’s caregivers. Patients were recruited in the Neurology department of the hospital of Saint Etienne and in the Charpennes Hospital in Lyon/Villeurbanne.
Materials and procedure
First, each participant underwent a brief neuropsychological assessment including the following tests: MMSE [16], Trail Making Test (TMT A and B) [18], Reduced Battery of Executive Function (BREF) [19], and HAD [17].
After a short break, the participant was placed in front and about sixty centimeters from a computer screen to perform four emotional tasks presented in the following order: 1) identification of facial expressions, 2) matching pain expressions, 3) discriminating the intensity of pain expressions, and 4) judging pain intensity. The computer keyboard was used to collect the participant’s responses.
As the total duration of the procedure could be a maximum of two hours, a break was offered to ensure the participants’ good attentional engagement in the tasks.
Facial expression identification task
Forty-nine short videos of actors expressing joy, sadness, fear, disgust, anger, pain, or neutral expression coming from the Montreal Pain Affective Face Clips database [20] were used in this task. Each emotion was expressed by seven different actors. For each trial, a 1-s video representing a facial expression, gradually increasing in intensity, was shown. At the end of the video, a static image of the face expressing a given emotion remained and, at the same time, seven verbal labels corresponding to the different expressions were displayed on the right of the screen (See Fig. 1a). The participant had to choose the label matching the presented facial expression and give his answer orally to the experimenter who enters it on the keyboard. There was no time limit to give a response.

Four emotion processing tasks. Image “a” on the top left corresponds to the facial expression identification task. Image “b” on the top right represents the Expression matching task. Image “c” on the lower left is the pain intensity discrimination task. Image “d” at the bottom right refers to the pain intensity judgment task.
Expression matching task
The same videos from the Montreal Pain Affective Face Clips database were used and each one was sliced into 36 static images using a morphing technique. Only the image with the highest intensity of expression from each video was selected for this task. Thirty-two trials with a “target” image of an actor presenting an expression of pain (16 trials), fear (8 trials), or joy (8 trials) were presented on the left side and seven other faces of another actor expressing the seven different expressions (anger, joy, disgust, fear, pain, sadness, and neutral) were displayed on the right side (See Fig. 1b). The identities of the faces changed randomly from one trial to another. The target size was 4.6 cm by 3 cm and that of the other seven images was 3.5 cm by 2.4 cm. All images remained displayed till a response was given. The participant had to indicate, among the seven faces, the one representing the same expression as the target. The experimenter entered the answer on the keyboard. Only trials with the target expression of pain were analyzed.
Pain intensity discrimination task
A video from the same database showing a single actress gradually expressing her pain was divided into 36 static images using a morphing technique [20]. Eleven of the 36 images were selected in such a way that each one corresponded to different pain intensity, with image 1 corresponding to the lowest intensity and image 11 corresponding to the highest intensity. These 11 images were coupled with each other to create 121 pairs in which each image was compared to itself and all other images of different intensity (See Fig. 1c). There were 10 levels of intensity difference (ID) with the lowest ID0 when the image was compared to itself and the highest ID10 when image 1 was compared with image 11. The images were 7 cm by 4.7 cm in size and were displayed until a response was given. The participant had to indicate orally for each trial whether the pain intensity was the same or different between the two images presented. The answer was entered on the keyboard by the experimenter.
Pain intensity judgment task
Sixty videos representing patients expressing pain with different intensities (none, moderate or severe) were extracted from the STEP Test. This scale has been validated by Prkachin et al. [21] and has already been used to estimate the intensity of the pain of others from their facial expressions in previous articles [22]. Each video was presented for one second, followed by a display of an intensity judgment verbal scale with three levels of intensity: 0=“no pain”, 1 = moderate pain and 2 = severe pain. Participants were asked to use this scale to judge the intensity of displayed pain expression (See Fig. 1d). As with the other tasks, the participant had to say the answer out loud, and the experimenter entered it on the keyboard.
Statistical analysis
Group differences for neuropsychological, sociodemographic, and emotion processing task were analyzed using the analysis of variance (ANOVA) test and pairwise post hoc comparisons with the Tukey’s test. When the number of comparisons was large, a Bonferroni correction was applied. The chi-squared test was used for comparing gender differences.
All the parameters necessary for performing the ANOVA were checked with Levene’s test and Mauchly’s test. A Greenhouse-Geisser correction was applied when the sphericity was not respected. A violation of the homogeneity was observed for the pain intensity judgment task, preventing an ANOVA from being performed. Therefore, the results of this task were analyzed using the Mann-Whitney U and the Wilcoxon signed-rank test.
The potential links between emotional processing, dysexecutive disorder, and frontal functioning are still much debated in precedents works [23, 24]. To analyze the implication of these cognitive abilities on pain emotion recognition, a multiple regression model was performed by entering the pain recognition score as a dependent variable and the MMSE score, the TMTB-TMTA difference, and the BREF score as explanatory variables. These variables are entered into the model by following the Enter Method. This selection procedure allows to enter all the variables of a block in a single step. This means that all independent variables will have equal importance in our model and no prioritization is done.
To understand if the expression of pain has a specific status among the negative emotions we looked if there was a potential relationship between measured and latent variables, performing an Exploratory Factor Analysis (EFA) and using the ML method with oblique (Promax) rotation based on the polychoric correlation matrix (which have been found to perform better than Pearson matrix of correlations of the 7 items of the original scale with parallel analysis [25, 26]). This analysis was performed using the results of the three groups (control, Mild group, and Moderate group) combined from the Facial expression identification task. We are aware that the size of our sample is limited compared to the needs of this kind of statistical analysis, but this part of our analysis is an exploratory work. The results will be used to guide future research.
Items were retained if their unique variance was < 0.80 and their factor loading was > 0.40 and if they were not complex (cross-loading<0.30 on two or more factors). First, the data was examined for univariate and multivariate normalities using the Mardia’s test and the Doornick-Hansen test [27]. No items with a skewness value greater than the cutoffs of 3 (absolute value) recommended by Kline was found [28] and no correlations violating the multivariate normality assumption was detected. The absence of multicollinearity was also confirmed, using the VIF indices, considering a multicollinearity if the values of VIF were greater than or equal to 10 and if the average of the VIF was greater than or equal to 2 [29].
The analyses were performed using STATA 12, with polychoric correlations package [Kolenikov, STATA module], and fapara package for parallel analysis.
RESULTS
Neuropsychological and socio-cultural characteristics
Regarding socio-demographic characteristics, a significant difference was observed between groups for age, F (2 ;54) =5.637; p < 0.01; η2p=0.173. Only the Moderate group differed from the Control group, t (2) =-3.357; p tukey < 0.01; Cohen’s d = 1.137 with an older age on average for the Moderate group (See Table 1). In order to control the effect of age on the other results, this variable was added to the set of ANOVAs performed as a covariate. There was no difference in the distribution of men and women, χ2 (2) =1,604; p = 0.449, or in the level of education, F (2 ;53) =0.038; p = 0.963; η2p=0.001.
Sociodemographic characteristics and neuropsychological scores
Data represent mean (standard error) values. Education levels: 1 = primary education; 2 = secondary education; 3 = college education. *Significantly differed from controls (p < 0.05). currencySignificantly differed from mild group (p < 0.05). Abbreviations: MMSE, Mini Mental State Examination; TMT, Trail Making Test; BREF, Reduced Battery of Executive Function; HAD, Hospital Anxiety and Depression scale; M, Male; F, Female.
For the neuropsychological performance, significant differences were observed between groups regarding the MMSE, F (2 ;53) =132.04; p < 0.001; η2p=0.833, the TMTA, F (2 ;53) =15.76; p < 0.001; η2p=0.377, the difference “TMTB-TMTA”, F (2 ;53) =38,89; p < 0.001; η2p=0.655 and the BREF, F (2 ;53) =25.31; p < 0.001; η2p=0.517. Group differences on the HAD questionnaires did not cross the threshold of significance. No interaction was observed between age and group for all the analyses described above.
Processing of facial expressions
Facial expression identification task
ANOVA showed a significant effect of group, F (2 ;53) =14.420; p < 0.001; η2p=0.352. The Control group was significantly better at recognizing facial expressions than the Mild group, t (2) =3.218; p tukey < 0.05; Cohen’s d = 0.426 and the Moderate group, t (2) =5.208; p tukey < 0.001; Cohen’s d = 0.690. An interaction between the emotion and the group, after the Greenhouse-Geisser correction since the sphericity was not respected, was also observed, F (9.310 ;246.705) =2.974; p < 0.01; η2p=0.101. Post hoc analyses were performed using the Bonferroni test. The Mild group recognized fear significantly less well than the Control group, t (2) =3.749; p bonf < 0.05. The Moderate group had significantly poorer recognition scores than the Control group regarding disgust, t (2) =4.784; p bonf < 0.001, pain, t (2) =3.998; p bonf < 0.05 and fear, t (2) =4.421; p bonf < 0.01. Significantly lower scores were observed for recognition of disgust in the Moderate group compared to the Mild group t (2) =3.820; p bonf < 0.05. The ANOVA did not show a significant effect of age, F (1 ;53) =0.590; p = 0.446; η2p=0.011, of emotion F (4.655 ;246.705) =2.025; p = 0.081; η2p=0.037 and interaction effect between age and emotion, F (4.655 ;246.705) =2.147; p = 0.065; η2p=0.039. The results are shown in Fig. 2.
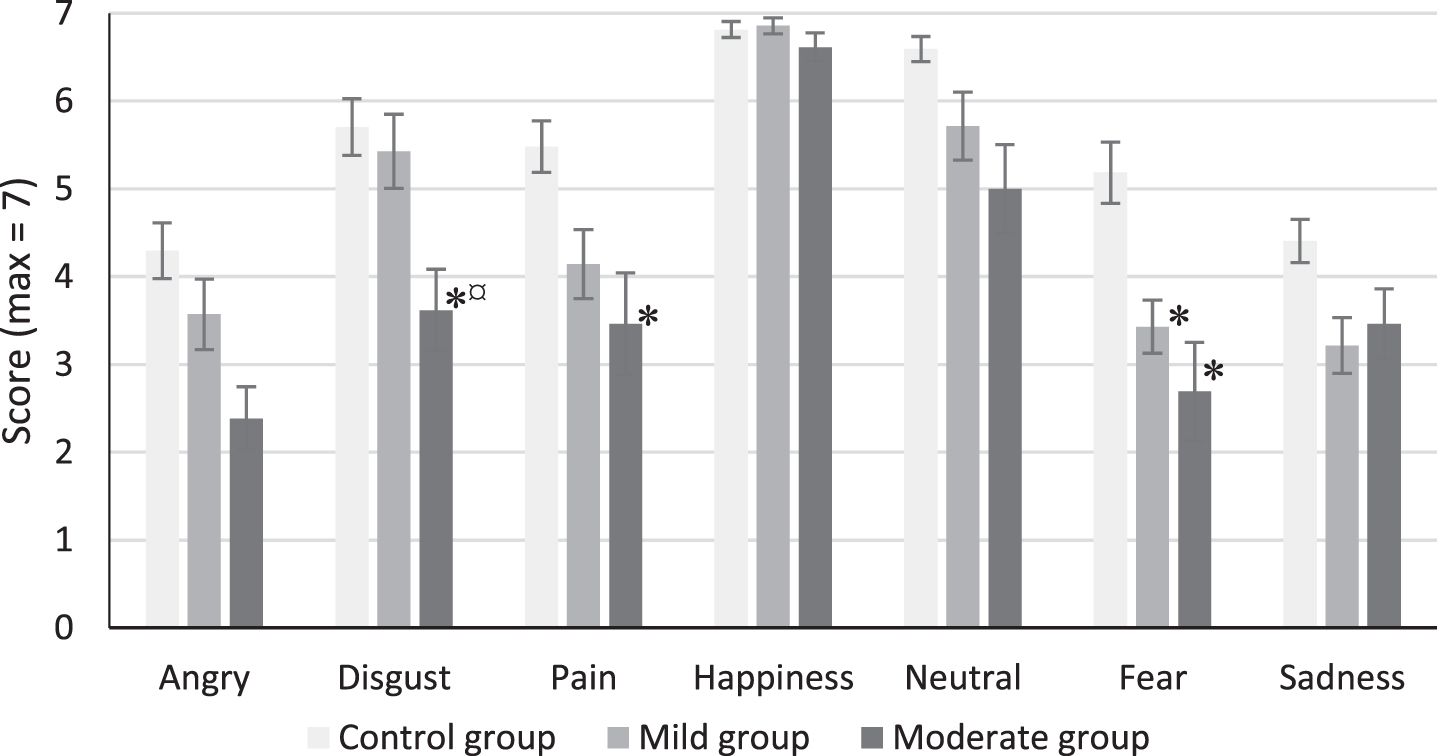
Facial expression identification scores. Mean (±SE). *Significantly differed from controls (p < 0.05). currencySignificantly differed from mild group (p < 0.05).
The multiple regression analysis exploring the implication of frontal and executive abilities in recognition of pain showed that the set of variables entered in the model explained only 6.1% (R2=0.061) of the variability of the results which did not reach the threshold of significance, F (3,41) =0.890; p = 0.454.
The EFA sought to show a potential relationship between measured and latent variables and based on the scree plot showed one factor and contributions were low after the first component, but a parallel analysis indicated at least two factors (See Table 2). High correlations were found (KMO = 0.81) and matrices were not singular (0 < d<1) nor identity (χ2 (21) =108.05, p < 0.001).
Parallel analysis
Therefore, we tested a model in two factors, no items were complex and none had a unique variance greater than 0.80. Thus, 7 items were retained for factor analysis with oblimin rotations. The two factors explained 44.68 % of the total variance and fit indices showed acceptable values for each factor (respectively α=0.75 and α=0.45). Factor 1 contained 5 items concerning all discrete emotions (anger, disgust, fear, happiness, and sadness), factor 2 consisted of 2 items (pain and neutral) (loading are shown in Table 3). Factor correlation was good: 0.71.
Factor loadings
Expression matching task
ANOVA showed no group effect on matching score, F (2 ;53) =1.121; p = 0.334; η2=0.041. In fact, the means were relatively similar for the Control group (M = 0.53; S. E.=0.03), the Mild group (M = 0.46; S. E. = 0.05) and the Moderate group (M = 0.45; S. E.=0.03). The scores were above the chance threshold (1/7 or 0.14). The results of the expression matching task are shown in Fig. 3.
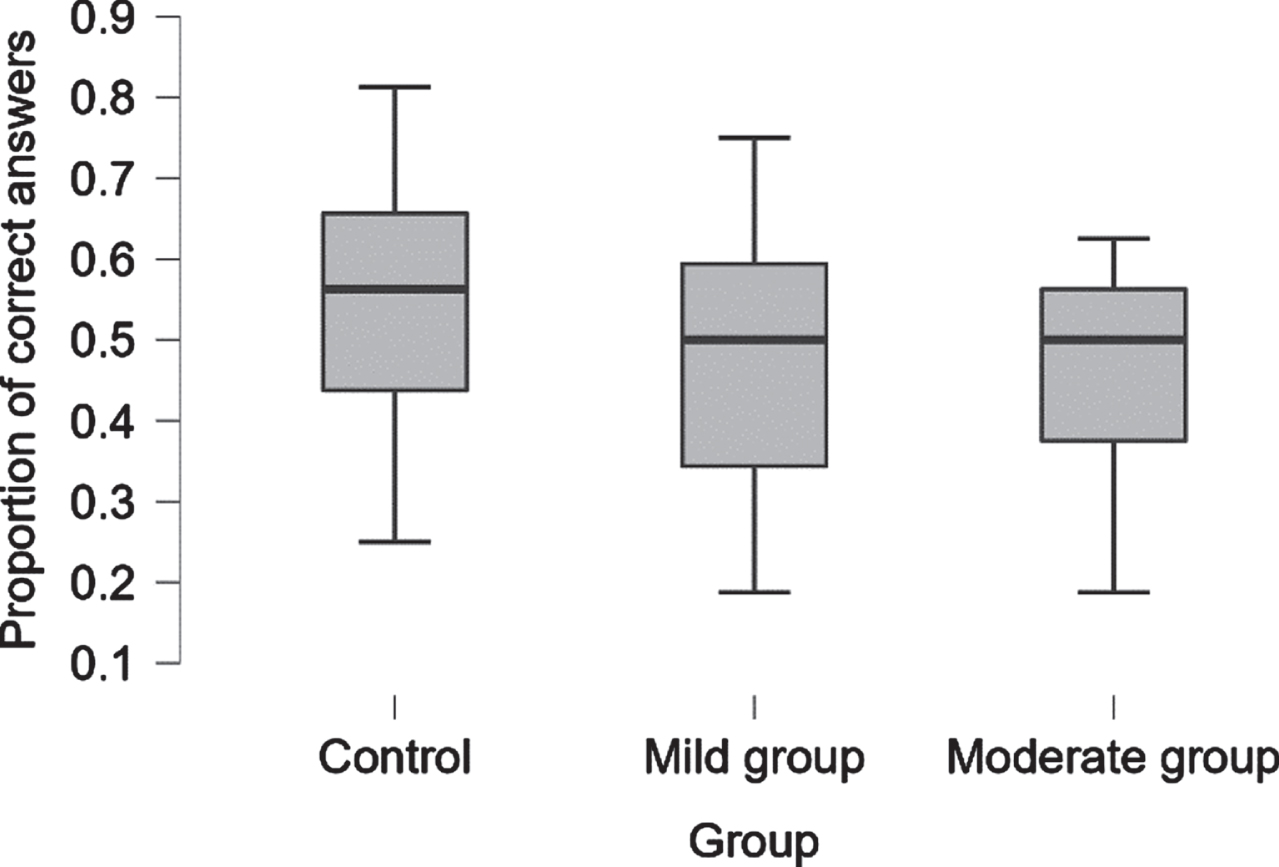
Proportion of correct answers on matching task. Median (±SE).
Pain intensity discrimination task
ANOVA did not show a significant interaction between ID and group, F (6.106 ;161.798) =1.306; p = 0.257; η2p=0.047. The main effect of the ID, after the Greenhouse-Geisser correction since the sphericity was not respected, was observed, F (3.053 ;161.798) =4.596; p < 0.01; η2p=0.080. Post hoc analyses were performed using the Bonferroni test. Participants responded significantly better when there was no difference in intensity (ID0) than when the difference was present (ID1, ID2, ID3, ID4, or ID5) (all p < 0.001). The effect of group and the interaction between ID and age did not reach the significance level, (F (2 ;53) =0.241; p = 0.787; η2p=0.009; F (3.053 ;161.798) =1.209; p = 0.308; η2p=0.022). The results of the discrimination task are shown in Fig. 4.
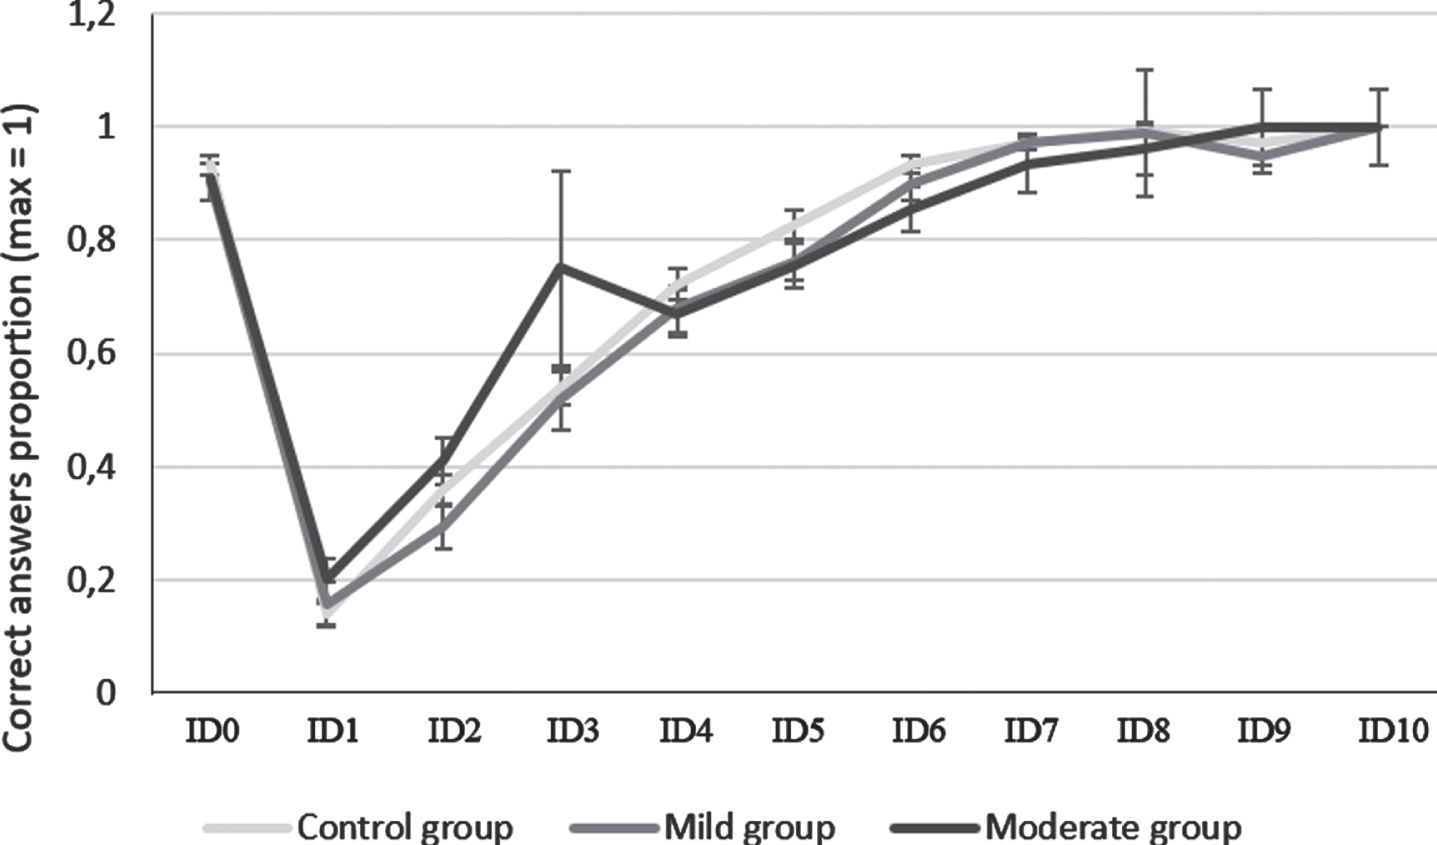
Pain intensity discrimination score. Mean (±SE). ID0 similar images. ID10 trails when the image 1 was compared with image 11.
Pain intensity judgment task
Levene’s test showed a violation of homogeneity, preventing an ANOVA from being performed. Using Wilcoxon’s signed-rank test, significant differences in the judgment of the three intensities were observed. “No pain” was rated lower on the scale than moderate pain and severe pain (W = 3.50; p < 0.001; r rb = -0.996; W = 0.00; p < 0.001; r rb = -1.000). Moderate pain was judged to be weaker than severe pain, W = 0.00; p < 0.001; r rb = -1.000.
The Mann-Whitney U test showed significant differences between the Moderate group and the Control group in the judgment of moderate, W = 73.00; p < 0.001; r rb = -0.640 and severe pain intensity, W = 53.50; p < 0.001; r rb = -0.736. In addition, there was a significant difference between Moderate group and Mild group for severe pain, W = 179.50; p < 0.01; r rb = -0.596. For all these differences, the Moderate Group judged the pain as less intense as compared to the other groups (See Fig. 5). There were no significant differences between the Mild group and the Control group.
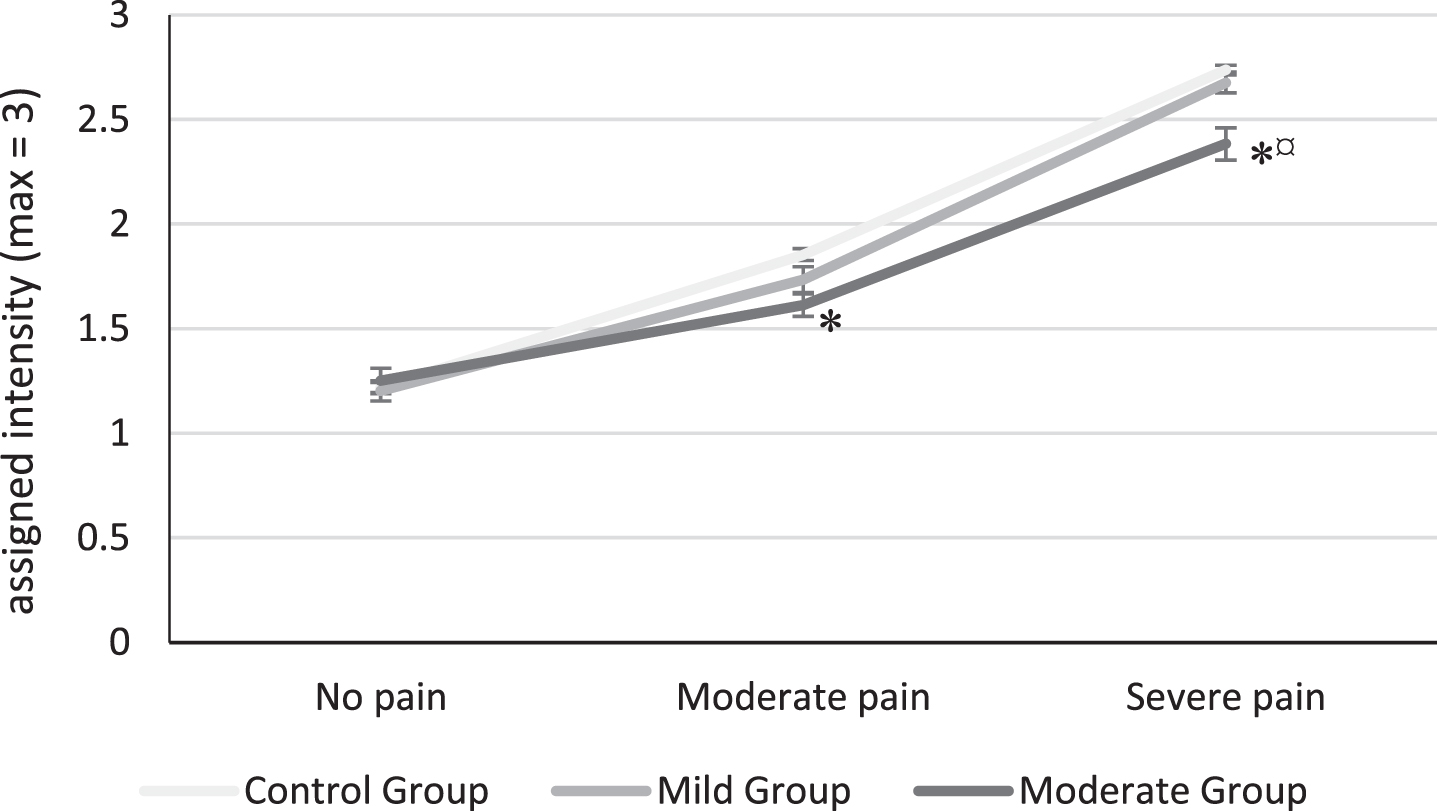
Pain intensity judgment. Mean (±SE). *Significantly differed from controls (p < 0.05). currencySignificantly differed from mild group (p < 0.05).
DISCUSSION
The objective of this research was to study facial expression recognition in mild and moderate AD by integrating pain expression into the protocol. The initial expectations was for patients with AD to have facial expression processing disorder especially for negative emotions and pain expression and that it would be observed in all facial expression processing tasks.
Impairment of identification of facial expressions
In the facial expression identification task, a specific impairment for certain negative emotions was observed. Fear was poorly recognized from the mild stage of AD while disgust and pain were less well-identified from the moderate stage compared to healthy people. These results are consistent with other studies that have also found an early disturbance of fear in a population with amnestic mild cognitive impairment [8, 30] and poor identification of disgust in AD population [5, 31]. The process of identification of joy was preserved, which is consistent with previous studies (e.g., [32]). However, we did not observe a deficit in the recognition of anger, unlike reported in several other studies [1, 31], neither a deficit in the recognition of sadness yet objectified in the study of Maki et al. [32].
The analyses carried out on the expression of pain showed that the dysexecutive disorder and frontal functioning did not significantly explain the impairment of pain recognition. As to whether the pain expression has a specific status among the negative emotions, the results of our study did not clearly show a distinction through the deficit of its recognition in AD. However, the EFA performed on the data set did not associate the recognition of pain with other basic emotions. Indeed, joy, fear, anger, sadness, and disgust were correlated with a common latent factor while the expression of pain and the neutral expression were excluded from this grouping. These results are consistent with the idea of specific processing for the pain expression. Furthermore, previous studies have shown that the identification of the facial expression of pain activates a specific neural network [13, 33]. However, further studies with more participants in each group (AD patients and healthy controls) are necessary to confirm this suggestion for each population. In fact, the samples sizes in the present study were not sufficient to perform the EFA separately for each group.
Underestimation of pain intensity
The pain intensity judgment task showed that the AD patients at the moderate stage underestimated pain intensity using a verbal scale. Oosterman et al. [34] also showed this underestimation of pain in a population with dementia and suggested that it was due to a loss of semantic knowledge about the pain which would make it difficult to use the verbal scale. Borg et al. [35] asked AD patients to estimate the level of pain they would feel if they had experienced the situations presented in the Situational Pain Questionnaire (SP-Q) [36]. The authors found that AD patients had difficulty to judge the intensity of a painful situation with a numerical rating scale, face pain scale, visual analog scale, and simple verbal rating scale. Therefore, AD patients seem to have a deficit in estimating pain intensity from both faces and descriptions of painful situations, and this using any type of scale. Borg et al. [35] suggested that this could be explained by AD patients forgetting their own experiences of painful situations.
Preservation of pain expression matching and pain intensity discrimination
We did not observe any group difference in two tasks involving the comparison of two faces expressing pain. These tasks are mostly based on visuo-perceptual processing. These results suggest that the perception of pain’s units of action as well as their intensity seem to be preserved in AD. Interestingly, the results concerning pain are different from the results showing that AD patients have difficulties in tasks involving matching of basic emotions [5, 37]. Thus, the present findings concerning pain expression might provide a new argument in favor of the specificity of pain processing.
Impairment of processing of pain expression and change in the pain matrix
In sum, overall impairment in the processing of facial expression of pain for mild and moderate AD was not observed and the deficit cannot be explained by a visuo-perceptual deficit of facial emotions. One hypothesis would be that the underestimation of pain intensity on faces may be due to a global impairment of pain judgment as observed with others pain scales [36]. In the pain matrix of Garcia-Larrea and Peyron [14], it is known that the second-order pain matrix, including the activation of the anterior insula and anterior cingulate, previously affected in AD, is necessary for judgment of unpleasantness, but it is also involved in the empathic phenomenon of the pain of others [33, 39]. Specifically, Frot, Mauguière, and Garcia-Larrea showed that the anterior insula responded when emotional faces were presented, particularly those expressing pain and fear, while remaining unresponsive to neutral faces [40]. AD disturbs the affective aspects of pain while the sensitive and discriminating components remain intact [41–43]. Cole et al. [44] show that the recorded neuronal responses of AD patients during experimental pain were increased in the anterior insula and anterior cingulate suggesting more unpleasantness, however their quotation remained underestimated on all scales [35]. Is it a default in the semantical categorization of pain or a deficit in their own experience of painful events? Future works analyzing the link between impaired recognition of pain expression, underestimation of pain scales and the behavioral responses of one’s own pain in AD may evolve the question.
Clinical implications
Some studies have shown that patients with AD report less pain than their counterparts without dementia [45, 46], however, this does not necessarily mean that they experience less pain but rather that the screening scales are probably not adapted to the patient’s abilities. The results suggest the modification of pain expression processing in AD would interfere with the use of scales in pain screening. Patients would tend to underestimate pain on both verbal scales and scales using painful face patterns according to the present study and that of Borg et al. [35]. Due to its intrinsic limitations, this study alone cannot account for the impact of pain processing disorders on the use of self-report scales. However, it may serve as a basis for future work questioning the validity and fidelity of such pain screening tools in AD. Some authors have already undertaken to adapt these types of scales to the abilities of different populations. For example, Kim and Buschmann [47] revised the Facial Pain Scale and validated it in a population of healthy elderly and older people with cognitive impairment. This version of the scale showing 11 faces with different pain intensities showed good psychometric qualities in these populations.
Limitations
One of the limitations of the present study resides in the age difference within the experimental groups. In fact, the COVID-19 pandemic rendered recruitment of old people to the experimental protocols particularly difficult during the period the present study was conducted and still nowadays and prevented from constitute a control group completely equivalent in terms of age. To consider this variability, age factor was included as a covariable in all the analyses. However, other effects linked to our experimental manipulations could have been missed. This may explain the fact that the difference between the groups in recognition of anger and sadness did not reach the significance threshold, which was yet expected.
The Exploratory Factor Analysis has shown some interesting arguments in favor of the existence of processing specificity for pain expression, but the sample is constituted of 57 subjects, which is under the baseline recommended (minimum 5 subjects by parameters). Thus, this finding needs to be replicated on a larger sample.
Memory, executive functions and processing speed have been evaluated in the present study, but an assessment of semantic abilities and pain knowledge that could potentially play a role in recognition performance was missing and prevented from searching for any relation. Future studies should include these evaluations in order to better understand the implication of these capacities in the processing of pain expression in AD.
Finally, analyses of the processing of other emotions in the matching task, the discrimination task and the intensity judgment task were not performed because the experimental manipulation did not allow it. These analyses would have served to determine whether the results observed in these three tasks were specific to pain or not.
In conclusion, AD disrupts the recognition of fear in an early stage and disgust and pain from moderate stage. The disease leads to an underestimation of rating the intensity of pain but with a preservation of its visual-perceptual processing. The facial expression processing of pain seems singular and could be affected either by a disturbed integration of the pain experience itself, by an impairment of semantic and episodic memory capacities related to the experience of pain, or both. Future studies could analyze the link between impaired recognition of pain expression, underestimation in pain scales, and behavioral responses of one’s own pain in AD in order to construct pain self-evaluation tools adapted to this population.
DISCLOSURE STATEMENT
Authors’ disclosures available online (https://www.j-alz.com/manuscript-disclosures/22-0236r2).