
Abstract
Background:
To diagnose mild cognitive impairment (MCI) patients at risk of progression to dementia is clinically important but challenging.
Objective:
We classified MCI patients based on cognitive trajectories and compared biomarkers among groups.
Methods:
This study analyzed amnestic MCI patients with at least three Clinical Dementia Rating (CDR) scores available over a minimum of 36 months from the Alzheimer’s Disease Neuroimaging Initiative database. Patients were classified based on their progression using trajectory modeling with the CDR-sum of box scores. We compared clinical and neuroimaging biomarkers across groups.
Results:
Of 569 eligible MCI patients (age 72.7±7.4 years, women n = 223), three trajectory groups were identified: stable (58.2%), slow decliners (24.6%), and fast decliners (17.2%). In the fifth year after diagnosis, the CDR-sum of box scores increased by 1.2, 5.4, and 11.8 points for the stable, slow, and fast decliners, respectively. Biomarkers associated with cognitive decline were amyloid-β 42, total tau, and phosphorylated tau protein in cerebrospinal fluid, hippocampal volume, cortical metabolism, and amount of cortical and subcortical amyloid deposits. Cortical metabolism and the amount of amyloid deposits were associated with the rate of cognitive decline.
Conclusion:
Data-driven trajectory analysis provides new insights into the various cognitive trajectories of MCI. Baseline brain metabolism, and the amount of cortical and subcortical amyloid burden can provide additional information on the rate of cognitive decline.
INTRODUCTION
Mild cognitive impairment (MCI) is defined as an intermediate clinical state between normal cognition and dementia. MCI is a heterogeneous condition in terms of clinical presentation, etiology, and prognosis. MCI is a clinical diagnosis that considers an individual’s expected level of cognitive function. Diagnosing MCI patients at risk of progression to dementia is clinically important to help patients and their families understand the cause of their cognitive concerns, discuss the prognostic significance of a diagnosis of MCI, and help patients and their families plan for the future. However, there are no uniformly accepted diagnostic criteria for accurately assessing the risk of conversion to dementia.
Annual progression from MCI to dementia has been reported as 5–16%, with lower rates observed in population-based studies and higher rates observed in clinical centers and some treatment trials [1 –3]. The conversion rate also depends on the tracking period. One analysis compared a longer period (>5 years) with a shorter period of studies and found lower rates for a longer follow-up period, suggesting that the risk of conversion decreases over time [4]. Amnestic MCI (aMCI) with anterograde long-term memory impairment is often considered a precursor to Alzheimer’s disease (AD), which is the most common cause of dementia [5]. The presence of cerebral amyloid-β increases the likelihood of MCI due to AD, indicating a higher risk of cognitive decline [6]. However, patients with aMCI do not always reveal AD and sometimes no discernible pathology at autopsy[7, 8].
Amyloid positron emission tomography (PET), is currently used to classify the presence of global cortical amyloid into positive or negative categories. A meta-analysis evaluating the ability of amyloid PET to predict MCI conversion to AD showed that those with positive amyloid have a higher rate of progression to dementia than that of those who do not, with a sensitivity of 93% but lower specificity of 56% [9]. The amount or spatial distribution of cerebral amyloid deposition that can be easily measured in amyloid PET has been overlooked despite the neuropathologically proven spatial and temporal hierarchy of amyloid deposition: amyloid-β accumulation occurs first in the neocortex; then in the subcortical nuclei, including the striatum; and finally in the cerebellum, revealing a downward spreading pattern [10]. Recent neuroimaging studies have shown that the amyloid staging system that considers subcortical amyloid burden predicts rapid cognitive deterioration better than the staging system that considers cortical amyloid only [11, 12].
We hypothesized that the quantification of both cortical and subcortical amyloid in amyloid PET images would be an indicator of cognitive decline in aMCI patients. This study’s primary objective was to classify the longitudinal cognitive trajectories of aMCI using group-based trajectory analysis. The secondary goal was to explore the neuroimaging and cerebrospinal fluid (CSF) biomarkers of participants with MCI according to prognostic trajectories. In particular, we attempted to determine the degree of amyloid deposition using amyloid PETimages.
MATERIALS AND METHODS
Alzheimer’s Disease Neuroimaging Initiative (ADNI) study design
Data used in this study were obtained from the ADNI database (http://adni.loni.usc.edu). The ADNI was launched in 2003 as a public-private partnership led by principal investigator Michael W. Weiner, MD. The primary goal of the ADNI has been to test whether serial magnetic resonance imaging (MRI), PET, other biological markers, and clinical and neuropsychological assessments can be combined to measure the progression of MCI and early AD. The ADNI participants were recruited from more than 50 sites across the USA and Canada. The Regional Ethical Committees of all participating institutions approved the study, and all participants provided written informed consent. The updated information can be found at http://www.adni-info.org.
Study participants
For the trajectory analysis, we selected study participants from the ADNI1, ADNIGO, and ADNI2 cohorts with a follow-up period of ≥36 months and who tested the Clinical Dementia Rating (CDR) at least thrice. Clinical Dementia Rating-sum of boxes (CDR-SB) was measured at 0, 6, 12, 18, and 24 months, then annually. We used the CDR-SB score as an indicator of disease progression. The CDR-SB comprehensively assesses both cognitive and functional disability in dementia patients. By definition, individuals in the aMCI group scored ≥24 on the Mini-Mental State Examination (MMSE) and exhibited objective memory loss (>1 standard deviation [SD] below the normal mean of the delayed recall of the Wechsler Memory Scale Logical Memory II), received a CDR-SB of 0.5, and preserved activities of daily living and the absence of dementia. Thosesuspected to have vascular, traumatic, or inflammatory causes of MCI or any significant neurological disease other than AD were excluded from the study cohort. Detailed inclusion and exclusion criteria for ADNI are provided on the website (http://adni-info.org).
Patients were divided into early- and late-MCI groups based on education-adjusted scores on delayed recall of one paragraph from the Wechsler Memory Scale Logical Memory II. The definition of early MCI is as follows: objective memory loss measured by education-adjusted scores on delayed recall of one paragraph from the Wechsler Memory Scale Logical Memory II (≥16 years: 9–11; 8–15 years: 5–9; 0–7 years: 3–6). Patients with late-MCI were defined as having objective memory loss measured by education-adjusted scores on delayed recall of one paragraph from the Wechsler Memory Scale Logical Memory II (≥16 years: ≤8; 8–15 years: ≤4; 0–7 years: ≤2).
Baseline variables including age, sex, years of education, presence of the apolipoprotein E4 (APOE4) allele, MMSE scores, and Alzheimer’s Disease Assessment Scale-Cognitive 13 (ADAS13) scores were analyzed. Participants with at least one APOE4 allele were considered carriers.
CSF biomarker analysis
The CSF values for amyloid-β42, total tau protein, and phosphorylated tau protein at baseline were generated using a single lot number of novel, fully automated, electrochemiluminescent Elecsys® immunoassays (Roche Diagnostics, Basel, Switzerland) downloaded from a single dataset (UPENNBIOMK9).
Neuroimaging biomarkers of neurodegeneration
Hippocampal volume on MRI and brain metabolism of F-18 fluorodeoxyglucose (FDG) PET were used as neurodegenerative biomarkers, as described in the National Institute on Aging-Alzheimer’s Association Research Framework [13]. Hippocampal volume was divided by the whole-brain volume to reduce individual differences. In FDG PET, the mean metabolism of meta-regions of interest (ROIs)– the left angular, right angular, bilateral posterior cingulate, left inferior temporal, and right inferior temporal gyri– was normalized by dividing it by the pons/vermis reference region mean. Detailed data acquisition and processing methods have been described previously (http://adni.loni.usc.edu/methods).
Neuroimaging biomarker of amyloid pathology
Brain cortical and subcortical amyloid burdens were measured at baseline using F-18 florbetapir (AmyvidTM) PET. The cortical target region was composed of the frontal, anterior/posterior cingulate, lateral parietal, and lateral temporal regions, while the subcortical target region was the putamen. The composite standard uptake value ratio (SUVr) was calculated as follows: mean uptake of the cortical target region divided by the mean uptake of the whole cerebellum. The SUVr of the putamen was calculated similarly. A composite SUVr over 1.11 was considered a positive amyloid scan: which is equivalent to the upper 95% confidence interval above the mean of a group of young normal controls [14]. Detailed data acquisition and processing methods have been described previously (https://adni.loni.usc.edu/methods/pet-analysis-method/pet-analysis/).
Statistical analyses
We used group-based trajectory modeling to identify clinically distinct trajectories of cognitive function [15]. We used the Stata command TRAJ with CDR-SB to identify progression trajectories of cognitive function. TRAJ isolates distinct trajectories and fits a mixed model to calculate the probability of membership in each latent class for each participant. This approach groups individuals with the same cognitive progression trajectory into the same class. Bayesian information criterion was used to select the number of trajectories that best fit the data. Stata/MP 15.1 for Windows (StataCorp., LLC, USA)was used.
The chi-square test was used to compare categorical variables. Continuous variables were expressed as mean±SD. To compare continuous variables based on the trajectory group, we used one-way analysis of variance (ANOVA) with Tukey’s post-hoc test for normally distributed variables and the Kruskal-Wallis test with the Mann-Whitney U test for skewed variables. The Student’s t-test was used to compare SUVr values between APOE4 carriers and non-carriers. Statistical significance was defined as a p value of less than 0.05. SPSS for Windows (version 25.0; SPSS Inc., Chicago, IL, USA) was used for the\enlargethispage 1pt statistical analyses.
RESULTS
Participant characteristics
Data from 569 aMCI patients with a follow-up period of ≥36 months and who were tested for CDR at least trice were analyzed in the study. The mean age was 72.6±7.4 years (range 55 to 88.4 years), 223 (39.2%) were women, and 274 (48.1%) had at least one APOE4 allele. The mean follow-up period for the cohort was 65.9 months (range: 36–156 months).
The trajectory modeling identified three latent prognostic groups among MCI patients. The first group of patients showed stable cognitive function during follow-up: stable group (n = 331, 58.2%). The second group of patients showed relatively slow deterioration of CDR scores during follow-up: slow decliners (n = 140, 24.6%). In the last group, the CDR score deteriorated rapidly and then reached a plateau: fast decliners (n = 98, 17.2%). The changes in CDR scores over time in each group are shown in Fig. 1. The mean CDR-SB scores measured at baseline were 1.1 for the stable group, 1.6 for the slow decliners, and 2.3 for the fast decliners. Compared with the baseline score, the CDR-SB scores over 5 years increased by 0.1 in the stable group, 3.8 in the slow decline, and 9.5 in the fast decline groups. Table 1 shows the CDR-SB values for baseline and years 1, 3, and 5 for each group.
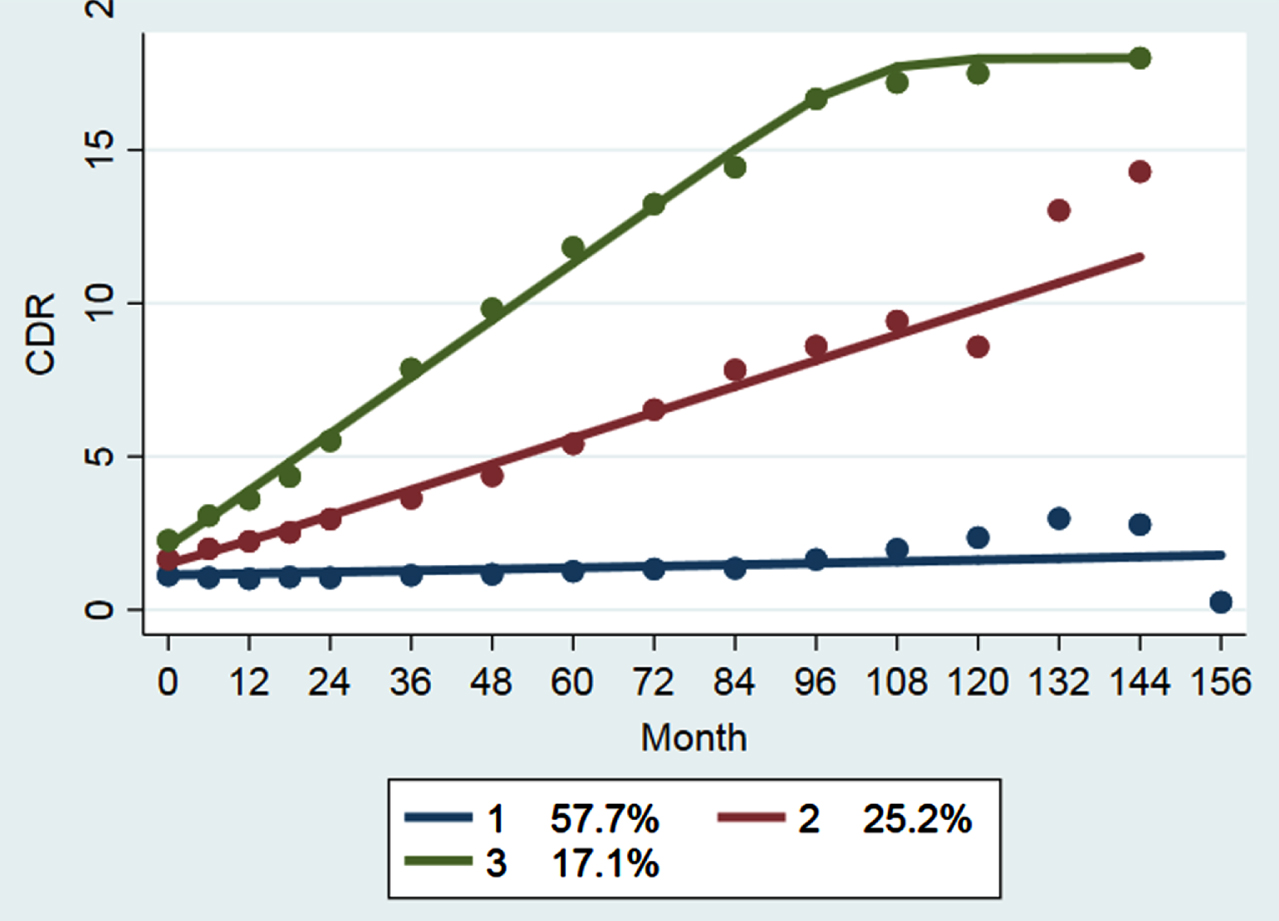
Three latent classes of cognitive trajectories over 13 years. The clinical dementia rating-sum of box score observations in distinct trajectory groups are presented as means. Group 1 (bottom line) stable group; Group 2 (middle line) slow decliner group; Group 3 (top line) fast decliner group.
Mean clinical dementia rating-sum of boxes score at each follow-up
n, number. Data are represented as means (ranges).
Factors related to the cognitive decline rate in aMCI: fast cognitive decline is associated with the high amyloid uptake of the putamen
The factors associated with trajectory groups are listed in Table 2. The participants in the fast decline group were older than those in the stable decline group (p = 0.002). Compared with the stable group, the prevalence of APOE4 carriers was higher in the slow and fast decliners (p < 0.001). The amount of CSF amyloid-β 42 was lower in the slow or fast decliners than in the stable group (p < 0.001). CSF measurements of total tau and phosphorylated tau protein were higher in the slow or fast decliners than in the stable group (p < 0.001). Amyloid-β42, total tau, and phosphorylated tau protein in the CSF were not associated with the rate of cognitive decline. Hippocampal volume was lower in the slow and fast decliners than in the stable group (p < 0.001) but there was no statistical difference between slow and fast decliners.
Demographic, cognitive, and biomarker data of participants with amnestic mild cognitive impairment classified by cognition trajectory
n, number; APOE4, Apolipoprotein E4; MCI, mild cognitive impairment; MMSE, Mini-Mental State Examination; ADAS13, Alzheimer’s disease assessment scale-cognitive 13; CDR-SB, clinical dementia rating-sum of boxes; SUVr of metaROI, standardized uptake value ratio calculated as follows: mean of the metaROI (left angular, right angular, bilateral posterior cingulate, left inferior temporal, and right inferior temporal gyri) divided by the mean of the pons/vermis reference region; composite SUVr, standardized uptake value ratio calculated as follows: the mean uptake of the cortical target region (frontal, anterior/posterior cingulate, lateral parietal, and lateral temporal region) divided by the mean uptake of the whole cerebellum; putamen SUVr, standardized uptake value ratio calculated as follows: the mean uptake of the bilateral putamen divided by the mean uptake of the whole cerebellum. Data are presented as means±standard deviations or numbers (%). The chi-square test was used to compare categorical variables. To compare continuous variables, one-way ANOVA with post-hoc Tukey’s test was used; a p < 0.05, compared to stable; b p < 0.05, compared to slow decliner; c p < 0.05, compared to fast decliner. *ADAS13 was tested in 330 stable, 139 slow, and 97 fast decliners.
Cerebral metabolism was associated with cognitive decline and the rate of decline (stable 1.30±0.11, slow decliner 1.20±0.10, and fast decliner 1.12±0.10; p < 0.001). Amyloid PET was performed on 305 participants. Among the 147 negative amyloid scans, 133 (90.5%) were in the stable group. The amount of amyloid deposition identified by PET imaging is associated with cognitive decline and the rate of cognitive decline. The SUVr on amyloid PET was higher in the group with a faster rate of cognitive decline than in the other groups. This trend was confirmed not only in the cortical target region (p < 0.001) but also in the putamen (p < 0.001).
Amyloid deposits were higher in APOE4 carriers than in non-carriers for both composite SUVr (p < 0.001) and putamen SUVr (p < 0.001) (Table 3). In APOE4 non-carrier subjects, there was a statistically significant difference in composite amyloid quantification between the trajectory groups, H(2) = 10.218, p = 0.006, with a mean rank score of 80.07 for the stable, 82.44 for the slow, and 128.18 for the fast. There was a statistically significant difference in putamen amyloid quantification between the trajectory groups, H(2) = 15.443, p < 0.001, with a mean rank score of 78.12 for the stable, 93.41 for the slow, and 135.73 for the fast. In APOE4 carrier subjects, cognitive stable group showed lower brain amyloid than decliner groups. The amount of brain amyloid according to specific genotype is shown in Table 4 and Fig. 2.
Comparison of biomarkers between apolipoprotein E4 carrier group and non-carrier group
Metabolism, standardized uptake value ratio of metaROI in FDG PET calculated as follows: mean of the metaROI (left angular, right angular, bilateral posterior cingulate, left inferior temporal, and right inferior temporal gyri) divided by the mean of the pons/vermis reference region; composite amyloid, standardized uptake value ratio in amyloid PET calculated as follows: mean uptake of the cortical target region (frontal, anterior/posterior cingulate, lateral parietal, and lateral temporal region) divided by the mean uptake of the whole cerebellum; putamen amyloid, standardized uptake value ratio in amyloid PET calculated as follows: mean uptake of the bilateral putamen divided by the mean uptake of the whole cerebellum. Data are presented as means±standard deviations. The Kruskal-Wallis test with the Mann-Whitney U test was used for non-carrier group and the one-way ANOVA with Tukey’s post-hoc test was used for Carrier group; a p < 0.05, compared to stable; b p < 0.05, compared to slow decliner; c p < 0.05, compared to fast decliner.
Apolipoprotein E Genotype and Brain Amyloid Quantification in Each Cognitive Trajectory Group
APOE, Apolipoprotein E; PET, positron emission tomography; SUVr, standardized uptake value ratio; composite SUVr, standardized uptake value ratio calculated as follows: mean uptake of the cortical target region (frontal, anterior/posterior cingulate, lateral parietal, and lateral temporal region) divided by the mean uptake of the whole cerebellum; putamen SUVr, standardized uptake value ratio calculated as follows: mean uptake of the bilateral putamen divided by the mean uptake of the whole cerebellum. There was no patient showing APOE 2/2 genotype. Data are presented as means±standard deviations.
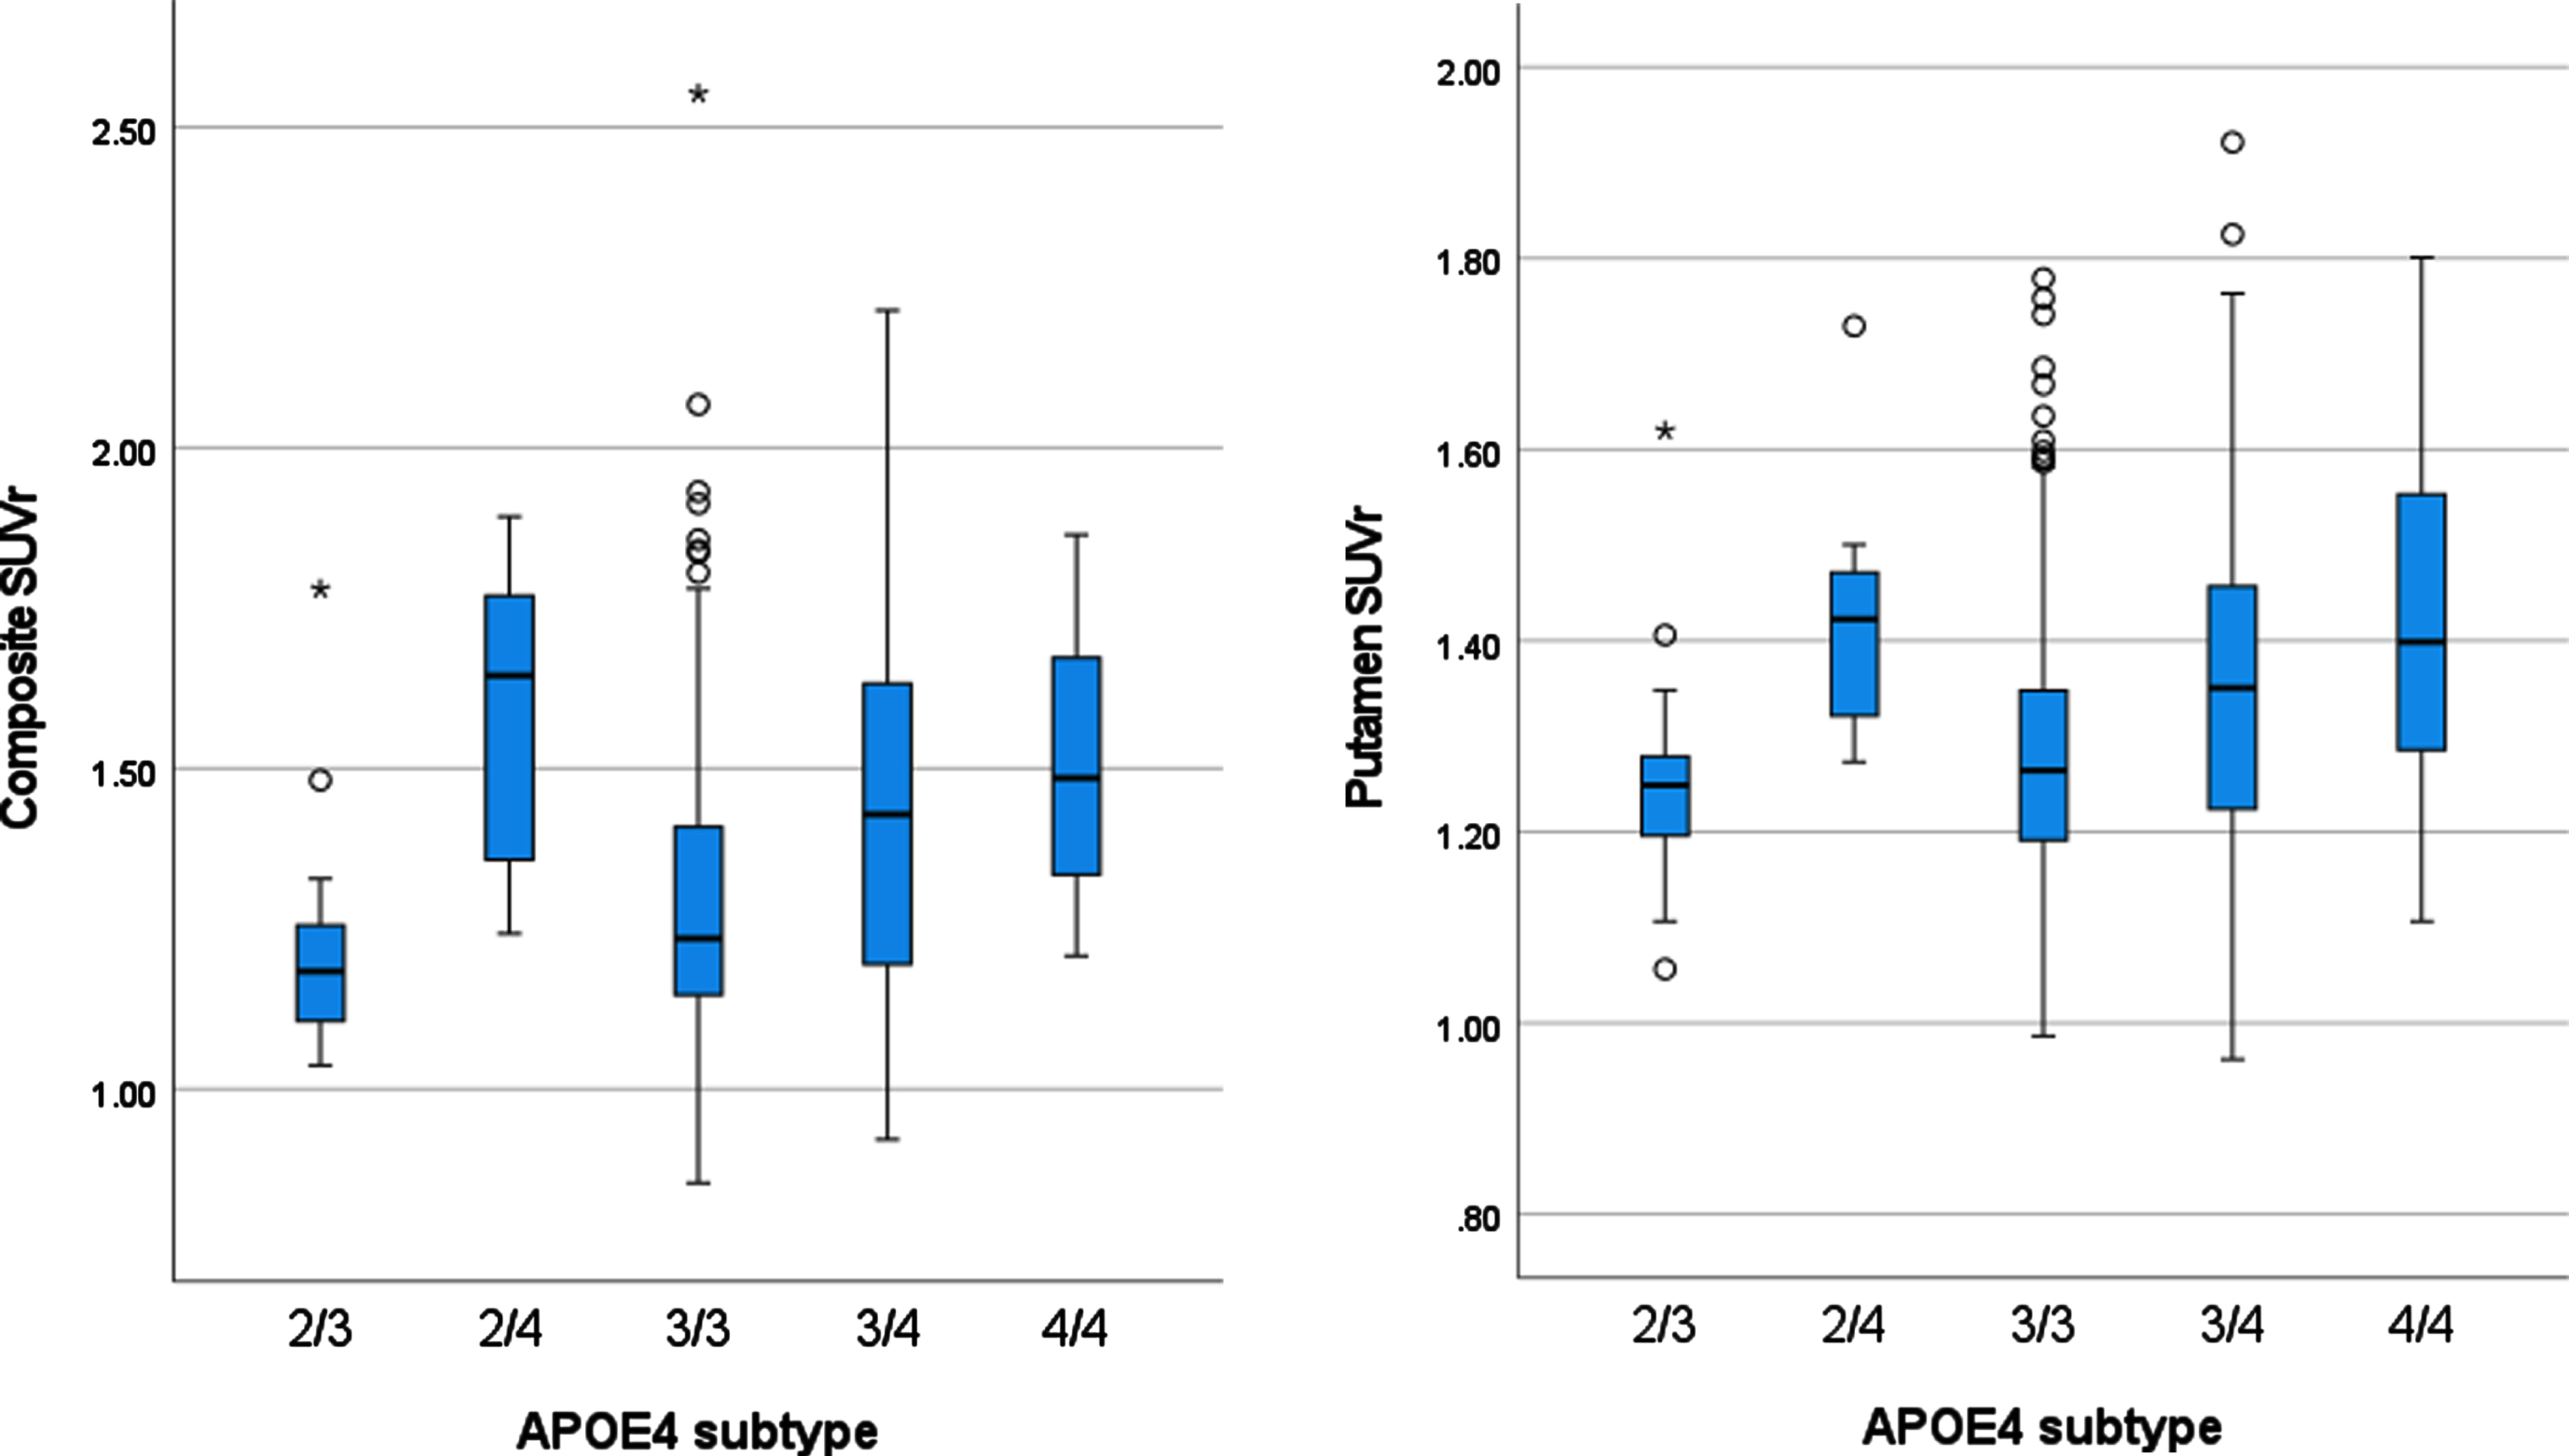
Apolipoprotein E genotype and brain amyloid quantification. SUVr, standardized uptake value ratio; composite SUVr, standardized uptake value ratio calculated as follows: mean uptake of the cortical target region (frontal, anterior/posterior cingulate, lateral parietal, and lateral temporal region) divided by the mean uptake of the whole cerebellum; putamen SUVr, standardized uptake value ratio calculated as follows: mean uptake of the bilateral putamen divided by the mean uptake of the whole cerebellum.
Factors related to cognitive decline rate in cortical amyloid-positive aMCI
We performed a subgroup analysis on 158 participants with positive amyloid scans (Table 5). Among these, 89 (56.3%) showed stable cognitive function. There was no statistical difference in age between the three trajectory groups. Amyloid-β42 (p = 0.002), total tau (p < 0.001), and phosphorylated tau (<0.001) protein levels in the CSF were associated with cognitive decline but not with the rate of cognitive decline. The hippocampal volume was lower in the slow or fast decliners than in the stable group (p < 0.001) but there was no statistical difference between the slow and fast decliners.
Subgroup demographic, cognitive, and biomarker data of participants with amnestic mild cognitive impairment with amyloid-positive PET classified by cognition trajectory
Cerebral metabolism was associated with cognitive decline and the rate of decline. Cerebral metabolism showed a lower value with faster cognitive decline (stable 1.30±0.11, slow decliner 1.22±0.10, and fast decliner 1.14±0.11; p < 0.001). The composite SUVr of the amyloid scan was higher in the fast decliner group than in the other two groups (p < 0.001). There was no statistical difference between the stable and slow decliner groups. The amount of amyloid in the putamen was significantly higher in the slow or fast decliners than in the stable group (p < 0.001) (Fig. 3).
n, number; APOE4, Apolipoprotein E4; MCI, mild cognitive impairment; MMSE, Mini-Mental State Examination; ADAS13, Alzheimer’s disease assessment scale-cognitive 13; CDR-SB, clinical dementia rating-sum of boxes; SUVr of metaROI, standardized uptake value ratio calculated as follows: mean of the metaROI (left angular, right angular, bilateral posterior cingulate, left inferior temporal, and right inferior temporal gyri) divided by the mean of the pons/vermis reference region; composite SUVr, standardized uptake value ratio calculated as follows: the mean uptake of the cortical target region (frontal, anterior/posterior cingulate, lateral parietal, and lateral temporal region) divided by the mean uptake of the whole cerebellum; putamen SUVr, standardized uptake value ratio calculated as follows: the mean uptake of the bilateral putamen divided by the mean uptake of the whole cerebellum. Data are presented as means±standard deviations or numbers (%). The chi-square test was used to compare categorical variables. To compare continuous variables, one-way ANOVA with post-hoc Tukey’s test was used; a p < 0.05, compared to stable; b p < 0.05, compared to slow decliner; c p < 0.05, compared to fast decliner.

Quantification of the amyloid accumulation in the putamen according to the cognitive trajectories among participants with cortical amyloid-positive MCI. The standard uptake value ratio (SUVr) of the putamen was 1.38±0.15 in the stable group (1), 1.49±0.14 in the slow decliner group (2), and 1.53±0.16 in the fast decliner group. The amount of amyloid accumulation in the putamen was significantly higher in the decliner groups than in the stable group (p < 0.001). * p values from post-hoc Tukey analysis compared with the stable group.
DISCUSSION
We demonstrated three prognostic groups of aMCI patients using trajectory analysis with the CDR score as a variable. Of the 569 participants, 58.2% showed stable cognitive function, 24.6% showed slow cognitive function decline, and 17.2% showed fast cognitive function decline over 5 years. Five years after diagnosis, CDR scores were 1.2, 5.4, and 11.8 in the stable group, slow decliners, and fast decliners, respectively. CSF biomarkers, hippocampal volume, cortical metabolism, and amyloid deposition were associated with cognitive decline in aMCI patients. CSF biomarkers and hippocampal volumes were associated with cognitive decline, but not with the rate of cognitive decline. The amount of amyloid deposition and cortical metabolism are associated with both cognitive decline and rate of cognitive decline. The faster the cognitive decline, the higher the amyloid deposition in the cortical and subcortical tissues. This trend was also observed in participants with positive amyloid scans.
Trajectory analysis revealed diverse prognoses in aMCI patients. A recent study in which trajectory analysis was performed on 278 aMCI patients identified stable (61.8%), slow decliner (31.7%), and fast decliner (6.5%), similar to our study [16]. MCI is considered the symptomatic pre-dementia stage on the continuum of cognitive decline. However, the dementia risk estimates varies for MCI patients (from <5% to 20% annual conversion rates) depending on the population studied [17, 18]. Up to two-thirds of patients with aMCI have underlying AD pathology, 15% –25% have neurodegenerative diseases other than AD, and the remainders have normal age-related changes [19 –21]. In the ADNI, a multicenter observational study, participants were diagnosed with MCI based on a single episodic memory measure, subjective cognitive complaints, normal performance on a screening measure of global cognition, and a clinician’s judgment of mild impairment based on a semi-structured clinical interview [22]. This conventional diagnostic method, which is the standard procedure for clinical trials and large-scale studies of MCI, is limited, given its high susceptibility to false-positive diagnostic errors [23].
Various trajectories in patients with MCI can be explained by that they may have different pathologic processes or may be at different stages of the same disease course of AD. Patients diagnosed with MCI exist at various positions in the spectrum of disease progression. In each trajectory group, there were small but significant differences in MMSE, ADAS-13, and CDR-SB scores. These scales do not have a linear relationship with time. The measures show the most rapid changes over time in the midrange [24, 25]. A recent study reported that pre-dementia patients show accelerated cognitive decline as they get closer to being diagnosed with dementia [26]. Taken together, it can be inferred that the fast decliners in our study exists later in the same disease course compared to the slow decliners.
The deposition of amyloid-β is one of the pathological hallmarks of AD. MCI patients with positive amyloid scans have a higher rate of progression to dementia than do those without [27]. The risk of progression to probable AD in aMCI patients within 36 months are 2.3 folds higher on positive amyloid scans than on negative scans [28]. The dichotomous evaluation of the amyloid scan is straightforward, but misses a lot of information. We showed that the rate of cognitive decline in aMCI patients was associated with the amount of brain amyloiddeposition. A recent study showed that amyloid PET staging based on cortical tracer uptake is associated with cognitive impairments [29]. In addition to cortical amyloid deposition, the amount of striatal amyloid deposition was associated with cognitive decline. This result was also confirmed in the amyloid positive subgroup. Striatal amyloid measurement can predict cognitive decline better than cortical amyloid can [11]. Striatal amyloid-β plaques are considered predictors of higher Braak neurofibrillary tangle stages [30, 31] and worse cognitive impairment [12 , 33]. Pathological tau protein accumulation occurs only when striatal amyloid-β accumulation emerged [34]. Quantification methods assessing both cortical and subcortical amyloids can be considered to overcome the low specificity of amyloid PET imaging.
We selected the putamen as the target for subcortical amyloid deposition to evaluate advanced-stage cerebral amyloidosis, in contrast to previous studies [11, 12]. The putamen is easy to measure amyloid burden (both quantitatively and visually) and is expected to be less affected by the partial volume effect because of relatively large size and low background uptake. We showed that the amyloid burden in the putamen was higher in the decliner groups than in the stable group. However, among amyloid-positive patients, amyloid levels measured in the putamen showed no statistical difference between the slow and fast decliners. This finding can be explained by the small variability of the later amyloid pathology due to the ceiling effect [35].
The presence of the APOE4 is considered a sporadic genetic risk factor for AD. The rate of disease progression was higher in APOE4 carriers than in APOE4 non-carriers (39.5% versus 16.8%). APOE4 genotype was associated with increased amyloid burden as in previous studies [36, 37]. In both APOE4 non-carriers and carriers, the trend was confirmed that the faster the cognitive decline, the higher the amount of amyloid. However, the average amyloid burden of APOE4 carriers with stable cognitive function was higher than that of APOE4 non-carriers with slow decline in cognitive function. APOE4 non-carrier slow decliners showed a relatively low amyloid burden, suggesting that the primary driver of cognitive decline in this group may be non-AD pathology. Amyloid accumulation is slow and protracted, likely to extend for more than two decades [38]. APOE4 effects on faster amyloid accumulation in early phase rather than total amyloid burden [39]. Moderate amyloid deposition of the APOE4 carrier with stable cognitive function suggests early AD pathology of the preclinical phase in this group. Fast decliner without APOE4 and slow and fast decliners with APOE4 showed high amyloid burden. Saturated amyloid pathology in those groups of patients suggests the main driver of cognitive decline in those groups may be AD pathology. Since this study was conducted with a relatively small number of subgroup patients in decliner groups, further study is needed in a large group.
Our results showed that cognitive decline is associated with a small hippocampal volume and decreased cortical metabolism. Cortical metabolism showed a greater decrease in the group with rapid cognitive decline, but the hippocampal volume did not. MRI-based hippocampal volume and FDG PET-based glucose metabolism are indicators of neurodegeneration. These neurodegenerative markers are strongly associated with cognitive decline [40, 41]. Most elderly individuals have multiple brain pathologies [42] and most brains of AD patients show multiple pathologies, including pathological processes that can clinically mimic AD [43]. The presence of additional pathologies is associated with a greater risk of accelerated cognitive decline [44, 45]. Among patients with intermediate to high AD pathological changes, one-third to half showed mixed pathology, and the most common co-pathology was limbic-predominant age-related TDP-43 (LATE) encephalopathy [44]. Hippocampal atrophy is greater in cases with LATE than in those with pure AD [46, 47]. Furthermore, an FDG PET measure (the ratio of inferior to medial temporal metabolism) was elevated in autopsy-proven LATE with hippocampal sclerosis compared with autopsy-proven AD cases lacking LATE [48]. In our study, the cognitive decline group had advanced stages of amyloid pathology than the stable group. Advanced amyloid stage suggests an increased likelihood of advanced AD pathology and co-pathology. Future studies using pathological correlation or specific neuroimaging, such as tau PET, are needed.
This study had several limitations. First, we analyzed longitudinal data from a large prospective cohort recruited for a dementia study, and the diagnosis of MCI was limited to aMCI, which is considered a prodrome of AD dementia. However, 30% of aMCI patients who progress to dementia have a primary brain pathology that is not AD [7]. AD may be responsible for the cognitive decline in MCI in this study, but other pathological characteristics may also be the primary driver. Second, we found an association between amyloid quantification on the florbetapir PET scan and faster cognitive decline. Three different F-18-labeled amyloid PET tracers developed and obtained clinical approval. These tracers have different chemical structures and affinities for neuritic and diffuse plaques [14]. Further studies using other tracers are required to confirm this finding. Finally, the effect of 6 APOE genotypes on amyloid deposition could not be fully analyzed. The amyloid levels correspond closely to APOE genotype, a follow-up study involving sufficient number of patients isessential.
Conclusion
We have showed the diverse prognoses of participants diagnosed with MCI using group-based trajectory analyses. Amyloid quantification in the cortical and subcortical areas and cortical metabolism may be predictors of cognitive prognosis in MCI patients. Accurate diagnosis and clinical course prediction of MCI are important for determining the timing of appropriate consultation and therapeutic intervention. The results of this study support the identification of MCI patients who are at an increased risk of cognitive decline using amyloid PET and FDG PET.
Footnotes
ACKNOWLEDGMENTS
The authors have no acknowledgments to report.
FUNDING
Data collection and sharing for this project were funded by the Alzheimer’s Disease Neuroimaging Initiative (ADNI) (National Institutes of Health Grant U01 AG024904) and DOD ADNI (Department of Defense award number W81XWH-12-2-0012). ADNI is funded by the National Institute on Aging, the National Institute of Biomedical Imaging and Bioengineering, and through generous contributions from the following: AbbVie, Alzheimer’s Association; Alzheimer’s Drug Discovery Foundation; Araclon Biotech; BioClinica, Inc.; Biogen; Bristol-Myers Squibb Company; CereSpir, Inc.; Cogstate; Eisai Inc.; Elan Pharmaceuticals, Inc.; Eli Lilly and Company; EuroImmun; F. Hoffmann-La Roche Ltd and its affiliated company Genentech, Inc.; Fujirebio; GE Healthcare; IXICO Ltd.; Janssen Alzheimer Immunotherapy Research & Development, LLC.; Johnson & Johnson Pharmaceutical Research & Development LLC.; Lumosity; Lundbeck; Merck & Co., Inc.; Meso Scale Diagnostics, LLC.; NeuroRx Research; Neurotrack Technologies; Novartis Pharmaceuticals Corporation; Pfizer Inc.; Piramal Imaging; Servier; Takeda Pharmaceutical Company; and Transition Therapeutics. The Canadian Institute of Health Research provides funds to support ADNI clinical sites in Canada. Private sector contributions were facilitated by the Foundation for the National Institutes of Health (![]() ). The grantee organization was the Northern California Institute for Research and Education, and the study was coordinated by the Alzheimer’s Therapeutic Research Institute at the University of Southern California. The ADNI data were disseminated by the Laboratory for Neuro Imaging at the University of Southern California.
). The grantee organization was the Northern California Institute for Research and Education, and the study was coordinated by the Alzheimer’s Therapeutic Research Institute at the University of Southern California. The ADNI data were disseminated by the Laboratory for Neuro Imaging at the University of Southern California.
CONFLICT OF INTEREST
The authors have no conflicts of interest to disclose.