
Abstract
Background:
Mini-Mental State Examination (MMSE) and Montreal Cognitive Assessment (MoCA) are two commonly used cognitive screening and diagnostic tools.
Objective:
Our goal was to assess their efficacy for monitoring cognitive changes, as well as the correlation between the two tests.
Methods:
At baseline, participants in the Alzheimer’s Disease Neuroimaging Initiative (ADNI) were divided into four groups based on their cognitive diagnoses: healthy control (HC), early mild cognitive impairment (EMCI), late mild cognitive impairment (LMCI), and Alzheimer’s disease (AD). MMSE or MoCA scores were compared among the four groups using an analysis of variance (ANOVA) model with repeated measures with post-hoc Bonferroni correction. For those participants who had both MMSE and MoCA assessments done, a Pearson correlation analysis was performed between the two assessments for each visit.
Results:
The MMSE scores were significantly different among the four groups at baseline, which was true for each of the three annual follow-up visits. By contrast, the MoCA scores were not significantly different between HC and EMCI groups at either baseline or any of the follow-up visits. For participants with a diagnosis of LMCI, the cognitive performance deteriorated in a linear manner 12 months after the baseline, which was independent of MMSE or MoCA. At last, the MMSE scores were moderately related to MoCA scores, which got stronger along with the time of follow-up.
Conclusion:
MMSE and MoCA are comparable as cognitive assessment tools to monitor cognitive changes. In addition, the measurements of MMSE and MoCA are moderately correlated for the follow-up visits.
Keywords
INTRODUCTION
Alzheimer’s disease (AD), the most common neurodegenerative disease, is characterized by a progressive cognitive decline that is sometimes accompanied by personality changes. The spectrum of AD development can be divided into three sequential stages: preclinical, mild cognitive impairment (MCI), and dementia [1]. MCI is an early symptomatic stage, which is usually seen in elderly patients between 65 and 79 years of age and characterized by the presentation of subtle problems with certain cognitive functions including language and memory. During the MCI stage, pathological AD biomarkers often become detectable. The concepts of early MCI (EMCI) and late MCI (LMCI) were first introduced roughly a decade ago by the Alzheimer’s Disease Neuroimaging Initiative (ADNI) [2]. Compared to LMCI, which is characterized by a more progressive state of decline, individuals with EMCI exhibit a lesser degree of cognitive impairment and pathological AD biomarker changes. Detection of EMCI is imperative to ensure timely clinical intervention to prevent further cognitive deterioration.
To assess the severity of AD-related cognitive impairments, several cognitive screening tests are available including the Mini-Mental State Examination (MMSE) and the Montreal Cognitive Assessment (MoCA) [3]. The MMSE is the most widely used tool for measuring cognitive performance and highly influenced by an individual’s level of education [4]. By contrast, the MoCA is a newer assessment that was reported to have a greater sensitivity for detecting MCI [5]. Both tests have been used globally to measure cognitive function and adapted across different languages [6, 7]. Further, both assessments are relatively brief, and usually can be completed within 10 min [5]. To date, most studies using MMSE or MoCA as tools to measure cognitive performance had limitations due to small sample size [8], cross-sectional design [9], or loss of follow-up with a longitudinal study design [10]. The MoCA was also reported to be a superior tool for detecting dementia [5, 11] or earlier stages of cognitive decline [12] than the MMSE.
In order to achieve a better understanding of the diagnostic capabilities of these established cognitive assessment tools, we aimed to investigate how MMSE and MoCA can be used to monitor cognitive changes. Due to the similarities, one of these tests is usually adopted for measuring cognitive performance clinically to avoid redundancy. In addition, neither MMSE nor MoCA has been reported if they can be used to differentiate EMCI from LMCI. Our findings will be meaningful for those who want to use either test or both for their clinical or research purposes. We hypothesized both tests can differentiate EMCI from LMCI and wanted to compare their efficacy for detecting EMCI. We also aimed to ascertain the correlation between MMSE and MoCA scores from data collected from the same group of participants at multiple visits (baseline and 3 annual follow-up visits).
METHODS
Standard protocol approvals, registrations, and patient consents
Written informed consent was obtained from all participants (or guardians of participants) participating in the study (consent for research). The IRB approval was obtained from each participating clinical/research site.
ADNI
Data collected from participants in the Alzheimer’s Disease Neuroimaging Initiative (ADNI) were used with taking advantage of its longitudinal study design. All data were downloaded from the ADNI database (http://adni.loni.usc.edu) on October 6, 2019. The ADNI was launched in 2003 as a public-private partnership, led by Principal Investigator Michael W. Weiner, MD. The primary goal of the ADNI has been to test whether serial magnetic resonance imaging, positron emission tomography, biomarkers, and clinical and neuropsychological assessment can be combined to measure the progression of MCI and early AD [2]. In the first three phases (1, GO, and 2), the ADNI recruited over 1,700 adult participants from over 50 sites across the United States and Canada (Fig. 1). The participants were people aged 55 to 90 years old, and who each had different cognitive diagnosis at the baseline visit. Further information about this parent study can be found at http://www.adni-info.org/ and in previous reports [2, 13–17].

The Flow Chart of Study Design.
APOE genotyping
Apolipoprotein E (APOE) genotyping was done using DNA from blood samples collected from ADNI participants. For ADNI-1 participants, APOE genotyping was done through polymerase chain reaction (PCR) amplification, Hhal restriction enzyme digestion, and subsequent standard gel resolution processes [18, 19]. For ADNI-GO and ADNI-2 participants, genotyping was carried out by Prevention Genetics and LGC Genomics. Prevention Genetics employed array processing using allele-specific PCR with universal molecular beacons [20, 21]. At LGC Genomics, assays were performed using competitive allele-specific PCR, enabling bi-allelic scoring of single nucleotide polymorphisms. Genotypes were called and returned to the ADNI Genetics Core after manual quality control. As APOE ɛ4 is the largest genetic risk factor known for AD, the data for APOE ɛ4 carrier status were reported together with other demographic information: sex, age, and education for the participants.
Baseline cognitive diagnosis
For ADNI phase 1, participants were recruited with three cognitive diagnoses at baseline: healthy control (HC), MCI, and AD. The recruitment criteria for HC participants included MMSE scores between 24–30 (inclusive), a Clinical Dementia Rating (CDR) of 0, non-depressed, no diagnosis of either MCI or dementia. The recruitment criteria for participants with MCI included MMSE scores between 24–30 (inclusive), a memory complaint, having an objective memory loss measured by education adjusted scores on Wechsler Memory Scale Logical Memory II, a CDR of 0.5, absence of significant levels of impairment in other cognitive domains, essentially preserved activities of daily living, and an absence of dementia. The key eligibility criteria for enrolling HC and MCI participants can be found here: (https://adni.loni.usc.edu/wp-content/themes/freshnews-dev-v2/documents/clinical/ADNI-1_Protocol.pdf). The recruitment criteria for participants with AD included MMSE scores between 20–26 (inclusive), CDR of 0.5 or 1.0, and meeting NINCDS/ADRDA criteria for probable AD.
For phases GO and 2, the diagnosis of MCI was separated into EMCI and LMCI. The enrollment criteria for EMCI were similar with the MCI for ADNI phase 1. However, more pathological biomarker data together with cognitive impairment were used to define its early stage for the MCI. By contrast, the LMCI diagnosis for phases GO and 2 was the same as the MCI diagnosis for ADNI 1.
For phase 2, significant memory concern (SMC) was added as one separate category of baseline cognitive diagnosis. Participants with SMC had self-reported memory concern, quantified by using the Cognitive Change Index and the CDR of Zero. However, they scored normally for cognitive tests, and the informant did not equate the expressed concern with progressive memory impairment.
The detailed information on baseline cognitive diagnosis and APOE genotype was provided in Table 1 for those participants whose MMSE data were available for our analysis. Since cognitive diagnoses of SMC, EMCI, and LMCI were added after the ADNI phase 1, participants with cognitive diagnoses of SMC and HC were combined into one group: Cognitively normal (CN) for our data analysis purpose. As such, EMCI and LMCI were also combined into the MCI group (Table 1). For these comparisons, the sample sizes varied based on the availability of data.
Demographic and genetic information of participants with MMSE measurements
AD, Alzheimer’s disease; EMCI, early mild cognitive impairment; HC, healthy control; LMCI, late mild cognitive impairment. Both age and education were shown in the format of mean±SD.
Cognitive measures
The MMSE is a widely used test of cognitive function among the elderly; it includes tests of orientation, attention, memory, language, and visual-spatial skills. The MoCA is another commonly used cognitive test to examine the cognitive function in orientation, short-term memory, focus and spatial awareness, language, and concentration. Both tests have a maximal score of 30. Raw data was downloaded from the ADNI website: http://adni.loni.usc.edu/. Item scores were summed to obtain a total score for either MMSE or MoCA for each participant. If one test was performed multiple times during a single visit, an average of the scores from the multiple tests were used. Scores for MMSE and MoCA from participants were chosen at the following visits: baseline or screening visit, 12 months (M12), 24 months (M24), and 36 months (M36). A correlation analysis between MMSE and MoCA was performed in a subset of participants who have done both tests for each visit during the follow-up of 36 months.
Data analysis
SPSS (version 26.0) was used to conduct all statistical analyses. A one-way analysis of variance (ANOVA) was used to compare age at baseline or education among the baseline diagnosis groups (Tables 1 and 3). Chi-square tests were used to examine the relationship of the APOE genotype with either sex or race (Tables 1and 3). For comparing MMSE or MoCA scores among different diagnosis groups, an ANOVA model with repeated measures was used with post-hoc Bonferroni correction. Baseline age, gender, and level of education were used as covariates. For MMSE, an ANOVA model with repeated measures was used to compare the four groups (HC, EMCI, LMCI, and AD). For MoCA, an ANOVA model with repeated measures was used to compare the three groups (HC, EMCI, and LMCI). For either MMSE or MoCA, the measures were compared at each of the four time points (baseline/screening time, M12, M24, and M36) among the baseline diagnosis groups. A Pearson correlation analysis was performed for MMSE and MoCA data for participants with both data available at screening visit as well as three annual follow-up visits. In addition, a receiver-operating characteristic (ROC) analysis was performed to compare how MMSE and MoCA work as tools to differentiate the HC and LMCI group. Data were shown in the form of mean±standard deviation for numerical data, and p < 0.05 was considered as significant for all statistical analyses.
Demographic and genetic information of participants with MoCA assessments
EMCI, early mild cognitive impairment; HC, healthy control; LMCI, late mild cognitive impairment. Both age and education are shown in the format of mean±SD.
Data availability statement
Data and analytical methods are carefully documented for the performed study. Any data-sharing request can only be submitted to the ADNI for approval purposes.
RESULTS
For all participants who had their MMSE data available for all the visits (baseline, M12, M24, and M36), their demographic information (age, sex, and education) as well as APOE ɛ4 genotype were compared among groups with different baseline cognitive diagnoses (HC, EMCI, LMCI, and AD) at the baseline (Table 1).
The results of the ANOVA for repeated measures indicated baseline diagnosis had significant effects on MMSE along the follow-up time points (Wilks’ Lambda = 0.84, F = 14.28, p < 0.001, η2 = 0.055). Follow-up comparisons indicated, at the baseline, the MMSE scores were significantly different from each other among different diagnosis groups of HC, EMCI, LMCI, and AD, and p < 0.001 for any two comparison groups (Table 2). Similarly, participants from all four groups had significantly different MMSE average scores at each of three annual follow-up visits (Table 2 and Fig. 2). During the follow-up of three years, MMSE scores were stable for either the HC or the EMCI groups (the average change in MMSE was less than 0.5 point for the follow-up period of 36 months). By contrast, the cognitive performance for LMCI group deteriorated along the follow-up (y=–0.881x+28.385). As expected, the AD group had a faster rate of cognitive deterioration than the LMCI group during the same period of follow-up (y=–2.05x+25.65) (Fig. 2).
MMSE scores were compared among groups with different baseline cognitive diagnoses
AD, Alzheimer’s disease; EMCI, early mild cognitive impairment; HC, healthy control; LMCI, late mild cognitive impairment.
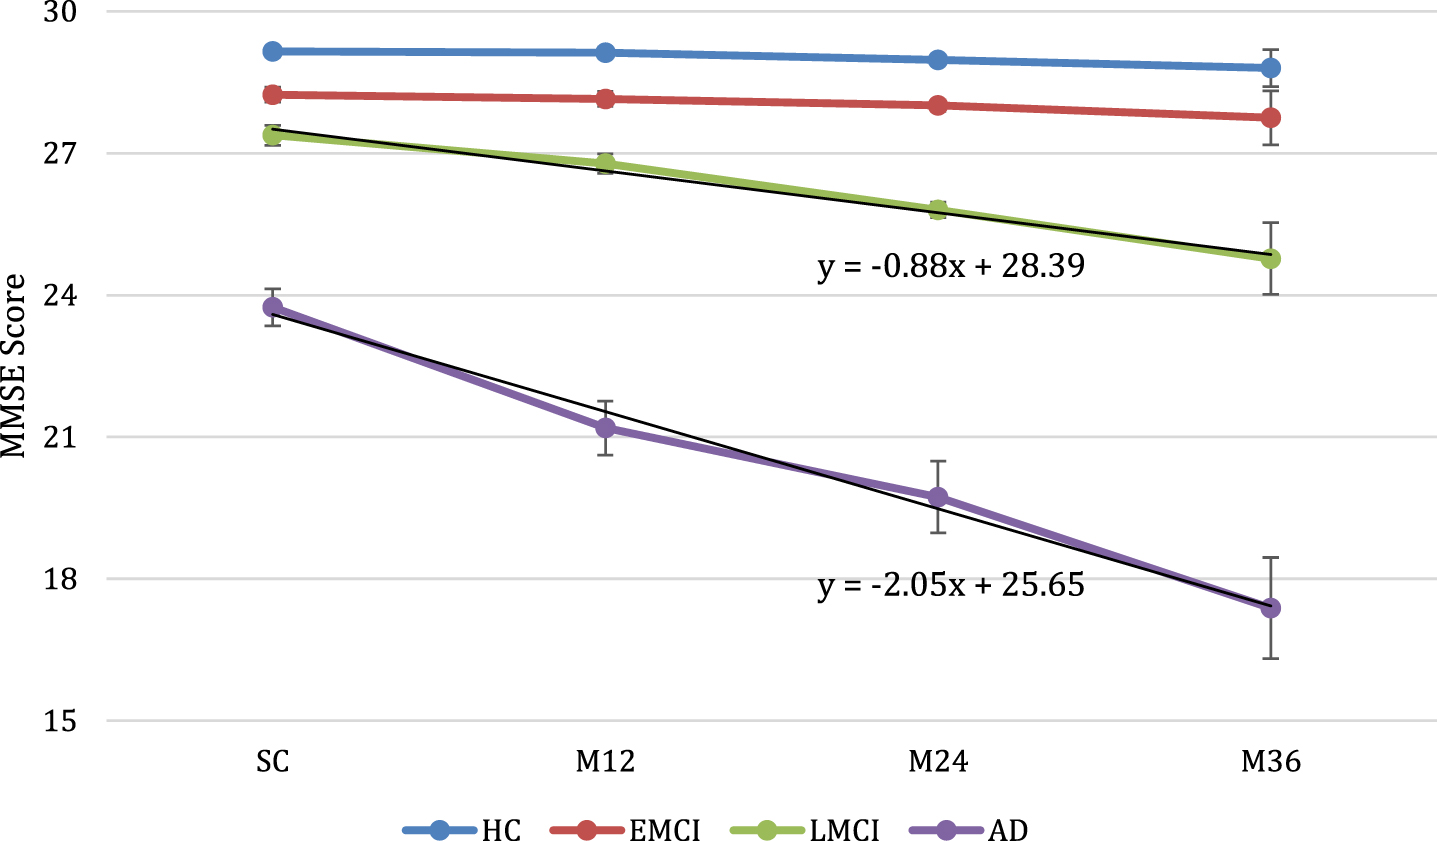
MMSE scores were compared among different diagnosis groups over a 3-year long follow-up period. SC, screening or baseline visit. The bars represent the standard deviations of MMSE score.
As for the data on MMSE, demographic and genetic information were shown in Table 3 for participants who had MoCA assessments done at the baseline and three annual follow-up visits.
Similar to the MMSE data, the results for the ANOVA for repeated measures indicated baseline diagnosis had significant effects on MoCA along the follow-up time points (Wilks’ Lambda = 0.88, F = 4.57, p < 0.001, η2 = 0.04). Table 4 and Fig. 3 showed the differences in MoCA scores across the HC, EMCI, and LMCI groups over the follow-up of 3 years. As a cognitive measurement tool, MoCA was sensitive enough for differentiating LMCI from EMCI or HC at each of the follow-up time points (M12, M24, and M36). It is also worthy to note that, during the follow-up period of 3 years, the MoCA scores stayed relatively stable for both the HC and EMCI groups. By contrast, for the LMCI group, the cognitive deterioration was obviously seen after 12 months (y=–0.9x+23.72). The rate of deterioration became linear between M12 and M36 (Fig. 3). Surprisingly, the LMCI group had a higher average MoCA score than either the HC or the EMCI group for the screening visit with all of them falling into the normal cognitive range (Table 4).
MoCA scores were compared for participants with different baseline cognitive diagnoses
EMCI, early mild cognitive impairment; HC, healthy control; LMCI, late mild cognitive impairment; M, month; SC, screening. MoCA scores were shown in the format of mean±SD.
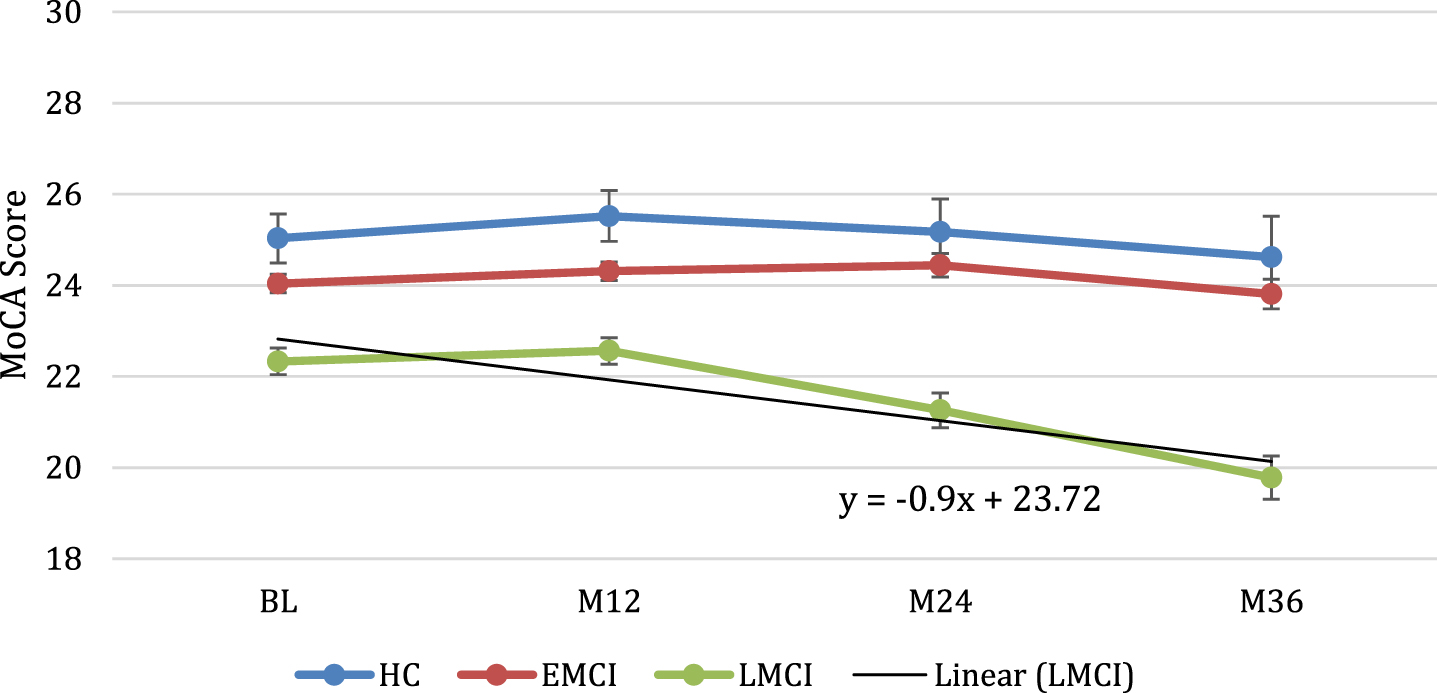
MoCA scores were compared among different diagnosis groups over a 3-year long follow-up period. The bars represent the standard deviations of MoCA score.
By measuring the cognitive performance multiple times with a longitudinal design, the cognitive deterioration rate (slope) along with a follow-up time course may be an effective way to differentiate LMCI from EMCI or HC using either MMSE or MoCA as the tool (Figs. 2 and 3).
We also want to know how MMSE and MoCA are correlated with a longitudinal study design for measuring both of them at four different time points. In total, there were 312 (291 MCI and 21 HC) participants who completed both MMSE and MoCA for all visits (screening, M12, M24, and M36). MMSE and MoCA scores were positively and significantly correlated, which was observed for each visit: the screening visit (r = 0.40, p < 0.001), the M12 visit (r = 0.35, p < 0.001), the M24 visit (r = 0.49, p < 0.001) and the M36 (r = 0.79, p < 0.001). For the ROC analyses over the MMSE data, the area under the curve (AUC) is 0.799, 0.795, 0.803, and 0.82 for the following visits: screening, M12, M24, and M36 respectively. By contrast, for the MoCA data, the AUC is 0.765, 0.755, 0.715, and 0.793 for the following visits: baseline, M12, M24, and M36 respectively.
DISCUSSION
Our goal for this study was to compare MoCA and MMSE for their accuracy to detect early cognitive impairment, thus allowing for early interventions to be implemented for patients. The data collected from the M12, M24, and M36 follow-up visits for both MMSE and MoCA were used to quantify the cognitive changes of studied populations.
In this report, only participants who had completed all four assessments (baseline and three annual follow-up visits) of the MMSE or MoCA were included in the data analysis. Due to the large study samples, the MMSE was more sensitive for differentiating the HC from the EMCI group for the follow-up visits. By contrast, the MoCA was not able to differentiate between the HC group and EMCI group. One reasonable explanation is that more participants had their MMSE data available than those with MoCA data, which gave more power for comparing the assessment scores between the HC group and the EMCI group. Interestingly, the MMSE and MoCA had comparable capability for detecting the cognitive changes (deteriorations) in the LMCI group (Figs. 2 and 3).
The average MMSE or MoCA scores for participants from the HC or EMCI groups had minimal changes over the follow-up duration. In other words, cognitive function was stable for at least three years for participants with baseline diagnosis of HC or EMCI, which is independent of the cognitive assessment tool (Tables 2 and 4; Figs. 2 and 3). By contrast, the LMCI group exhibited a faster cognitive deterioration rate than the HC or EMCI group (Tables 2 and 4; Figs. 2 and 3). As expected, the AD group exhibited the fastest cognitive deterioration rate out of all groups (Table 2 and Fig. 2). Thus, the EMCI group behaved more like the HC group, making them distinctive from the LMCI group. The EMCI group was available as a diagnostic group starting from ADNI GO (the second cohort recruited to the ADNI followed by ADNI 2 and ADNI 3). By contrast, for participants from the ADNI 1 cohort, the baseline MCI diagnosis was the same diagnosis of LMCI used in ADNI GO, 2, and 3. Therefore, EMCI, as a diagnosis, has an emphasis on the perspective of the detectable changes in the pathological AD biomarkers rather than cognitive function changes.
The cognitive measures from MMSE and MoCA are significantly correlated along the follow-up duration. The correlation coefficient varied between 0.35 to 0.79, which is at a moderate level and increasing along with the follow-up measures (baseline, M12, M24, and M36). As two different cognitive tests, more studies need to be carried out to validate our findings here.
The strengths of our study are as follows. Firstly, the ADNI has collected high-quality data including the cognitive assessments, which have been carried out by certified study coordinators. In addition, baseline cognitive diagnoses were made by credentialed study physician/site clinicians. Second, the ADNI has a longitudinal, prospective study design. The cognitive data collected from different time points have allowed us to study the same group of participants for their cognitive changes longitudinally. Third, the sample size is large enough to pick out trivial cognitive changes, which is especially true for the assessments with MMSE. Fourth, for participants with MCI or normal cognition, data from both MMSE and MoCA assessments were available for making a correlation analysis.
As with any other body of scientific research, our study also had some limitations. First, the AD group was relatively small (n = 16) and only had MMSE data available. Therefore, the correlation analysis between MMSE and MoCA only included data collected from participants under the MCI category, as well as from the HC group. Second, we did not run a parallel study on the pathological AD biomarkers, which can validate the findings from a different perspective.
There are some studies trying to equate MMSE to MoCA scores or vice versa [8, 22]. Based on our findings, it would not be recommended to convert one to another unless necessary since the MMSE is only moderately associated with the MoCA for assessing cognitive functions.
Conclusion
The MMSE and MoCA tests each displayed a similar aptitude for the purposes of assessing cognitive impairments as well as monitoring cognitive performance over time. As cognitive assessment tools, MMSE and MoCA both work well for differentiating healthy subjects from those with LMCI as shown by the ROC analyses. However, for differentiating EMCI subjects from healthy subjects, it may be optimal to use more advanced tests or taking advantage of adding pathological AD biomarker tests
Footnotes
ACKNOWLEDGMENTS
This study was funded by the University of Alabama at Birmingham, School of Health Professions, Honors Program Mentor Award.
Data collection and sharing for this project was funded by the Alzheimer’s Disease Neuroimaging Initiative (ADNI) (National Institutes of Health Grant U01 AG024904) and DOD ADNI (Department of Defense award number W81XWH-12-2-0012). ADNI is funded by the National Institute on Aging, the National Institute of Biomedical Imaging and Bioengineering, and through generous contributions from the following: AbbVie, Alzheimer’s Association; Alzheimer’s Drug Discovery Foundation; Araclon Biotech; BioClinica, Inc.; Biogen; Bristol-Myers Squibb Company; CereSpir, Inc.; Cogstate; Eisai Inc.; Elan Pharmaceuticals, Inc.; Eli Lilly and Company; EuroImmun; F. Hoffmann-La Roche Ltd and its affiliated company Genentech, Inc.; Fujirebio; GE Healthcare; IXICO Ltd.; Janssen Alzheimer Immunotherapy Research & Development, LLC.; Johnson & Johnson Pharmaceutical Research & Development LLC.; Lumosity; Lundbeck; Merck & Co., Inc.; Meso Scale Diagnostics, LLC.; NeuroRx Research; Neurotrack Technologies; Novartis Pharmaceuticals Corporation; Pfizer Inc.; Piramal Imaging; Servier; Takeda Pharmaceutical Company; and Transition Therapeutics. The Canadian Institutes of Health Research is providing funds to support ADNI clinical sites in Canada. Private sector contributions are facilitated by the Foundation for the National Institutes of Health (![]() ). The grantee organization is the Northern California Institute for Research and Education, and the study is coordinated by the Alzheimer’s Therapeutic Research Institute at the University of Southern California. ADNI data are disseminated by the Laboratory for Neuro Imaging at the University of Southern California.
). The grantee organization is the Northern California Institute for Research and Education, and the study is coordinated by the Alzheimer’s Therapeutic Research Institute at the University of Southern California. ADNI data are disseminated by the Laboratory for Neuro Imaging at the University of Southern California.