
Abstract
Background:
Altered white matter (WM) tract integrity may contribute to mild cognitive impairment (MCI) and gait abnormalities.
Objective:
The purpose of this study was to determine whether diffusion tensor imaging (DTI) metrics were altered in specific portions of WM tracts in people with MCI and to determine whether gait speed variations were associated with the specific DTI metric changes.
Methods:
DTI was acquired in 44 people with MCI and 40 cognitively normal elderly controls (CNCs). Fractional anisotropy (FA) and radial diffusivity (RD) were measured along 18 major brain WM tracts using probabilistic tractography. The average FA and RD along the tracts were compared between the groups using MANCOVA and post-hoc tests. The tracts with FA or RD differences between the groups were examined using an along-tract exploratory analysis to identify locations that differed between the groups. Associations between FA and RD in whole tracts and in the segments of the tracts that differed between the groups and usual/dual-task gait velocities and gross cognition were examined.
Results:
Lower FA and higher RD was observed in right cingulum-cingulate gyrus endings (rh.ccg) of the MCI group compared to the CNC group. These changes were localized to the posterior portions of the rh.ccg and correlated with gait velocities.
Conclusion:
Lower FA and higher RD in the posterior portion of the rh.ccg adjacent to the posterior cingulate suggests decreased microstructural integrity in the MCI group. The correlation of these metrics with gait velocities suggests an important role for this tract in maintaining normal cognitive-motor function.
Keywords
INTRODUCTION
Alzheimer’s disease (AD) is the most prevalent, insidiously progressive, and devastating age-related form of dementia worldwide [1]. Currently there are no disease-modifying treatments approved for AD [2, 3], although recent efforts to develop immunotherapies have begun to demonstrate some positive results [4]. Randomized clinical trials to develop new treatments and diagnostics must continue to focus on the very early stages of the cognitive disorder, clinically known as mild cognitive impairment (MCI) [3, 5] to stop, slow, or mitigate disease progression. Novel noninvasive in vivo MRI techniques may have a pivotal role to track disease progression during this early phase [6].
There is now also strong evidence of gait impairment and increased risk of falls in the preclinical and early stages of AD [7, 8]. Gait is a multifaceted task that is highly dependent on cognitive processes including attention and executive function [9], and involves several brain regions including the dorsolateral prefrontal cortex, sensorimotor and visual regions, and subcortical regions such as the basal ganglia and cerebellum [9, 10]. Subtle alterations in gait performance in MCI subjects can be observed under dual-task gait scenarios, where people perform a cognitive task while walking [7, 8]. Identification of alterations in dual-task gait may assist with the early detection of MCI and the tracking of AD progression [11–14]. Importantly, dual-task gait impairment reflects the cognitive-motor interface. In a large sample of MCI individuals, dual-task gait impairment has been associated with a high progression rate to dementia [15], and it has been recommended as a practical test to be used in MCI to detect those at higher progression risk [16]. Several studies have reported strong associations between spatiotemporal gait variables and brain structural and functional measurements obtained from neuroimaging techniques in MCI subjects [17–20]. Such studies shed light on the mechanisms of disease progression and could help to target interventional therapies to specific brain regions.
Diffusion tensor imaging (DTI) and histopathological studies of postmortem brain tissues have unveiled the substantial role of white matter (WM) disintegration in AD initiation and progression [21, 22]. While gray matter loss is associated with cognitive decline, WM volume also decreases [23, 24], and WM lesions visible as WM hyperintensities (WMH) on T2-weighted fluid attenuated inversion recovery (FLAIR) MRI are known to impact on both motor and cognitive function [25–27]. WM lesions are important risk factors for cognitive deficits and dementia [28] and also for gait impairments in MCI [29]. In addition, microstructural alterations within WM tracts not detectable using conventional structural MR imaging can be detected by DTI [30]. Such tissue regions are referred to as normal-appearing WM (NAWM) [30]. Microstructural WM disintegration may precede and even predict cerebral atrophy in specific brain regions [31, 32]. Although the cause of such microstructural damage is unknown there may be several contributing factors. For example, apolipoprotein E4 (apoE4), one of the main genetic risk factors of AD, is associated with cholesterol transfer across neurons [33–35]. Cholesterol is important for the synthesis of the myelin sheath in WM [34, 35], therefore altered transport of this molecule may lead to WM microstructural alterations during the course of AD development [36]. Chronic hypertension, history of stroke, and inflammation of blood vessels are other risk factors that promote white matter disease [27].
Previous studies have examined WM microstructural disintegration in MCI and AD subjects using DTI and variants of this methodology [37–40]. Reduced fractional anisotropy (FA) in temporal NAWM, the splenium, left isthmus of the cingulate, and fornix, and increased radial diffusivity (RD) in the splenium, left isthmus of the cingulate, and bilateral uncinate fasciculi in MCI compared to controls has been reported [37–40]. Tractography based on DTI provides a further opportunity to study major WM tracts with greater accuracy and also to examine the variation of DTI metrics along tracts [41, 42]. Previous studies have used this approach to compare mean DTI metrics in specific WM tracts between AD, MCI, and control subjects [43, 44]. For example, mean DTI metrics in the left hippocampal component of cingulum fibers showed significant differences between MCI and control subjects [44]. Probabilistic tractography was also previously used to segment major tracts and found the mean FA in the left cingulum angular bundle could best discriminate a group of amnestic MCI patients from controls [45].
Several previous studies have examined the association between DTI parameters and gait parameters in elderly adults and people with cerebrovascular and neurodegenerative diseases [46–49]. However, there are very few studies in people with MCI [50]. In addition, it is unknown whether there is an association between gait performance and DTI changes observed along major WM tracts in people with MCI. The current study comprehensively compares DTI metrics in major white matter tracts throughout the brain between MCI subjects and controls as well as DTI metrics along the tracts obtained using tractography. The overall goal of this study was to identify specific WM tracks with microstructure changes in MCI subjects compared to controls and to localize differences along the tracts. Previous DTI studies of age-related WM microstructural alterations in older adults have shown that both FA and RD can effectively characterize WM degeneration with aging and are associated with age-related deterioration in cognitive performance [51–53]. FA has been shown to be the most sensitive DTI metric to age-related and pathological microstructural changes within WM tissue [54, 55]. Moreover, from a comparative perspective, RD has shown a stronger association with age-related WM alterations as well as resultant brain cognitive decline compared to axial diffusivity (AxD) [51, 52], and may better reflect the demyelination that occurs in aging and age-related neurodegeneration [52, 56]. From a theoretical standpoint, mean diffusivity (MD) also includes water diffusion measurements in both WM fiber and cross-fiber directions and hence is associated with both AxD and RD [54]. Recently we showed that MD, AxD, and RD are highly correlated [57]. Consequently we excluded MD and AxD from the statistical comparisons, and FA and RD were examined within the 18 major WM tracts of study participants to examine the difference in the WM tract integrity between MCIs and controls. In addition, we sought to determine whether these microstructure changes were associated with gait abnormalities and gross cognition. We hypothesized that DTI metrics along the cingulum tract which plays an important role in both cognitive and motor function [58–60] and is substantially disrupted in MCI [44, 45] would correlate with measures of gait speed in MCI subjects.
MATERIALS AND METHODS
Participants
In this study, 44 subjects with MCI and 40 cognitively normal elderly controls (CNCs) were included from the Gait and Brain Study (National Clinical Trial #: 03020381) (Table 1) [7, 61]. The Gait and Brain Study is a prospective cohort study to examine the association between gait impairment, cognitive dysfunction, and mobility decline, and to examine the use of gait measurements to predict progression to dementia and prospective falls among community dwelling older adults [7, 61]. All participants had gait evaluations and a 3T MRI exam including DTI.
Cross-sectional demographic information, neuropsychological assessment scores, clinical characteristics, and gait performance of the participants from Gait and Brain Study included in this study
F, female; MoCA, Montreal Cognitive Assessment; MMSE, Mini-Mental State Examination. *indicates p-value was obtained by running ANCOVA using age and sex as covariates. Mean±standard deviation (SD) where applicable; (% of number of subjects (N) for each group); [range: minimum to maximum].
Cognitively normal elderly controls included in this study were aged 60 and older, and had no evidence of dementia using DSM IV and DSM V criteria. All the cognitively normal elderly controls presented normal age-, sex-, and education-adjusted performance on the standardized cognitive tests used to classify MCI or prodromal AD [7, 61]. MCI subjects included in this study met the following criteria: 1) presence of subjective memory complaints discerned by the patient, family, and caregivers 2) objective memory impairments as evidenced in cognitive tests (below 1.5 standard deviation (SD) under the expected performance in cognitive tests considering age and education), 3) preserved activities of daily living [62], and 4) absence of clinical dementia (established using DSM-IV-TR criteria) [7, 61]. Participants were required to be able to walk independently for 10 m and have no major depression, residual motor deficits such as Parkinsonism, or musculoskeletal or joint disorders impairing their gait performance as assessed by clinical and physical exams completed by skilled clinicians [7, 61]. Subjects were excluded if they were taking any antipsychotic and psychoactive drugs such as neuroleptics and benzodiazepines.
Participants completed medical questionnaires to provide social and demographic information, history of long-lasting medications, comorbidities, and falls. Gross cognition was assessed using the Mini-Mental State Examination (MMSE) [63] and the Montreal Cognitive Assessment (MoCA) [64]. Executive function, verbal episodic memory, naming, attention, and working memory were also assessed using Trail Making Tests A and B [65], the Rey Auditory Verbal Learning Test [66], the Boston Naming Test [67], the Digit Span Test (forward and backward) [68], and the Letter-Number Sequencing test [69], respectively. The mean±SD of the number of comorbidities reported in Table 1 for each group was calculated based on a count of the comorbidities listed in Table 1 for each participant.
Quantitative gait measurements
Spatiotemporal gait parameters were measured using an electronic walkway (GAITRite System, 600 cm long, CIR Systems, Inc. NJ, USA) under single-task, dual-task, and fast gait scenarios. The participants were asked to perform one practice trial walking on the mat for each scenario. To exclude unreliable acceleration and deceleration phases, start and end points of the walking path were limited to 1 m from either end of the walkway. In the single-task gait scenario, participants were asked to walk along the mat at their usual pace. In the dual-task trial, participants walked at their usual pace while doing one single cognitive task. This measurement was repeated twice, first participants counted backwards from one hundred by ones and second participants subtracted serial sevens from one hundred. The rationale for considering these specific cognitive tasks while walking were previously described [7, 70–73]. The participants also were not instructed to prioritize the gait or cognitive task. In the fast gait, the participants were asked to walk as fast as they could on the mat. It is noteworthy that diversifying both gait and cognitive tasks helps to better represent daily living activities. The effects of training and fatigue were alleviated by performing one trial per condition, and randomizing the order of various gait experiments (single-task, dual-task, and fast). The gait assessment protocol used in this study is well-established and reliable in MCI populations [74–76]. This protocol has also been used for two other important cohort studies in Canada: 1) The Canadian Consortium on Neurodegeneration in Aging (CCNA) [76] and 2) The Ontario Neurodegenerative Disease Research Initiative (ONDRI) [75]. Gait speed was reported in centimeters per second (cm/s).
MR image acquisition
A 3T Siemens Magnetom Prisma Fit MRI scanner equipped with an 8-channel phased array head coil at the Centre for Functional and Metabolic Mapping (CFMM), within Robarts Research Institute at Western University was used for MR image acquisition. Structural T1-weighted images were acquired using a 3D MPRAGE sequence with matrix = 256×256×192, TE = 2.98 ms, TR = 2.3 s, and voxel size = 1 mm×1 mm×1 mm. DTI was acquired using a single-shot echo-planar imaging (EPI) sequence with matrix = 128×128, TE = 64 ms, TR = 6.9 s, voxel size = 2 mm×2 mm×2 mm, 70 slices, and gap = 0. Diffusion-weighting was applied in 30 noncollinear gradient directions at an effective b-value of 1000 s/mm2. In addition, at least one image with no diffusion weighting (b0 volume) was acquired.
Processing and analysis of the structural T1-weighted images and DTI data
Segmentation of 18 major WM tracts (lh.cst: left corticospinal tract; rh.cst: right corticospinal tract; lh.ilf: left inferior longitudinal fasciculus; rh.ilf: right inferior longitudinal fasciculus; lh.unc: left uncinate fasciculus; rh.unc: right uncinate fasciculus; fmajor: corpus callosum - forceps major; fminor: corpus callosum - forceps minor; lh.atr: left anterior thalamic radiations; rh.atr: right anterior thalamic radiations; lh.ccg: left cingulum - cingulate gyrus endings; rh.ccg: right cingulum - cingulate gyrus endings; lh.cab: left cingulum - angular bundle; rh.cab: right cingulum - angular bundle; lh.slfp: left superior longitudinal fasciculus - parietal endings; rh.slfp: right superior longitudinal fasciculus - parietal endings; lh.slft: left superior longitudinal fasciculus - temporal endings; rh.slft: right superior longitudinal fasciculus - temporal endings) was completed in all the study participants using TRACULA (TRActs Constrained by UnderLying Anatomy, https://surfer.nmr.mgh.harvard.edu/fswiki/Tracula) [77]. TRACULA is a freely available medical image processing tool in the FreeSurfer software (version 6.0.0) [78–80] for automated reconstruction of WM tracts using conventional DTI data and corresponding structural T1-weighted images.
Segmentation of the structural T1-weighted images
A major prerequisite to use TRACULA for WM tract segmentation is to process the structural T1-weighted images and complete cortical and subcortical segmentations of these structural images using “recon-all”, an automated reconstruction tool in the FreeSurfer software [78–80]. This step was necessary to localize specific anatomical parts in the brain required for delineation of the WM tracts by TRACULA.
Prior to processing the T1-weighted image of each subject, a visual quality control check was performed. Then, images were processed in FreeSurfer including: motion correction, affine transformation to Talairach standard space, non-uniform intensity normalization for inhomogeneity corrections of the scanner’s magnetic field, brain extraction, intensity normalization to ensure compatibility with the contrast of the atlas required for successful segmentation, non-linear registration of the atlas to the T1-weighted image followed by atlas-based tissue segmentation, topological corrections, and brain surface mapping. Finally, the brain parcellation was examined to exclude inaccurate segmentations. Subordinate statistical parametric mapping was also utilized to correct segmentations when needed and the segmentation results were checked visually once more to exclude inaccurate segmentations from data analysis.
Quality control and preprocessing of the diffusion images
All DTI datasets were visually inspected before image processing and only datasets with acceptable levels of eddy/motion artifacts were included in the data analysis. DTI datasets were then preprocessed including eddy-current and motion corrections, registration of the DTI data to the corresponding structural T1-weighted image using FreeSurfer’s “bbregister” tool in FreeSurfer [81], followed by registration of the corresponding structural T1-weighted image and then DTI data to the MNI152 template [82]. Cortical and WM masks were generated by segmenting the T1-weighted image as previously described [78–80]. Finally diffusion tensor fitting was performed using “dtifit” in FSL (https://users.fmrib.ox.ac.uk/ behrens/fdt_docs/fdt_dtifit.html).
White matter tract segmentation using diffusion images
Eighteen major WM tracts were segmented in each subject using TRACULA in FreeSurfer [77]. First, the anatomical priors required for WM tract segmentation were localized in each subject using training data. Then the Ball and Stick Model was fitted to the diffusion data using “bedpostx” in FSL (https://fsl.fmrib.ox.ac.uk/fsl/fslwiki/FDT/UserGuide#BEDPOSTX) [83] to estimate multiple anisotropic diffusion compartments per voxel. The output of this model was utilized for fiber tracking and WM tract reconstruction particularly in the voxels containing crossing fibers. In the final step, TRACULA utilized anatomical constraints from the training data and the computed Ball and Stick Model in each subject to reconstruct 18 major WM tracts [77]. TRACULA outputs a probabilistic spatial distribution for the 18 WM tracts in both MNI152 space and native T1-weighted image space in addition to the conventional DTI metrics FA, MD, AxD, and RD along these tracts. DTI metrics were quantified along the center line of each tract. The center line was defined as the highest probability path for each tract that passes through the center of the path distribution obtained for that tract using the tractography algorithm developed in TRACULA [77]. We developed software in MATLAB (MATLAB R2019, Natick, MA: The MathWorks Inc., 2019) to extract the average DTI metrics along the center of each WM tract as well as examine the variation of DTI metrics along the center of the tracts as defined above [77]. These measures were used for group comparisons and to relate to gait measures.
Statistical analysis
Comparison of WM tract integrity between MCI and CNC groups
Two separate MANCOVA tests were conducted to examine average center tract FA and RD adjusted for age, sex, education, number of comorbidities, and MoCA score. Significant difference between the groups were identified by p-values <0.025 after Bonferroni correction for two comparisons. If the MANCOVA was found to be significant, post-hoc tests (pairwise comparisons based on the estimated marginal means) were performed to determine which specific WM tracts differed between the groups (p < 0.05 consideredsignificant).
Exploratory pointwise comparison of WM tract integrity between MCI and CNC groups
Tracts that showed average differences in FA or RD between MCI and CNC groups were considered for further exploratory analysis to determine which regions along the center line of the tract contributed to differences. The center line of each tract in each subject was identified by a series of points (voxels) obtained by the automatic algorithm in TRACULA. The minimum number of points defining the center line of each tract across all subjects in both groups was considered as the nominal number of points on the center line of that tract to minimize interpolation errors. Linear interpolation was used to estimate the value of DTI metrics at these nominal number of points on the center line of the tract in each subject based on the percentage of the total length of the center line of the tract in that subject. To increase the reliability of each tract examined, subjects that had tracts with a center line length greater than±2×SD from the mean center line length of that tract were excluded from the statistical analysis to account for between-subject tract geometrical differences. T-tests were performed in this exploratory analysis to compare matched positions along each tract to identify differences. In our analyses, significant difference between the groups were identified byp-values<0.05.
Correlation between WM tract integrity and gait measurements
In each of the groups, gait velocity measures that differed between the groups, i.e. usual, fast, and dual-task counting gait velocities, were correlated with DTI measures (FA and RD) in the WM tracts that differed between the groups. Each of the gait velocities (usual, fast, dual-task counting, and dual-task serial 7 s) measured was considered different between the groups if the p-value of the ANCOVA test adjusted by age and sex (reported in Table 1) was smaller than the significance level, i.e., p-value<0.05. Two different strategies were adopted and compared. First the average DTI measures on the center of the tracts were correlated with gait velocities. Second, the average DTI measures on specific points on the center of the tracts that were different between the groups were correlated with gait velocities. The second approach emphasizes the importance of DTI in specific parts of the tracts in revealing motor deficits in MCI and CNC subjects. The correlation analyses were conducted using separate linear regressions adjusted by age, sex, education, number of comorbidities, and MoCA score. A α-level of 0.05 was considered significant in our analyses.
Correlation between WM tract integrity and gross cognition
In each of the groups, overall gross cognition scores (both MMSE and MoCA) were correlated with DTI measures (FA and RD) in the WM tracts that differed between the groups. Similarly, the two different strategies used to conduct correlation with gait measurements described in the previous section were adopted: 1) the average DTI measures on the center of the tracts were correlated with gross cognition scores and 2) the average DTI measures at specific points on the center of the tracts that were different between the groups were correlated with gross cognition scores. Separate linear regressions adjusted by age, sex, education, and number of comorbidities were conducted for this correlation analysis. Significant correlations were identified by p-values <0.05.
RESULTS
Tract-based DTI metrics variations
The MANCOVA tests incorporating all 18 major WM tracts showed that both FA (p = 0.018) and RD (p = 0.019) differed significantly between the groups after Bonferroni correction for multiple comparisons (Table 2). Post-hoc test results to compare a single diffusion metric in individual tracts following these significant MANCOVA tests along with the mean and SD of the FA and RD values averaged along the center of each of the 18 major WM tracts in each group are provided in Tables 3 and 4. Post-hoc tests revealed that FA in the right cingulum-cingulate gyrus endings (rh.ccg) (p = 0.019) and left superior longitudinal fasciculus-parietal endings (lh.slfp) (p = 0.037) (Table 3), and RD in the rh.ccg (p = 0.046) and left uncinate fasciculus (lh.unc) (p = 0.008) (Table 4) differed between the groups. No other significant differences in the DTI metrics of the tracts were identified between the groups (Tables 3 and 4). In the rh.ccg both lower FA and higher RD were observed in the MCI group compared to the CNC group indicating WM disintegration within this tract in the MCI group. Furthermore, significantly higher FA in lh.slfp (Table 3) and lower RD in lh.unc (Table 4) were identified in the MCIgroup.
Average DTI metric values in all 18 WM tracts
*indicates significant p-value (<0.025) after Bonferroni correction for multiple comparisons.
Results of multicomparison post-hoc tests following the MANCOVA test to examine which specific WM tracts FA significantly differed between CNC and MCI groups
*indicates a significant difference in the FA value of the related tract between the groups (p-value <0.05). lh.cst, left corticospinal tract; rh.cst, right corticospinal tract; lh.ilf, left inferior longitudinal fasciculus; rh.ilf, right inferior longitudinal fasciculus; lh.unc, left uncinate fasciculus; rh.unc, right uncinate fasciculus; fmajor, corpus callosum-forceps major; fminor, corpus callosum-forceps minor; lh.atr, left anterior thalamic radiations; rh.atr, right anterior thalamic radiations; lh.ccg, left cingulum-cingulate gyrus endings; rh.ccg, right cingulum-cingulate gyrus endings; lh.cab, left cingulum-angular bundle; rh.cab, right cingulum-angular bundle; lh.slfp, left superior longitudinal fasciculus-parietal endings; rh.slfp, right superior longitudinal fasciculus-parietal endings; lh.slft, left superior longitudinal fasciculus-temporal endings; rh.slft, right superior longitudinal fasciculus-temporal endings.
Results of the multicomparison post-hoc tests following the MANCOVA test to examine which\\ specific WM tracts RD significantly differed between CNC and MCI groups. The tract name abbreviations were defined in the caption of Table 2
*indicates significant difference in the RD value of the related tract between the groups (p-value <0.05).
Pointwise comparison of WM tract integrity between MCI and CNC groups
T-tests between coincident points along the rh.ccg tract (Fig. 1) examining both FA (Fig. 2) and RD (Fig. 3) demonstrated that the beginning 10% –20% of the posterior portion of this tract differed (p < 0.05) between the groups. Lower FA and higher RD were observed in the MCI group indicating localized disintegration of the posterior portion of the rh.ccg tract. Comparison of points along the lh.unc tract also showed higher RD in the MCI group indicating tract disruptions near the orbitofrontal end of the tract (Fig. 4). Finally, comparison of points along the lh.slfp tract showed higher FA in the MCI group compared to the CNC group on the portion of this tract ending in the parietal lobe (Fig. 5).
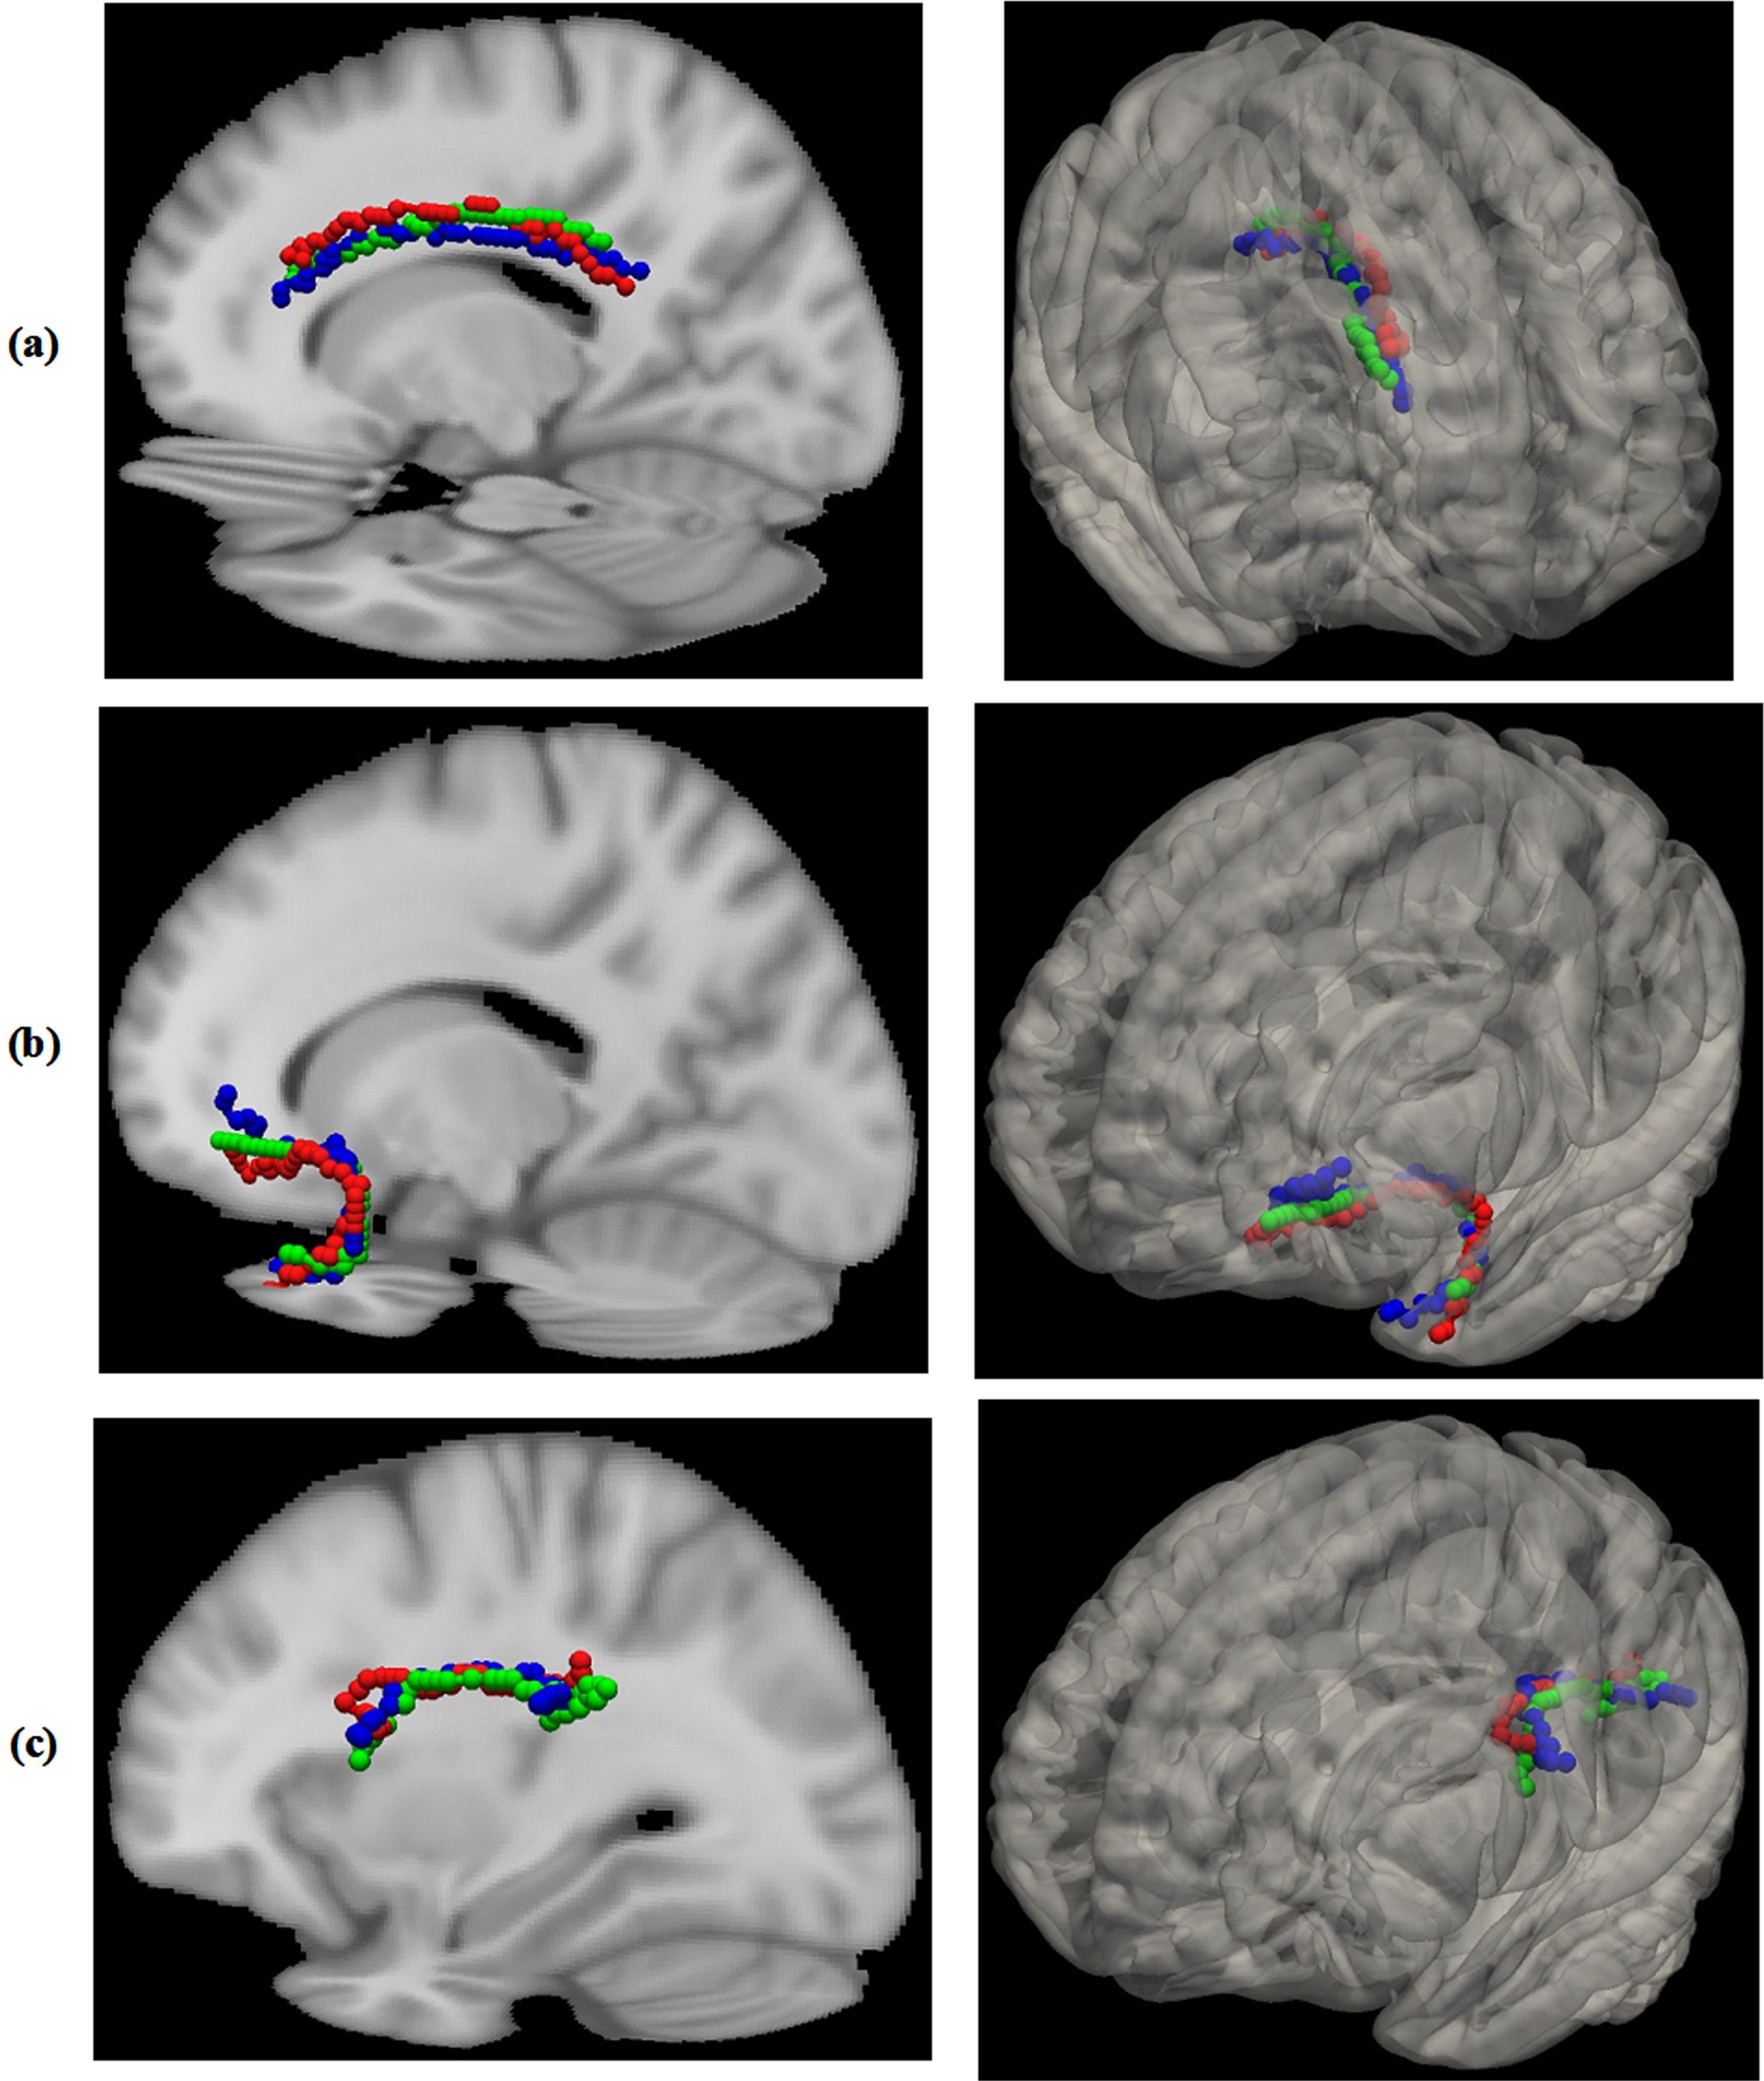
The white matter tracts that differed between the groups in terms of FA and/or RD in three of the studied subjects: the right cingulum-cingulate gyrus endings (rh.ccg) tract (a), the left uncinate fasciculus tract (lh.unc) (b), and the left superior longitudinal fasciculus-parietal endings tract (lh.slfp) (c). The center of each subject’s tract is depicted by a distinct color (red, green, or blue).

FA (b) and corresponding p-value (a) variation along (posterior to anterior) the tract rh.ccg in each group. The p-values in (a) were obtained using two-sample t-tests comparing FA at each point along the tract. The points on the tract with p-value <0.05 are highlighted with magenta asterisks in (a). The section on the tract rh.ccg with different FA between the groups is highlighted with a shaded magenta rectangle in (b).
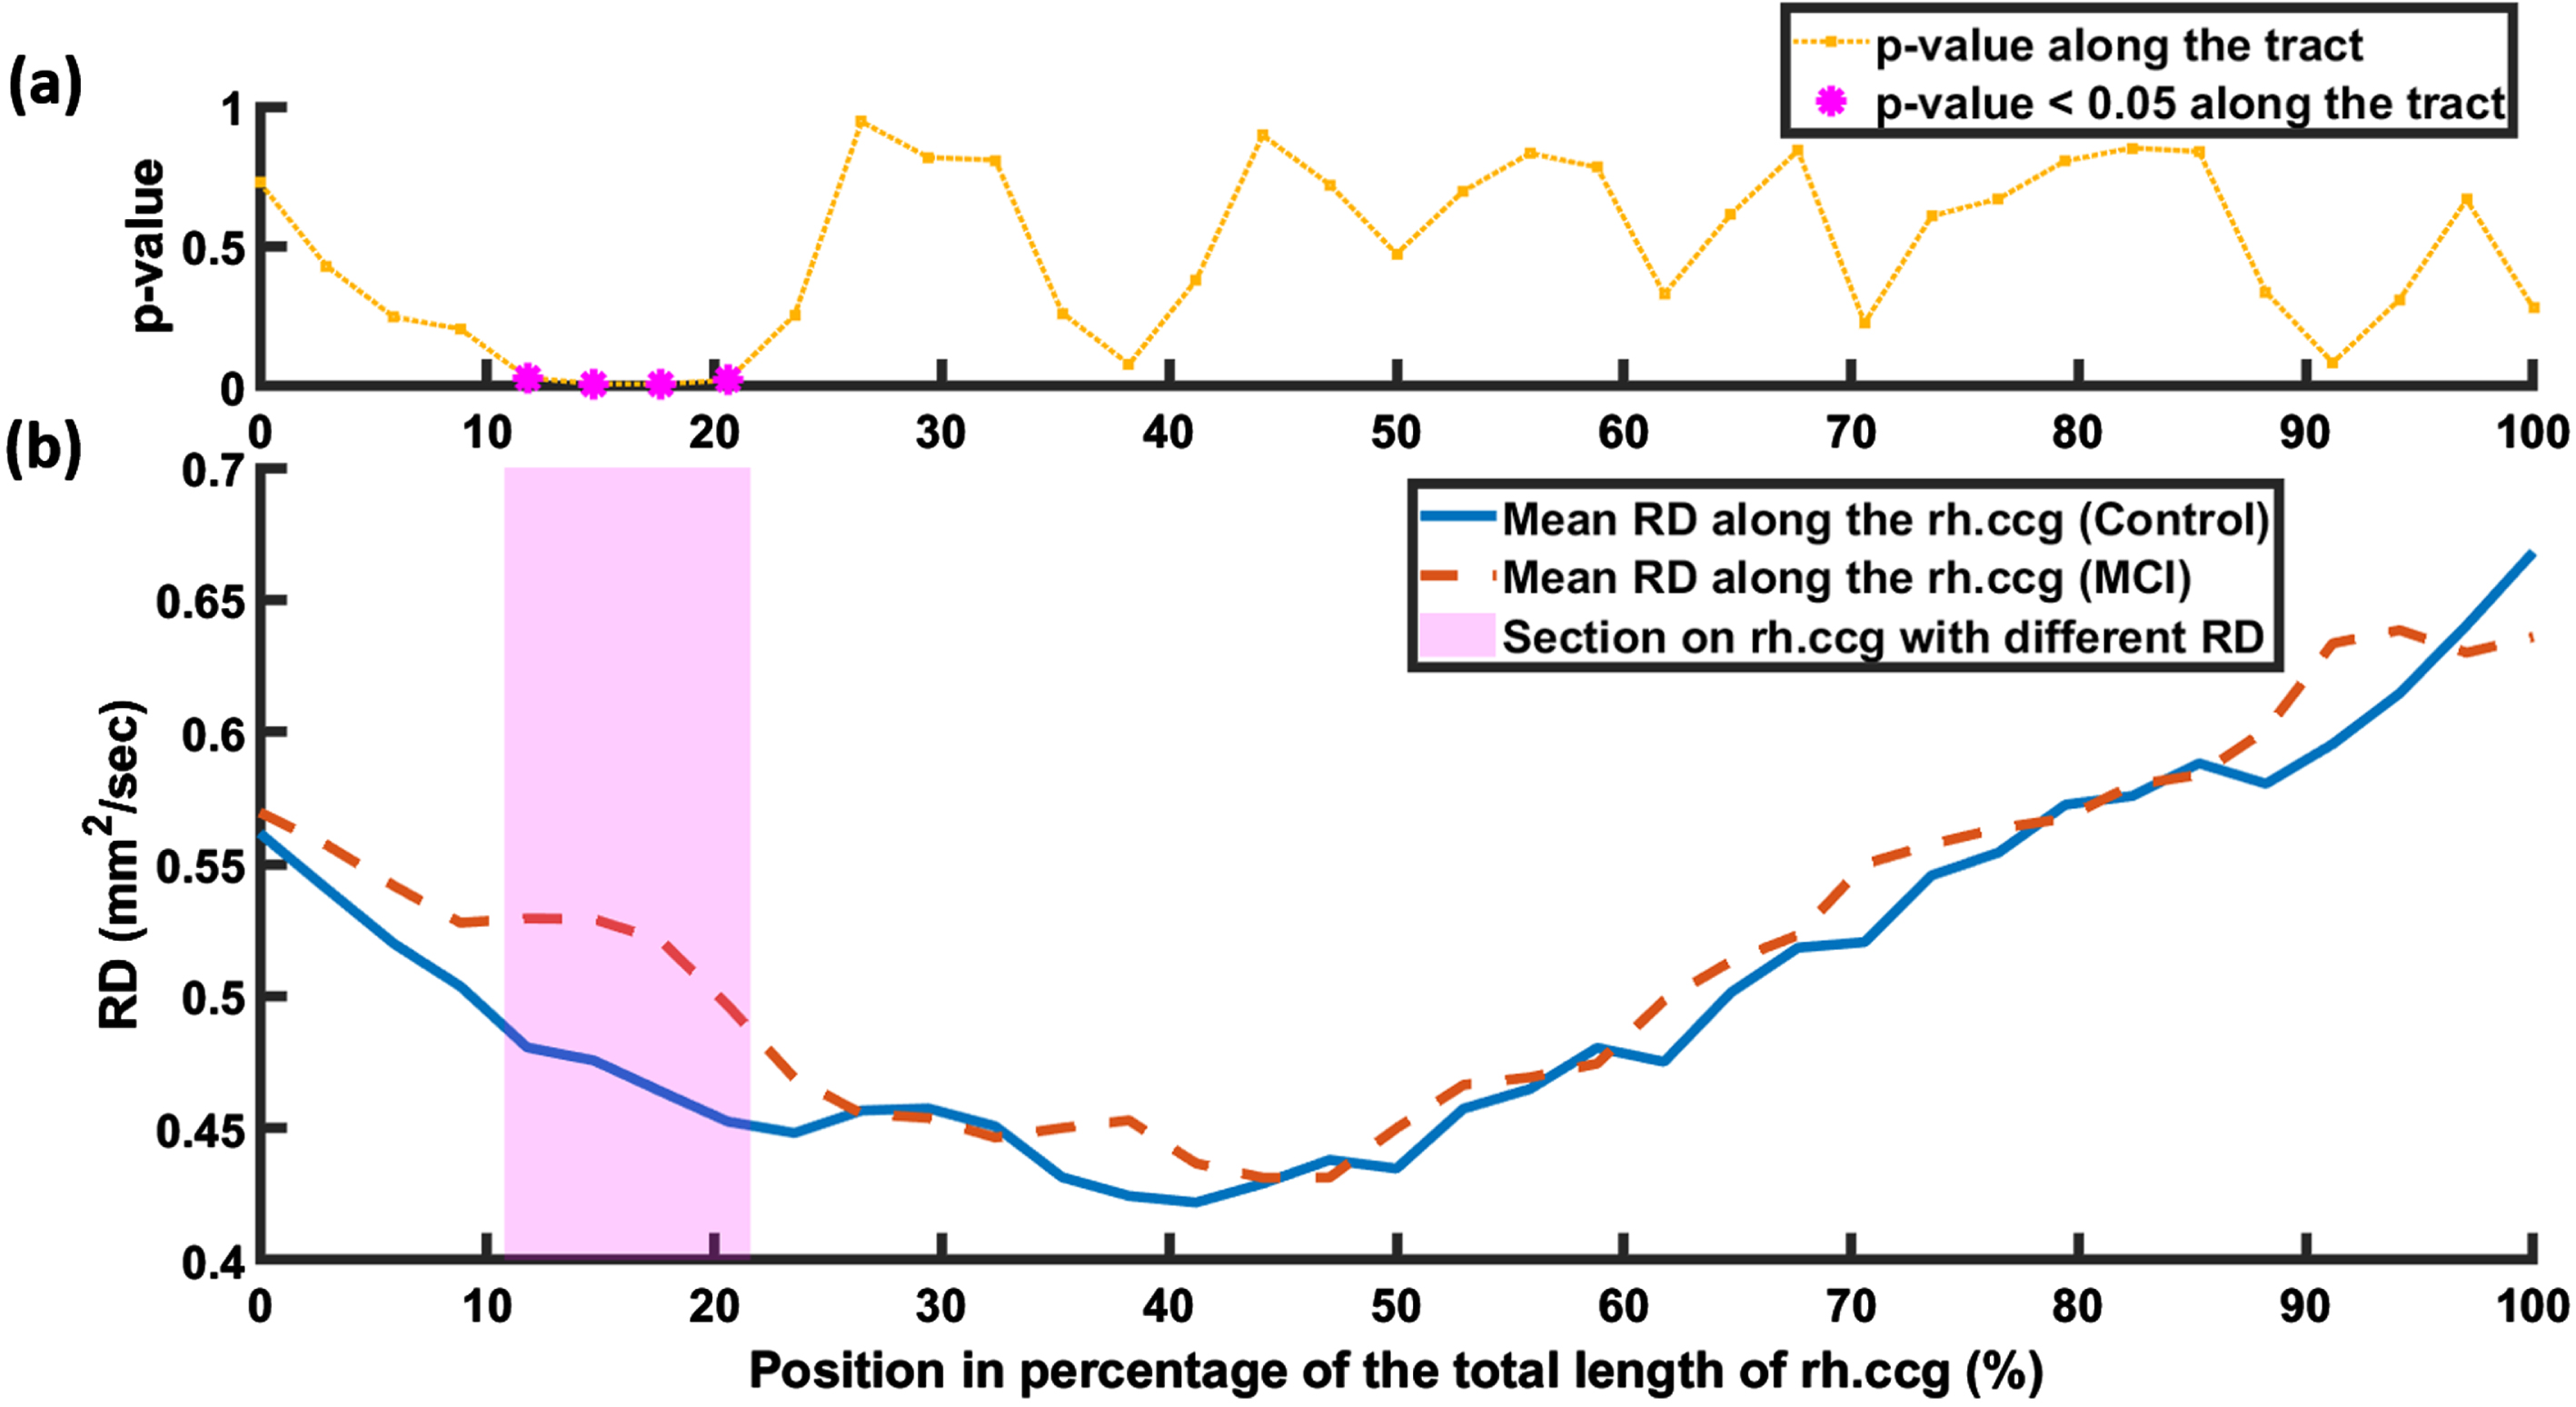
RD (b) and corresponding p-value (a) variation along (posterior to anterior) the tract rh.ccg in each group. The p-values in (a) were obtained using two-sample t-tests comparing RD at each point along the tract. The points along the tract with p-value <0.05 are highlighted with magenta asterisks in (a). The section on the tract rh.ccg with different RD between the groups is highlighted with a shaded magenta rectangle in (b).
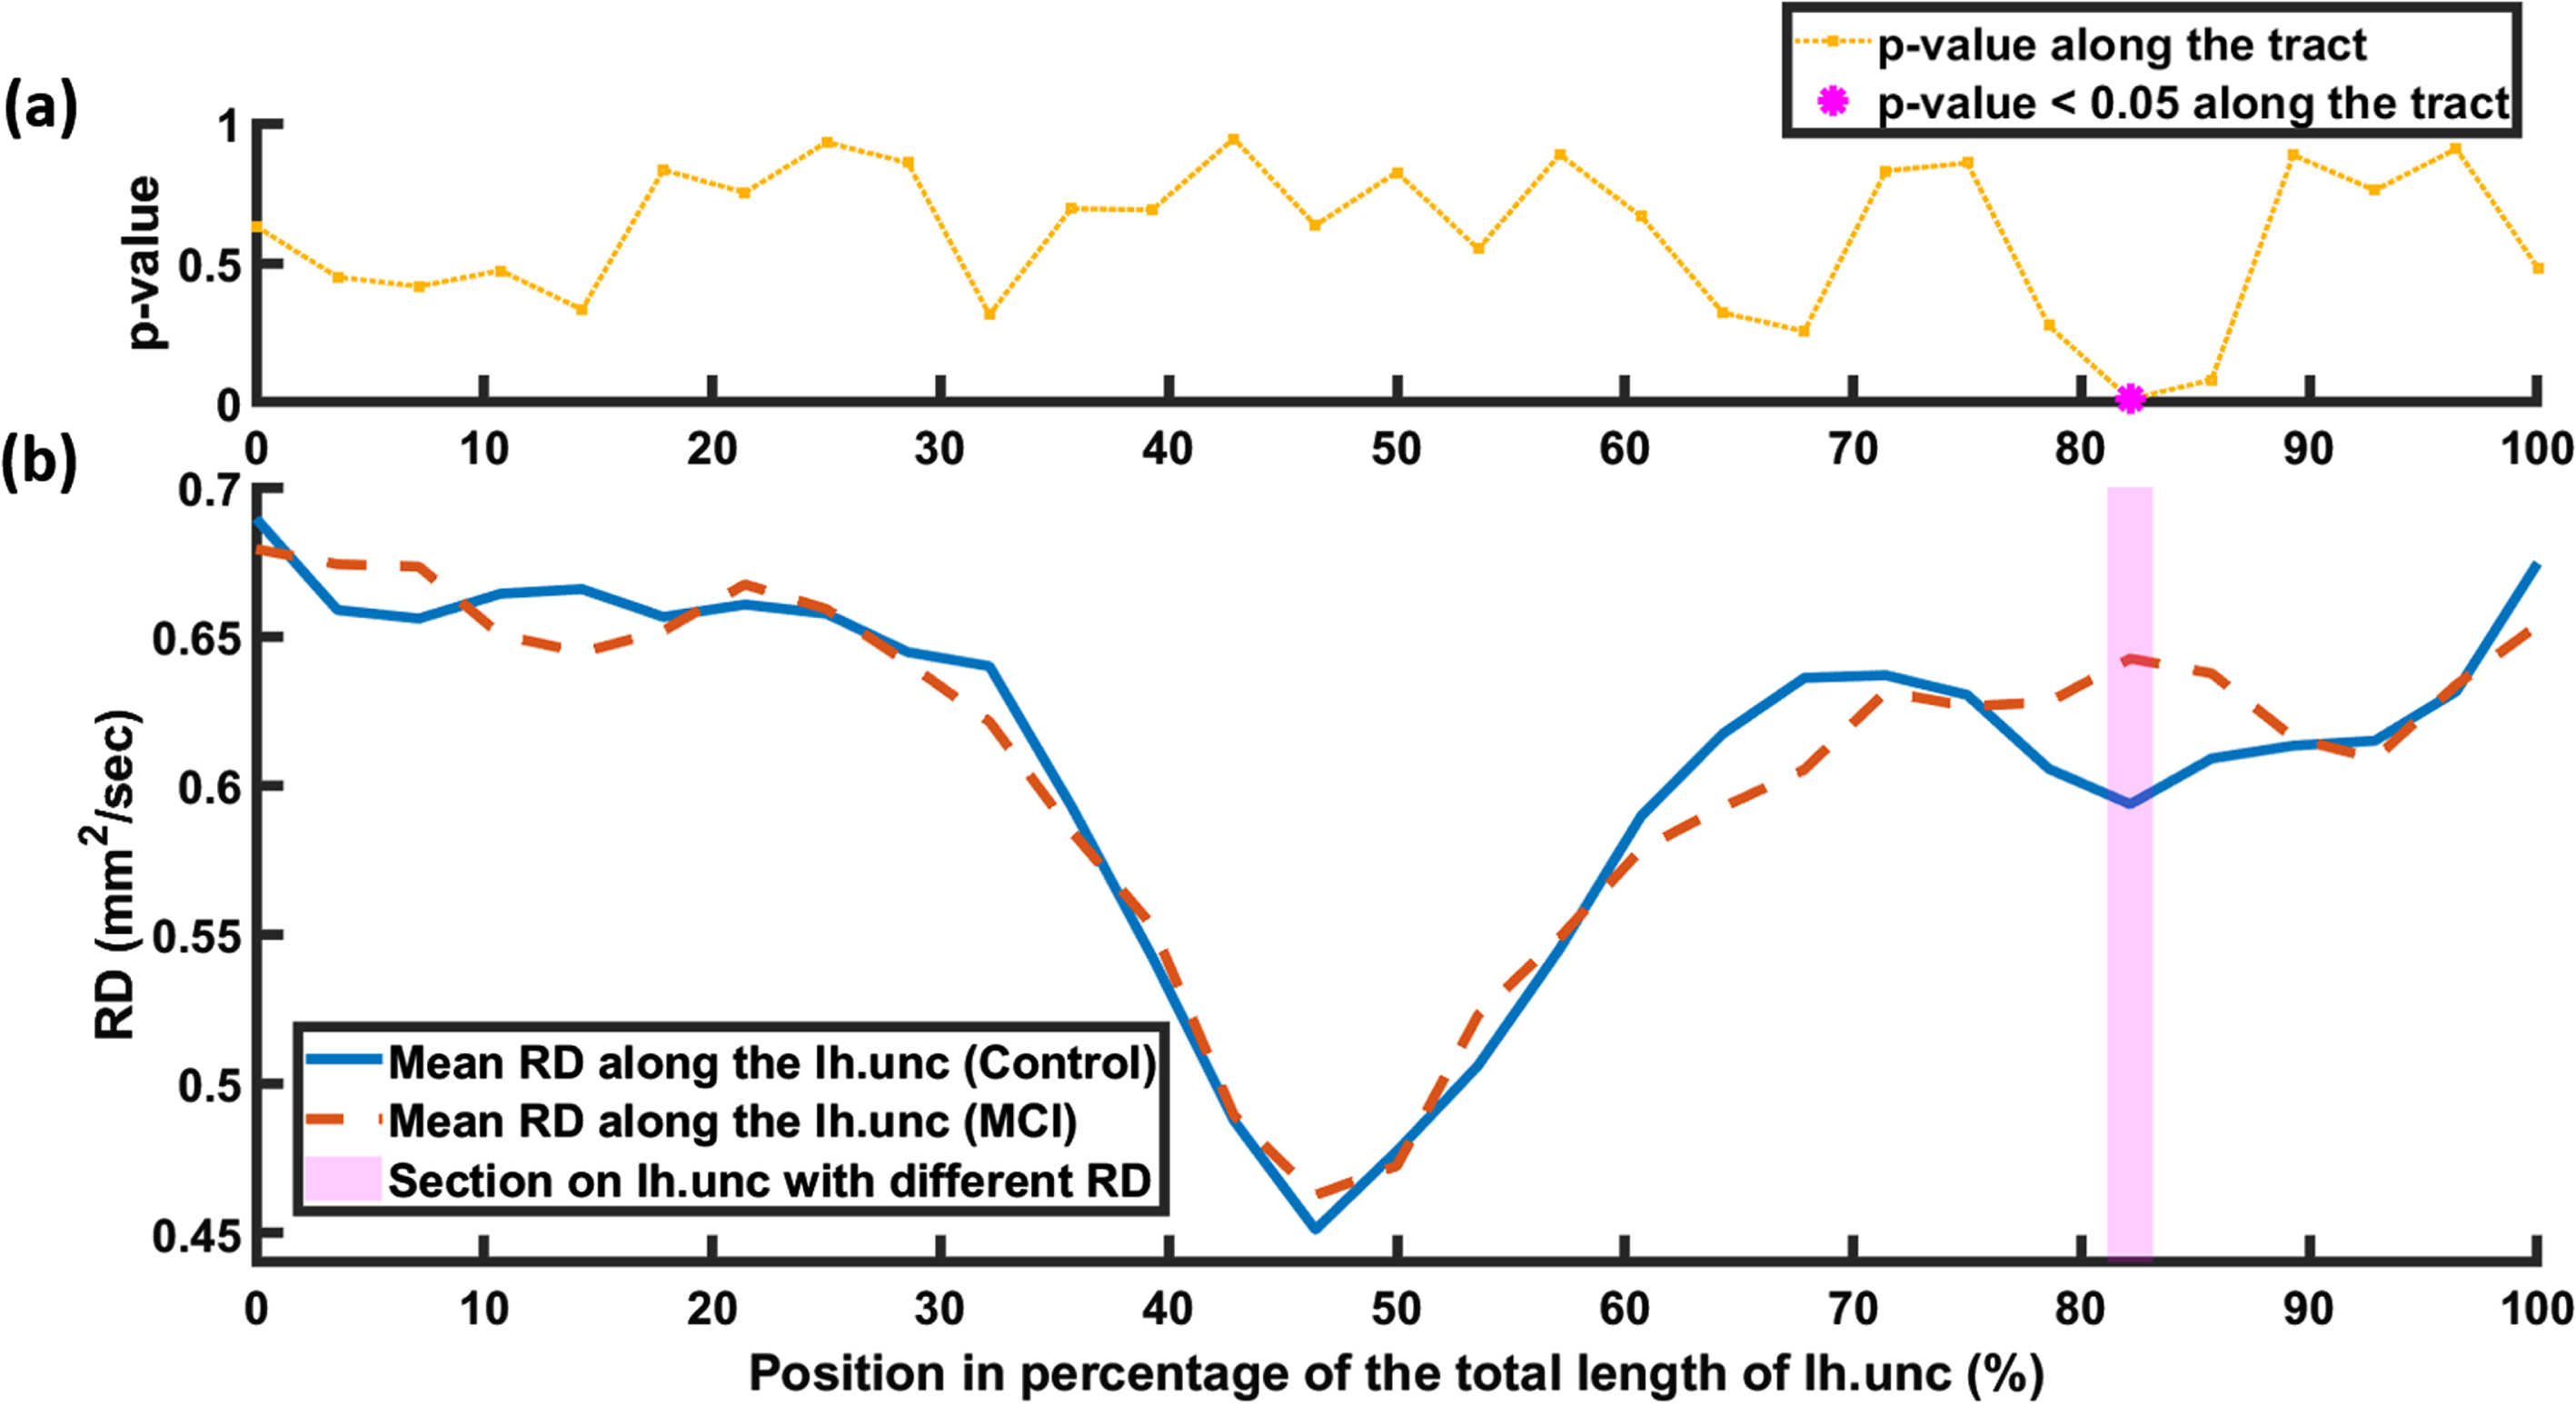
RD (b) and corresponding p-value (a) variation along (temporal to orbitofrontal) the tract lh.unc in each group. The p-values in (a) were obtained using two-sample t-tests comparing RD at each point along the tract. The points along the tract with p-value <0.05 are highlighted with magenta asterisks in (a). The section on the tract lh.unc with different RD between the groups is highlighted with a shaded magenta rectangle in (b).

FA (b) and corresponding p-value (a) variation along (frontal to parietal) the tract lh.slfp in each group. The p-values in (a) were obtained using two-sample t-tests comparing FA at each point along the tract. The points along the tract with p-value <0.05 are highlighted with magenta asterisks in (a). The sections on the tract lh.slfp with different FA between the groups are highlighted with shaded magenta rectangles in (b).
Correlation between WM tract integrity in each of the groups and gait measurements
In both the MCI and CNC groups, no significant correlations was identified between single-task, fast, and dual-task counting gait velocities and the average DTI metric values along the center of the tracts that were different between the groups. However, when examining specifically the points along tracts that varied between groups, some associations were observed in MCI group while once more no significant correlation was found in the CNC group. Specifically, in the MCI group, two significant correlations were identified between gait velocities and the FA and RD values that differed between the groups on the rh.ccg tract (points shown in magenta in Figs. 2 and 3). The average FA of these points in the rh.ccg tract correlated with counting gait velocity (Table 5) and the average RD of these points on the rh.ccg tract correlated with usual gait velocity (Table 5). No other significant correlations were identified in either groups between gait velocities that differed between the groups and DTI measure from the specific points on the tracts that differed between the groups.
Results of the multiple linear regressions between the related gait or cognitive assessment parameter and average DTI metric (FA or RD) on the points along the related tract which differed between the groups in MCI group
The regression analyses including gait variables were adjusted by age, gender, education, number of comorbidities, and MoCA score. The regression analysis including cognitive assessment parameter was adjusted by age, gender, education, and number of comorbidities. *indicates significant correlation (p-value <0.05).
Correlation between WM tract integrity in each of the groups and gross cognition
In the CNC groups, no significant correlations was identified between MoCA and MMSE scores and the average DTI metrics along the center of the tracts that were different between the groups. However, in the MCI group, one significant correlation was identified. Specifically, the average RD along the center of the lh.unc tract correlated with MoCA score (Table 5). In both groups no significant correlations were observed between MoCA and MMSE scores and the average DTI measures at specific points on the center of the tracts that were different between the groups.
DISCUSSION
The microstructural integrity of 18 major WM tracts was compared between people with MCI and CNCs by examining the average fractional anisotropy and radial diffusivity measured by diffusion tensor imaging. In tracts that showed differences between the groups, DTI metrics along the tracts were also examined within an exploratory analysis to localize changes in tract integrity. Overall average FA and RD differed on the center of the major brain WM tracts between MCI and CNC groups. The most robust finding was lower FA and higher RD in the right cingulum-cingulate gyrus endings (rh.ccg) in the MCI group compared to the CNC group that was localized to the posterior part of the tract indicating disruptions of the cingulum fiber bundles in MCI subjects. Both the FA and RD of the specific points along the rh.ccg tract that were different between the groups also correlated with gait velocities [26, 84–87].
The average FA values in all WM tracts were similar in both groups except for rh.ccg which had higher FA in the CNC group and lh.slfp which had lower FA in the CNC group. Also consistent with previous findings, the highest FA was measured in the forceps major in both groups [45, 88]. The highest FA values after fmajor were measured in the cingulum and cerebrospinal tracts (Table 3) consistent with the observations in [88].
We found that the FA in the rh.ccg was significantly lower in people with MCI compared to CNC indicating lower structural integrity of these fibers in the MCI group consistent with previous DTI and tractography studies [40, 89]. In line with FA measurements, RD in the rh.ccg tract was higher in the MCI group compared to the CNC group once more indicating a disruption in this tract in MCI as previously reported [40, 89]. Interestingly, further analysis along the rh.ccg tract showed that FA was lower and RD was higher (Tables 3 and 4) in the posterior part of the tract (Figs. 1–3) in the MCI group compared to the CNC group indicating WM tissue disintegration in MCI subjects. Interestingly, the posterior part of the rh.ccg tract is adjacent to the posterior cingulate, one of the regions often implicated in MCI by PET, fMRI, and 1H spectroscopy studies of this condition [4, 90–97]. The correlation between average FA and RD of the points in the posterior portion of the rh.ccg tract that differed between the groups (shown in magenta in Figs. 2 and 3) and gait velocity (Table 5) in MCI subjects further emphasizes the importance of the cingulum tract as one of the major WM pathways disrupted by MCI-related pathologies [40, 89]. Cingulum fibers are a part of the limbic system and connect prefrontal and premotor cortices that contribute to both motor and cognitive performance [58–60]. The observed correlation between the average FA and RD in the posterior portion of the rh.ccg tract with gait velocities suggests that damaged fibers in this part of the tract may contribute to functional decline and highlights the importance of examining the posterior rh.ccg in future studies of AD progression.
In the lh.slfp, FA was higher in MCI subjects compared to the CNC group, specifically in the parietal end of this tract (Fig. 5). Higher FA in superior longitudinal fasciculus has previously been observed in people with MCI [88, 98] and is consistent with previous evidence of hyperactivity and hyperconnectivity in the parietal lobe in MCI subjects [99, 100]. This increase in FA may be associated with a simultaneous increase in axial diffusion and decrease in RD [88, 98] that may indicate a compensatory mechanism in MCI. Although the current study did not show a decrease in RD, RD did trend lower in this tract (p < 0.1). It is also possible that the increase in FA is artefactual, caused by a limitation of conventional DTI measurements in WM tracts with a high density of crossing fibers such as the superior longitudinal fasciculus [101].
In the lh.unc, RD was significantly lower in the MCI group though the difference was very small (Table 2). Further examination of RD along the lh.unc tract found that the end part of the tract near the orbitofrontal area had higher RD in the MCI group compared to CNC indicating WM tissue microstructure disruption in this part of the tract. This localized result is consistent with other studies reporting disintegration of WM in the uncinate fasciculus in people with MCI and AD [44, 102]. Interestingly, the affected segment of the lh.unc lies in the frontal and prefrontal cortex, brain areas with reduced activity and volume in people with MCI [100, 103–106]. It should be noted that this localized increase in RD was found despite an overall lower RD within the tract in the MCI group compared to controls (Table 4) and highlights the importance of examining regional variations in DTI metrics along tracts. The negative correlation between the average RD along the center of the lh.unc tract and the MoCA score, a measure of overall cognition, in the MCI group (Table 5), highlights the important role of the disintegration of this tract in impaired cognition in people with MCI, consistent with previous findings in people with MCI, mild AD, and vascular cognitive impairment [107–110].
Study limitations
One of the limitations of this study is that WM anomalies especially WMHs were not segmented in the studied subjects and hence were not included in the statistical analyses conducted as a confounding factor. Large volumes of WMHs especially those that intersect with the 18 major brain tracts included in this study could influence both WM tract integrity (independent variable) and brain gait/motor performance (dependent variable) and should be evaluated in future studies to help determine the etiology of the observed changes in gait and white matter tract integrity. Another limitation of this study is the small number of participants included. Including more participants would strengthen the reliability of the outcomes of the statistical analyses and may reveal additional WM tract disruptions in MCI and their impacts on brain motor/cognitive performance. Finally, the MCI group had lower years of education on average in comparison with the CNC group. Although the statistical analysis used in the current study incorporated years of education as a covariate, this difference could contribute to difference in the DTI parameter values observed between the groups. Previous studies have reported significant effects of education on white matter tract integrity [111–113] and this hypothesis could be examined directly in a future study.
Conclusions
This study found differences in the average DTI measures, FA and RD, along the center of major WM tracts between people with MCI and CNCs. Lower FA and higher RD were found in the right cingulum-cingulate gyrus endings indicating disruptions in this tract in MCI. An exploratory pointwise comparison along the right cingulum-cingulate gyrus endings tract found differences in both FA and RD indicating disruption of the posterior part of this tract adjacent to the posterior cingulate cortex in MCI subjects. FA and RD in the affected portion of the right cingulum-cingulate gyrus endings also correlated with single-task and dual-task gait velocities suggesting a crucial role for this tract in both motor and cognitive performance. Higher RD was found in the orbitofrontal end of the left uncinate fasciculus tract suggesting tissue microstructure disruption and higher FA was found in the parietal end of the left superior longitudinal fasciculus-parietal endings suggesting a compensatory mechanism in people with MCI.
Footnotes
ACKNOWLEDGMENTS
The authors have no acknowledgments to report.
FUNDING
This work was supported by the Canadian Institutes of Health Research, the Canada First Research Excellence Fund (BrainsCAN), Brain Canada, and the “Postdoctoral Fellowship in Care of the Older Adult” from the St. Joseph’s Healthcare Foundation, Parkwood Institute. The sponsors had no role in the study design; in the collection, analysis, and interpretation of data; in the writing of the report; and in the decision to submit the article for publication.
CONFLICT OF INTEREST
Robert Bartha and Manuel Montero-Odasso are members of the Editorial Board (Associate Editors) of this journal but were not involved in the peer-review process and did not have access to any information regarding peer-review. The authors have no conflict of interest to report.
DATA AVAILABILTY
Data from the Gait and Brain study used in this report cannot be shared publicly because the study is still ongoing, and the data contain personal health information. This restriction has been imposed by the ethics board of the University of Western Ontario. Data access queries can be directed to the corresponding authors.