
Abstract
Background:
Some previous studies showed abnormal pathological and vascular changes in the retina of patients with Alzheimer’s disease (AD). However, whether retinal microvascular density is a diagnostic indicator for AD remains unclear.
Objective:
This study evaluated the macular vessel density (m-VD) in the superficial capillary plexus and fovea avascular zone (FAZ) area in AD, explored their correlations with clinical parameters, and finally confirmed an optimal machine learning model for AD diagnosis.
Methods:
77 patients with AD and 145 healthy controls (HCs) were enrolled. The m-VD and the FAZ area were measured using optical coherence tomography angiography (OCTA) in all participants. Additionally, AD underwent neuropsychological assessment, brain magnetic resonance imaging scan, cerebrospinal fluid (CSF) biomarker detection, and APOE ɛ4 genotyping. Finally, the performance of machine learning algorithms based on the OCTA measurements was evaluated by Python programming language.
Results:
The m-VD was noticeably decreased in AD compared with HCs. Moreover, m-VD in the fovea, superior inner, inferior inner, nasal inner subfields, and the whole inner ring declined significantly in mild AD, while it was more serious in moderate/severe AD. However, no significant difference in the FAZ was noted between AD and HCs. Furthermore, we found that m-VD exhibited a significant correlation with cognitive function, medial temporal atrophy and Fazekas scores, and APOE ɛ4 genotypes. No significant correlations were observed between m-VD and CSF biomarkers. Furthermore, results revealed the Adaptive boosting algorithm exhibited the best diagnostic performance for AD.
Conclusion:
Macular vascular density could serve as a diagnostic biomarker for AD.
Keywords
INTRODUCTION
Alzheimer’s disease (AD) is the most common dementia type and is characterized pathologically by the accumulation of extracellular amyloid-β (Aβ) plaques and intracellular hyperphosphorylated tau protein [1]. With the aging of the global population and the increase in human life expectancy, the prevalence of AD has been rising year by year, posing a serious burden on societies and their families [2]. In sporadic AD, the neuropathological process was thought to begin years before the clinical symptoms [3]. However, the diagnosis of AD remains challenging today. It is estimated that up to 75% of dementia patients were undiagnosed worldwide, in particular in low- and middle-income countries [4]. As such, it is becoming increasingly urgent to discover a non-invasive, quick, and inexpensive biomarker for the diagnosis and intervention of AD in its early stage. Increasing evidence indicates that vascular dysfunction was involved in the pathophysiological mechanisms of AD [5–9]. The retinal microvasculature shares a common morphological and physiological feature with the cerebral microvasculature [10]. Due to the difficulties in assessing the brain vasculature, thus, the retina was considered to be the “window” to the brain. Some literature report that Aβ plaque deposition [11–14] and tau protein [14, 15] could be detectable in the retina of AD patients. Moreover, some previous studies found that patients with AD exhibit retinal vessel abnormalities including narrowed retinal venous diameter, damaged retinal blood flow rate [16], reduced vascular branching complexity [17], increased venular and arteriolar tortuosity [18], and increased retinal vessel oxygen saturation [19]. Nevertheless, other studies have not found abnormal pathological and vascular changes in the retina of patients with AD [20–22]. In addition, most of the retinal images were obtained from fundus photography or Doppler ultrasonography, which can only provide 60–300μm resolution and cannot identify minor pathologic changes in the retinal vasculature in AD [23].
Optical coherence tomography angiography (OCTA) is a novel, non-invasive, high-resolution retina imaging technology that can display the retinal microvasculature quantitatively and measure 5–15μm in diameter capillaries [23–25]. Some previous studies have reported the retinal microvasculature using OCTA in patients with AD; however, the results are conflicted [26–30]. Some studies showed a significant reduction in vessel density and/or an increase in foveal avascular zone area (FAZ) in AD participants [26–28]. However, others report that there was not any difference in OCTA metrics between patients with AD and healthy controls (HCs) [29, 30]. Although there are studies out there looking at mVD in preclinical AD, mild cognitive impairment, and AD [31, 32], no studies have looked at mVD in different severity of AD.
Recently, artificial intelligence, in particular machine learning, has been widely developed and applied in the medical field, including clinical diagnosis guiding [33], disease risk estimating [34], disease progression monitoring [35], and treatment efficacy assessing [36]. Machine learning enables computers “learn” from existing data to detect complex patterns and construct models. Accordingly, the present study aimed to evaluate the abnormality of vascular density and FAZ area through OCTA in patients with AD. Moreover, we explore whether retinal microvasculature changes occurred during the early phase of AD and, if so, whether these changes were different in different stages of AD. And we assessed the correlations between OCTA metrics and AD clinical parameters. In addition, we also evaluated the performance of common machine learning algorithms and the traditional statistical method based on OCTA measurements.
MATERIALS AND METHODS
Study participants
Patients with AD and HCs aged 50 to 80 years were consecutively enrolled between October 2018 and November 2019. AD participants were recruited from the memory clinic in Xiangya Hospital; and HCs from the Health Management Center of the Third Xiangya Hospital. Probable or possible AD was diagnosed based on the National Institute on Aging-Alzheimer’s Association guidelines [37]. HCs were defined as individuals with normal functions. Participants who had a history of ocular diseases (including cataract, glaucoma, uveitis, epiretinal membrane, macular hole, age-related macular degeneration, history of eye trauma, and any eye surgery), other neurologic, psychiatric disorders, or had systemic diseases that may affect vision (diabetes, uncontrolled hypertension, and ischemic heart disease) were excluded. We also excluded participants with 1) best-corrected visual acuity <0.5, 2) refractive spherical equivalent > +6.00 D or < –6.00 D and/or astigmatism > +3.00 D or < –3.00 D, 3) intraocular pressure >21 mmHg, 4) axial length >24 mm or <20 mm, and 5) media opacity (include the cornea, lens, vitreous, and aqueous humor). All participants completed the physical examination, ophthalmic examination, and neuropsychological evaluation on the same day. AD participants additionally underwent brain magnetic resonance imaging (MRI), cerebrospinal fluid (CSF) biomarker detection, and APOE genotyping. All measurements were performed in a blinded manner. All participants provided written informed consent before inclusion. This study complies with the guidelines of the Declaration of Helsinki and was approved by the ethics committee of Xiangya Hospital (No.201811199).
Optical coherence tomography angiography imaging
OCTA imaging of macula was acquired using Cirrus 5000 HD-OCT with AngioPlex OCT Angiography (Carl Zeiss Meditec, Inc., Dublin, CA, USA) for all participants. The OCTA instrument has a superluminescent diode optical source (center wavelength of 840 nm and bandwidth of 90 nm), capable of scanning at a rate of 68,000 A-scans per second, with a 5-μm axial resolution, and a 15-μm lateral resolution [25]. Owing to time constraints and a high correlation between both eyes, we selected one random eye for the OCTA examination. The macular vessel density (m-VD) in superficial retinal capillary plexus (SCP) consisting of vessels from the inner limiting membrane (ILM) to the inner plexiform layer (IPL) was analyzed. And the scan covered an area of 6×6 mm2 centered on the fovea. The standard angiographic scan pattern consists of 350 A-scans in each B-scan along the horizontal dimension and 350 B-scans in the vertical direction. In addition, the m-VD was measured in nine regions corresponding to the Early Treatment Diabetic Retinopathy Study (ETDRS). The ETDRS criteria comprised three concentric rings centered on the fovea, with diameters of 1 (the foveal area), 3 (inner rings), and 6 mm (outer rings), respectively. The inner and outer circles were divided into four quadrants: superior, inferior, nasal, and temporal. The FAZ area was automatically segmented and quantified by the OCTA software. A professional ophthalmologist (XB) manually reviewed the quality of every scan. Low-quality OCTA scans that signal strength of less than seven, exhibited motion artifacts, or had indistinct boundaries were excluded.
Cognitive function assessment
All participants completed the Chinese version of the Mini-Mental State Examination (MMSE) assessment [38]. AD participants underwent Montreal Cognitive Assessment (MoCA) and Clinical Dementia Rating (CDR) additionally. Disease severity of AD participants were evaluated based on CDR score: mild (CDR = 0.5), moderate (CDR = 1), and severe (CDR = 2).
AD-related biomarkers detection
The brain MRI scans were performed on the same 3-Tesla scanner (Magnetom Verio; Siemens, Erlangen, Germany) for all AD participants. The scans were next scored by an experienced scorer using the following rating scales: medial temporal lobe atrophy (MTA) [39], global cortical atrophy (GCA) [40], the Koedam’s scale for parietal cortical atrophy (PCA) [41], and the modified Fazekas scale [42]. The MTA, GCA, and PCA scales were used to evaluate brain atrophy. And the modified Fazekas scale was used to categorize white matter hyperintensities severity. In addition, we obtained 29 CSF samples from 29 AD participants for biomarker testing. Each CSF sample was mixed gently to avoid gradient effects and centrifuged at 2000× g for 10 min, then stored at –80°C. Concentrations of Aβ42, Aβ42/Aβ40 ratios, and phosphorylated tau, as well as total tau, were determined in the CSF by enzyme-linked immunosorbent assays. All measurements were performed in a blinded manner.
APOE genotyping
Genomic DNA was obtained from a 10 ml blood sample in ethylene diamine tetraacetic acid using previously established methods from 67 patients with AD [43]. According to the APOE status, participants were dichotomized as APOE ɛ4 carriers group (ɛ2/ɛ4, ɛ3/ɛ4, ɛ4/ɛ4) and APOE ɛ4 non-carriers group (ɛ2/ɛ2, ɛ2/ɛ3, ɛ3/ɛ3).
Statistical analysis
The statistical power analyses were conducted using Stata Statistical Software Release Version 15.0 (Stata), and the significant level (alpha) was 0.05. For comparison of clinical characteristics, Student’s t-tests, Chi-square tests, and One-way analysis of variance were used to assess the difference between the groups when the sample data was normally distributed. Otherwise, the non-parametric test was used. The analysis of covariate was used to compare OCTA metrics between AD and HCs groups, controlling for confounders (age, sex, and ophthalmologic parameters). The analysis of covariate with Bonferroni corrections was used to compare OCTA metrics across AD subgroups and for each subgroup versus HCs. To assess the correlations between OCTA metrics and clinical parameters, we performed the Pearson correlation analysis accounting for potential confounders. p < 0.05 was considered statistically significant. All data were presented in one of three ways: mean values±standard deviation, median values (25% quartile, 75% quartile), or percentages. Statistical analyses were performed using SPSS Statistics, version 25.0 (IBM Corp., Armonk, N.Y.).
Diagnostic model construction
OCTA variables with a significant p-value at the above statistical analyses were incorporated into the final diagnosis model. We evaluated the performance of six common machine learning algorithms, including extreme gradient boosting, Light Gradient Boosting Machine, k-nearest neighbor, Random Forest, Gradient Boost, and Adaptive boosting. Then, we compared the performance of these common machine learning algorithms with the traditional statistical approach (Logistic Regression). We randomly selected 70% of the data set to obtain the models and used the remaining 30% of the data set to test the performance of the models. Four criteria were used to evaluate the performance of each model, including the accuracy, the area under the curve, the f1 score, and recall. All the construction processes of diagnosis models were based on Python programming language (version 3.7).
RESULTS
General characteristics and clinical parameters
17 participants were excluded because they had a history of ocular diseases, 9 participants were excluded because of low signal strength, and 23 participants were excluded because of preexisting systemic diseases that may affect vision. Thus, a total of 222 participants (77 patients with AD and 145 HCs) were finally included in this study (Fig. 1). The mean age of the AD group was 61.94±8.41 years, and of the HCs group 60.34±7.14 years. There were 24 males and 53 females in the AD patient group and 56 males and 89 females in the HCs group. The years of education were lower in the AD group (9.65±3.74 years) compared to the HCs group (11.16±4.33 years, p = 0.010). The MMSE scores were lower in the AD group (16.30±5.88) than in the HCs group (23.05±3.65, p < 0.001). Age (p = 0.137), sex (p = 0.271), intraocular pressure (p = 0.275), best-corrected visual acuity (p = 0.162), and axial length (p = 0.185) were not significantly different between AD and HCs group (Table 1). Moreover, there was no difference among the subgroups of AD patients regarding age, sex, education levels, and ophthalmologic parameters (intraocular pressure, best-corrected visual acuity, axial length) (all p > 0.05). As expected, the severe AD group exhibited lower MMSE, MoCA, and CDR scores (all p < 0.001) (Table 1).
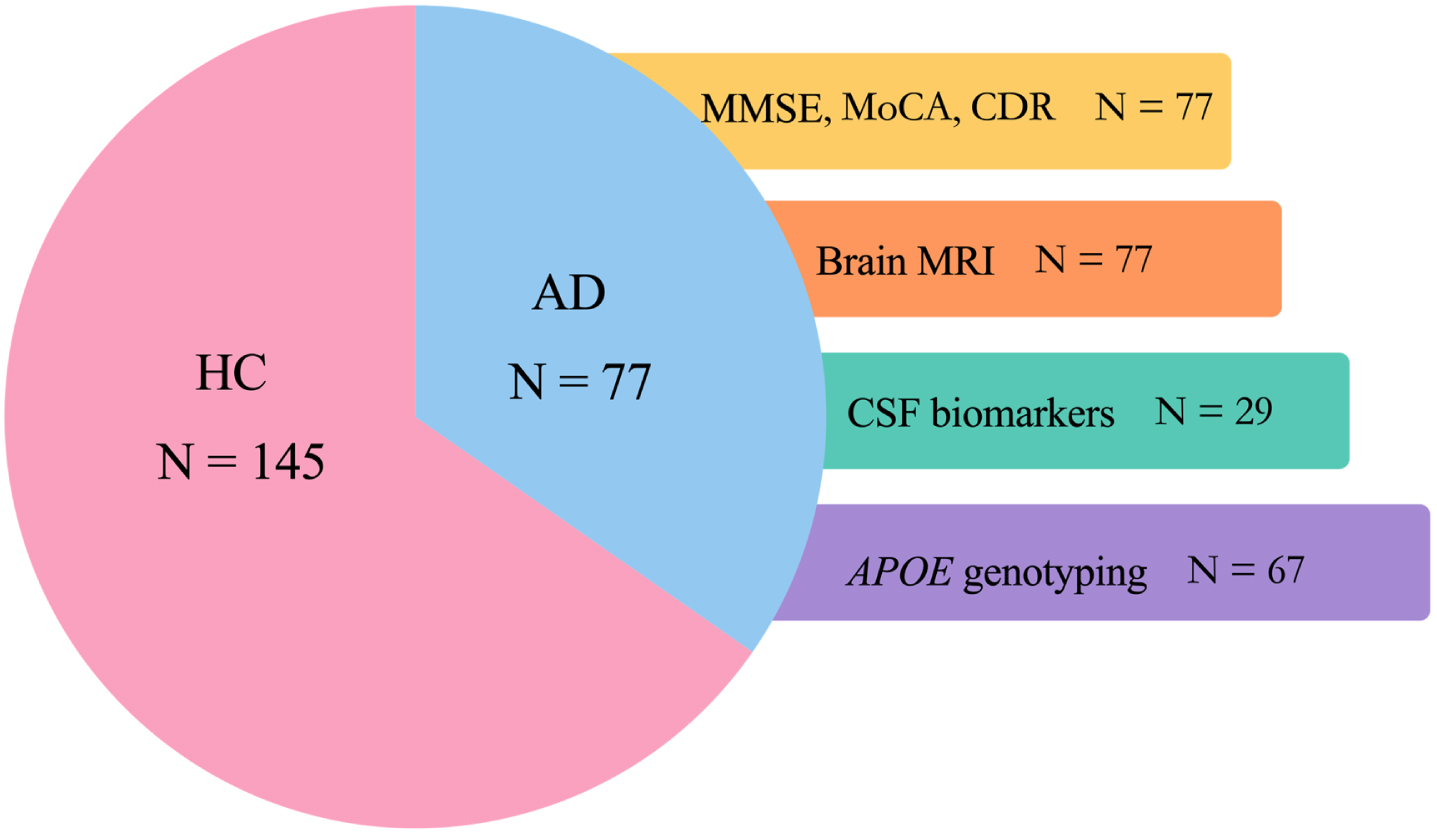
Flow diagram of all participants and study design. OCTA, optical coherence tomography angiography; HC, healthy controls; AD, Alzheimer’s disease; MMSE, Mini-Mental State Examination; MoCA, Montreal Cognitive Assessment; CDR, Clinical Dementia Rating; MRI, magnetic resonance imaging; MTA, medial temporal lobe atrophy; PCA, parietal cortical atrophy; GCA, global cortical atrophy; APOE, apolipoprotein E; CSF, cerebrospinal fluid; Aβ, amyloid-β; p-tau, phosphorylated tau; t-tau, total tau.
Demographic characteristics of all enrolled participants
Significant results appear in bold. a p values for comparisons between AD and HCs. b p values for comparisons across the three AD subgroups. AD, Alzheimer’s disease; HCs, health controls; IOP, intraocular pressure; BCVA, best-corrected visual acuity; AL, axial lengths; MMSE, Mini-Mental State Examination; MoCA, Montreal Cognitive Assessment; CDR, Clinical Dementia Rating. *Students t-test. †Pearson’s χ2 test. ‡One-way analysis of variance. §Non-parametric test.
Macular vessel density parameters
Compared with the m-VD of the HCs group, the m-VD of the AD group significantly declined in the fovea, SI, II, NI, TI, SO, IO, NO, TO, the inner ring, and the outer ring (all p < 0.05); and the statistical power were 99.92%, 99.53%, 99.77%, 99.85%, 98.96%, 77.34%, 99.47%, 85.43%, 89.97%, 99.98%, and 91.74%, respectively (Fig. 2, Table 2). AD group was classified into mild AD (n = 31), moderate AD (n = 27), and severe AD (n = 19) based on CDR scores (Fig. 1). Compared with the mild AD group and the moderate AD group, the severe AD group showed significantly lower m-VD in the fovea, superior inner (SI), inferior inner (II), nasal inner (NI), temporal inner (TI), inferior outer (IO), and temporal outer (TO) subfields, and the whole inner ring (p < 0.05) (Table 2). Compared with the HCs group, the mild AD group showed lower m-VD in the fovea, SI, II, and NI subfields and the whole inner ring (p < 0.05). Moreover, the m-VD exhibit a broader abnormality with increasing severity of AD. And, in the severe AD group, we found that m-VD in all ETDRS criteria regions and the whole inner ring, the whole outer ring was significantly lower than those in the HCs group. However, no significant difference in the FAZ area was noted regardless of the comparison between AD and HCs, or comparison among AD subgroups. Detailed results are summarized in Table 2.
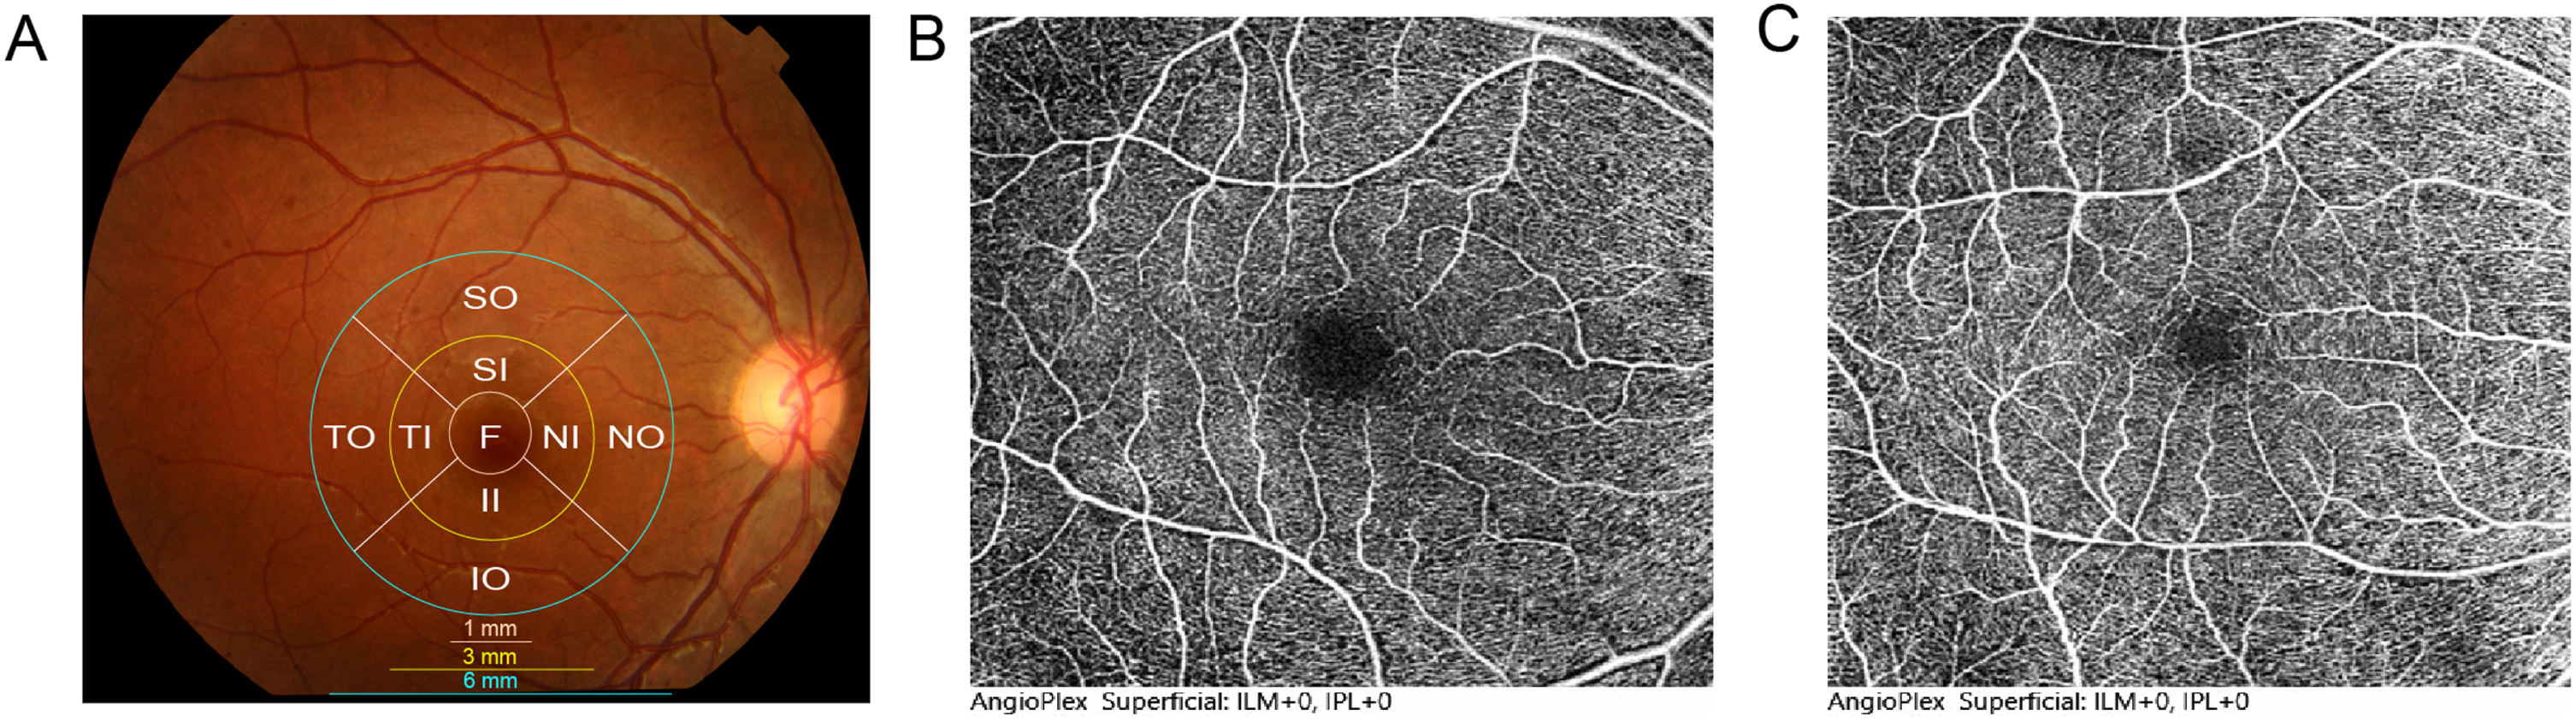
Representative OCTA images of the AD and HCs. A) Map of macular, 1 mm central circle, representing the center area, and inner and outer rings of diameters 3 mm and 6 mm, respectively. The inner and outer rings were divided into four quadrants: superior, nasal, inferior, and temporal. B, C) m-VD was significantly decreased in AD patients (B) compared to HCs (C).
Macular Vessel Density in AD and HCs patients
Significant results appear in bold. a p values for comparisons between AD and HCs. b p values for comparisons across the three AD subgroups. c Compared with the m-VD of the HCs group, the m-VD of the AD group significantly declined in the fovea, SI, II, NI, TI, SO, IO, NO, TO, the inner ring, and the outer ring; and the statistical power were 99.92%, 99.53%, 99.77%, 99.85%, 98.96%, 77.34%, 99.47%, 85.43%, 89.97%, 99.98%, and 91.74%, respectively. Significant difference among subgroups in the analysis of covariate: *, compared with HCs; †, compared with mild AD; ‡, compared with moderate AD; §, compared with severe AD. AD, Alzheimer’s disease; HCs, health controls; SI, Superior inner; II, Inferior inner; NI, Nasal inner; TI, Temporal inner; SO, Superior outer; IO, Inferior outer; NO, Nasal outer; TO, Temporal outer; FAZ, Foveal avascular zone.
Correlation between m-VD and cognitive function
We examined the correlations between the m-VD and cognitive function assessed by MMSE, MoCA scales accounting for the confounders (Fig. 3). The Pearson correlation analysis showed that m-VD in the superior inner (β= 0.258; p = 0.023), inferior inner (β= 0.252; p = 0.027), temporal inner (β= 0.236; p = 0.039), inferior outer (β= 0.226; p = 0.048), and temporal outer (β= 0.244; p = 0.033) subfields were positively associated with MMSE scores in AD participants. The m-VD in the superior inner (β= 0.247; p = 0.031) was positively associated with MOCA scores. In addition, the m-VD of the whole inner ring was positively associated with MMSE (β= 0.286; p = 0.012) and MoCA (β= 0.262; p = 0.021) scores.
Correlation between m-VD and AD-related biomarkers
We also explored the association between m-VD and AD-related biomarkers: brain imaging markers (MTA, PCA, GCA, and Fazekas), and CSF biomarkers (Aβ42, Aβ42/Aβ40, phosphorylated tau, and total tau) (Fig. 3). After controlling for potential confounders, we observed significant inverse associations between m-VD in superior outer (β= –0.240; p = 0.035), inferior outer (β= –0.226; p = 0.048) subfield and MTA score. Moreover, the m-VD in fovea (β= –0.267; p = 0.019), superior inner (β= –0.246; p = 0.031), nasal inner (β= –0.268; p = 0.018) subfield; and m-VD of the whole outer ring (β= –0.236; p = 0.039) were correlated negatively with the Fazekas score. No significant correlations were observed between m-VD and the PCA, GCA score, and m-VD and CSF biomarkers (Fig. 3).
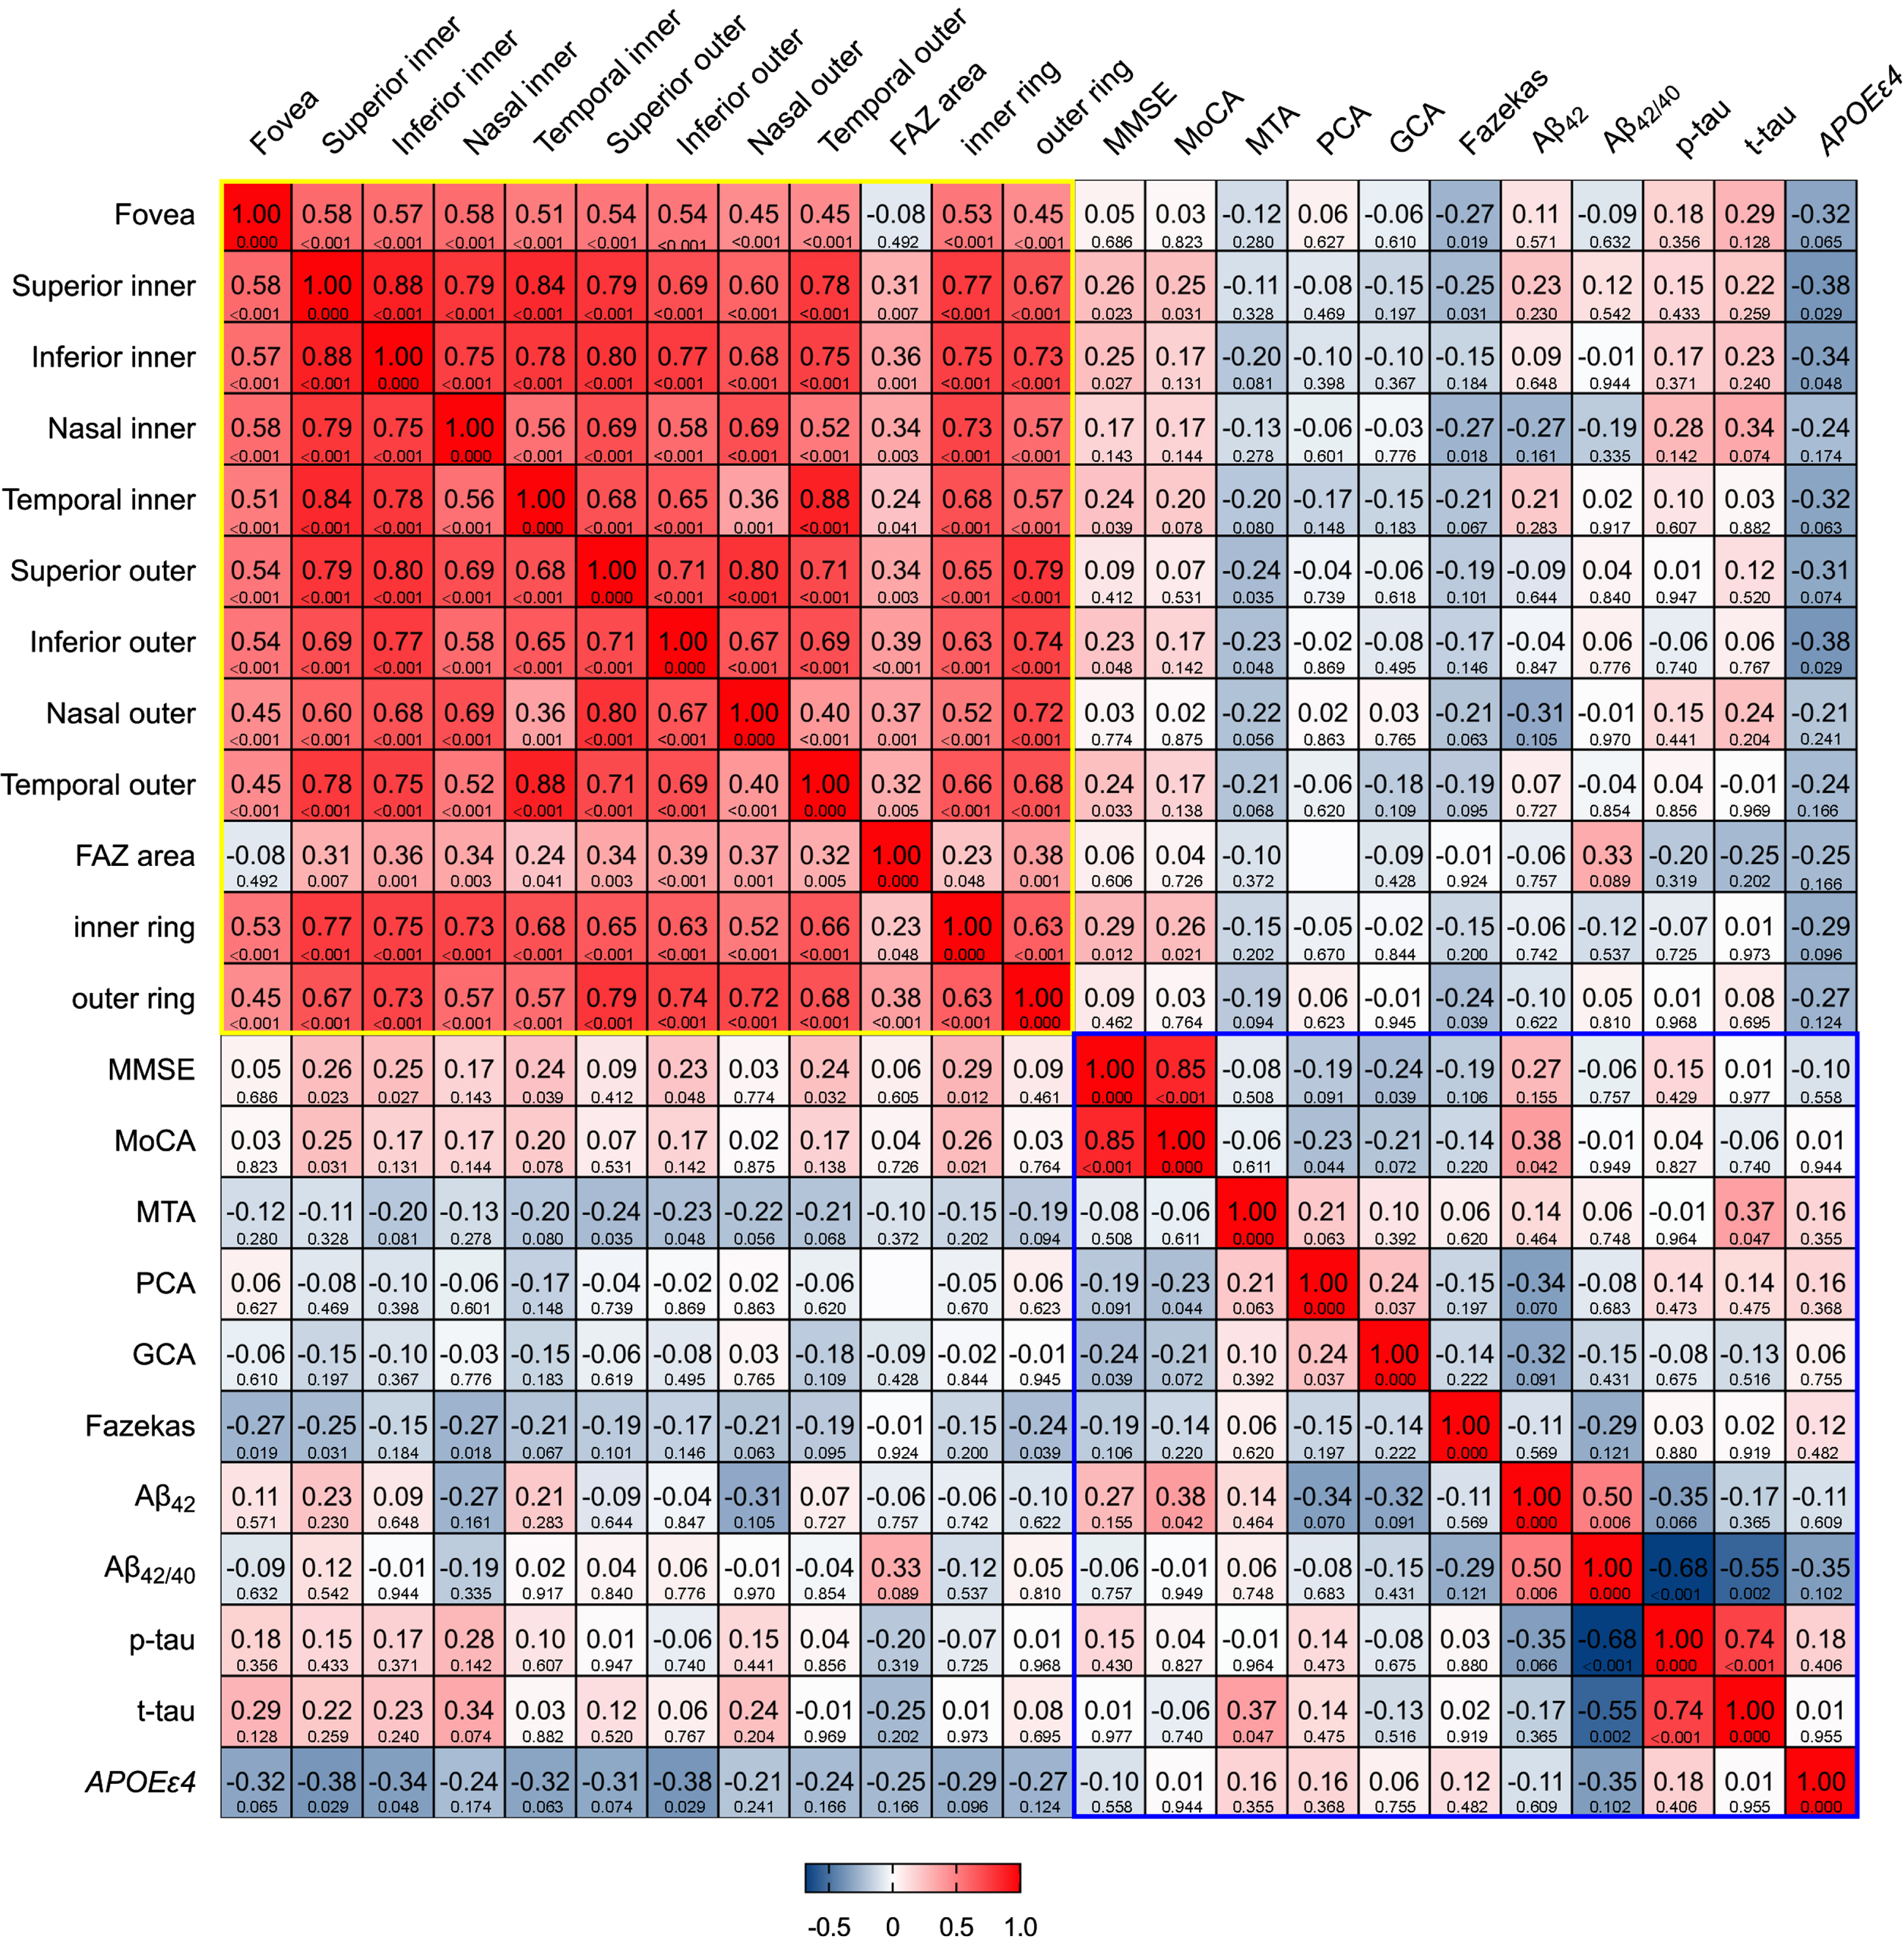
Heat map of correlation between m-VD and clinical parameters. There was a positive correlation between the m-VD of some subfields and the MMSE and MoCA scores. In addition, there was a significant negative correlation between m-VD of some subfields and medial temporal atrophy (MTA), Fazekas scores on MRI, and APOE ɛ4 genotypes. No significant correlations were observed between m-VD and cerebrospinal fluid biomarkers.
Correlation between m-VD and APOE genotypes
Of the 67 AD participants who underwent APOE genotyping, 32 were APOE ɛ4–group (ɛ2/ɛ3, ɛ3/ɛ3) and 35 were APOE ɛ4+ (ɛ2/ɛ4, ɛ3/ɛ4, ɛ4/ɛ4). The m-VD in the fovea (5.33±3.02 mm–1 versus 6.98±3.03 mm–1, p = 0.034), SI (14.81±2.99 mm–1 versus 16.81±3.00 mm–1, p = 0.010), II (14.17±3.37 mm–1 versus 16.57±3.38 mm–1, p = 0.006), TI (14.44±3.54 mm–1 versus 16.97±3.55 mm–1, p = 0.006), IO (15.04±2.58 mm–1 versus 17.02±2.59 mm–1, p = 0.004), TO (14.07±3.29 mm–1 versus 15.96±3.30 mm–1, p = 0.026) subfields and m-VD of the whole inner ring (14.23±3.24 mm–1 versus 16.62±3.25 mm–1, p = 0.005) were significant lower in the APOE ɛ4+ group than in the APOE ɛ4–group (Fig. 3).
The performance of different models in AD diagnosis
Statistical analysis showed that eleven variables (m-VD corresponded to nine ETDRS criteria subfields and m-VD of the whole inner ring, and outer ring) displayed a significant decrease in patients with AD and were incorporated into the final diagnosis model. All participants were randomly split into a training set (54 AD and 101 HCs) and a testing set (23 AD and 44 HCs) according to a 7:3 ratio. Results revealed that the Adaptive boosting algorithm was superior to the traditional Logistic Regression and other five machine learning algorithms. The Adaptive boosting algorithm exhibited the best diagnostic performance in the testing set with the evaluated results being accuracy (0.75), the area under the curve (0.73), f1 score (0.72), and recall (0.75) (Table 3).
The comparison of the performance of different models in AD diagnosis
Eleven variables (macular vessel density corresponded to nine ETDRS subfields and the whole inner ring, and outer ring) were incorporated into the final diagnosis model. Machine-learning methods included XGB Classifier, Light GBM, KNN, Random Forest, Gradient Boosting Classifier, and AdaBoost Classifier. The traditional statistical method was the Logistic Regression model. All participants were randomly split into a training set and a testing set according to a 7:3 ratio. AD, Alzheimer’s disease; ACC, accuracy; AUC, the area under the curve; XGBoost, extreme gradient boosting; Light GBM, Light Gradient Boosting Machine; KNN, k-nearest neighbor; AdaBoost, Adaptive boosting; ETDRS, Early Treatment Diabetic Retinopathy Study.
DISCUSSION
In this study, we found that m-VD was significantly lower in the AD group compared to the HCs group. And retinal microvasculature changes occurred during the early phase of AD and these changes were different in different stages of AD. In addition, the m-VD had a significant association with MMSE, MoCA, MTA, Fazekas scores, and APOE genotypes. Moreover, we found that the Adaptive boosting algorithm showed the best diagnostic performance for AD.
Someargethispage12pt previous studies found that m-VD in superficial retinal capillary plexus in the AD group was lower than those in the HCs group [23, 27]. However, other studies found that m-VD in superficial retinal capillary plexus did not differ between the AD and HCs groups [29, 44]. In addition, a recent study revealed a higher vessel density in Aβ+ normal cognitive individuals than Aβ–individuals [45]. The reasons for inconsistent results could be different inclusion and exclusion criteria, sample size, and the varied instruments used to measure vessel density. In this study, we found a significantly decreased in m-VD in all ETDRS criteria subfields in the AD group. This vasculature loss has been postulated caused by pathophysiological processes initiated by the retinal Aβ deposition. The Aβ may perform a “molecular sink” since it can confine vascular endothelial growth factors within the Aβ plaques by binding to it and competitively bound to the vascular endothelial growth factors-2 receptor, which in turn prevented angiogenesis processes [46]. In addition, local microglial reactivity and astrogliosis around Aβ plaques can induce retinal venule diameters to become smaller [47]. And the accumulation of Aβ leads to retinal pericyte loss induced by the declined expression level of vascular platelet-derived growth factor receptor-β eventually to vascular dysfunction and loss [48].
In addition, we found that m-VD in the ETDRS inner sections (the fovea, superior inner, inferior inner, nasal inner, and the whole inner ring) was significantly decreased in the mild AD group than in HCs. The finding indicated that retinal microvascular changes are specified regionally other than diffused in the early stage of AD. A previous study revealed that microvessel density was highest in the annular zone (0.5 to 1.25 mm from the fovea) [49], corresponding to the retinal inner section in our study. Therefore, the microvasculature in the retinal inner section is more vulnerable to pathology early in the course of AD. In addition, it is reported that most of the Aβ deposits are in the innermost retinal layers [12]. The preferential decreased microvascular density in the inner region can be accounted for by the uneven distribution of Aβ in the retina. Furthermore, we observed a decreasing trend of m-VD in this study as the severity of AD increased. This result suggests that the retinal microvascular damage might be acted as a reliable biomarker for the early diagnosis of AD.
FAZ was defined as the capillary-free area in the center of the macula. Some studies revealed a larger FAZ area in the AD group compared to HCs [26, 51], whereas others showed no significant changes in the FAZ area [23, 52–54]. In the current study, we observed no significant change in the FAZ area in the AD group as compared to the HCs. One possible explanation is the greater variability of the FAZ area, which is susceptible to potential confounders, such as age, sex, race, and axial length [55, 56]. Thus, we believe that we should give caution when choosing the FAZ area to serve as a biomarker of AD. Recently, Ometto et al. designed a novel, fast algorithm for 3-dimensions measurement of the FAZ volume based on OCTA [57]. This algorithm enables the measurement of the FAZ reliably and efficiently. Therefore, we could use this algorithm to assess the FAZ area in a larger cohort in the future.
MMSE and MoCA are used to assess global cognitive function, and lower scores indicate worse cognitive function. In the current study, we found that decreased m-VD in superficial retinal capillary plexus was associated with more serious cognitive impairment, as reported before [26, 51]. Our data suggest that m-VD in superficial retinal capillary plexus could help monitor the severity of the cognitive decline. To the best of our knowledge, this is the first report of an association between m-VD and visual atrophy rating scale on MRI in AD. We found that m-VD in superficial retinal capillary plexus was negatively associated with MTA scores. Kim et al. demonstrated that cerebral blood flow was associated with regional cerebral atrophy. Their study reported that cerebral blood flow was reduced mainly in the parietal and medial temporal regions, and these regions showed atrophy in the later stage of AD [58]. Further, consistent with previous studies [29, 52], results showed a significant negative association between m-VD in superficial retinal capillary plexus and Fazekas score. The Fazekas scale is used to quantify the severity of white matter lesions caused by hypoperfusion and cerebral blood flow dysfunction [59]. These data suggest that retinal microvascular changes in AD can reflect the state of white matter lesions in AD. However, we did not find any correlation between m-VD and the established CSF biomarkers of AD. One possible reason is the limited CSF samples in our study and further studies are needed to validate our findings.
In addition, we observed that m-VD in the superficial retinal capillary plexus in the APOE ɛ4 carriers group was lower than those in APOE ɛ4 non-carriers group. A previous study has confirmed that the vascular endothelial growth factor levels declined in the retina of APOE ɛ4 mice [60]. And another study revealed that APOE ɛ4+ AD participants had a higher retinal level of Aβ [61], which lead to microvasculature loss as we discussed above pathophysiologic processes.
Our study revealed that the Adaptive boosting algorithm exhibited the best diagnosis performance for AD, including the highest accuracy, f1 score, and recall for the testing set. The Adaptive boosting algorithm based on OCTA measurements were superior to traditional Logistic regression and the other five machine learning algorithm; and exhibited certain potential in the diagnosis of AD. Therefore, we confirmed that artificial intelligence models had a wide range of application prospects in clinical applications. Because of its ability to detect complex patterns and construct models, it was available to assist clinical diagnosis of AD, and thus, achieve the aim of early intervention and optimizing treatment strategies. Further studies were needed to validate these findings.
Our current study has some limitations. First, this was a cross-sectional study. Second, our sample size was limited due to the strict inclusion and exclusion criteria. Third, we did not evaluate the deep capillary plexus since it is not easy to segment and prone to artifacts. In addition, the effect of medications on the presented correlations is not considered. The AD medication is one potential confounding variable that can bias the result. Further longitudinal studies with a larger sample are warranted.
In conclusion, this study investigates the changes in retinal vessel density in AD groups and evaluated their correlation with clinical parameters comprehensively. Results showed that m-VD variations, in particular in the retinal inner sector, could be detected in the early stage of AD by OCTA. Furthermore, m-VD is associated with cognitive function, AD-related biomarkers, and APOE genotypes. Finally, we validated an optimal machine-learning algorithm that could provide a good reference for the AD diagnosis. Overall, we believed that macular vascular density could serve as a diagnostic biomarker for AD.
Footnotes
ACKNOWLEDGMENTS
We are grateful to all participants who participated in the study.
This study was supported the National Key R&D Program of China (No.2020YFC2008500, 2017YFC0840100, 2017YFC0840104, 2018YFC1312003, 2016YFC1306000), the National Natural Science Foundation of China (No.81671075, 81971029, 82071216, 81901171), Hunan Innovative Province Construction Project (No.2019SK2335).