
Abstract
Background:
Synaptic disruption precedes neuronal death and correlates with clinical features of Alzheimer’s disease (AD). The identification of fluid biomarkers of synaptic damage is emerging as a goal for early and accurate diagnosis of the disease.
Objective:
To perform a systematic review and meta-analysis to determine whether fluid biomarkers of synaptic damage are impaired in AD.
Methods:
PubMed, Scopus, EMBASE, and Web of Science were searched for articles reporting synaptic proteins as fluid biomarkers in AD and cognitively unimpaired (CU) individuals. Pooled effect sizes were determined using the Hedge G method with random effects. Questions adapted from the Quality Assessment of Diagnostic Accuracy Studies were applied for quality assessment. A protocol for this study has been previously registered in PROSPERO (registration number: CRD42021277487).
Results:
The search strategy identified 204 articles that were assessed for eligibility. A total of 23 studies were included in the systematic review and 15 were included in the meta-analysis. For Neurogranin, 827 AD and 1,237 CU subjects were included in the meta-analysis, showing a significant increase in cerebrospinal fluid of patients with AD compared to CU individuals, with an effect size of 1.01 (p < 0.001). A significant increase in SNAP-25 and GAP-43 levels in CSF of patients with AD was observed.
Conclusion:
Neurogranin, SNAP-25, and GAP-43 are possible biomarkers of synaptic damage in AD, and other potential synaptic biomarkers are emerging. This meta-analysis also revealed that there are still relatively few studies investigating these biomarkers in patients with AD or other dementias and showed wide heterogeneity in literature.
Keywords
INTRODUCTION
Alzheimer’s disease (AD) is the leading cause of dementia worldwide and one of the greatest challenges of the 21st century. The identification of accurate and early biomarkers of disease is one of the main goals of research in the field of AD. In fact, in vivo demonstration of altered biomarkers of amyloid-β (Aβ) pathology, pathological tau deposition, and neurodegeneration represent the main construct of the ATN system proposed by the National Institute of Aging and the Alzheimer’s Association (NIA-AA) [1].
Although the neuropathological hallmarks of AD are identified in the deposition of senile plaques and neurofibrillary tangles in the brain [2, 3], much evidence correlates the cognitive alterations which clinically characterize the disease with dysfunction and loss of synapses [4, 5]. The existence of individuals who, despite the presence of senile plaques and neurofibrillary tangles in the brain, do not develop signs and symptoms of AD has been extensively described [6, 7]. In these individuals, this phenomenon has been recently associated with the presence of substantial integrity of synapses and absence of tau oligomers at their level [8], emphasizing the importance of synaptic dysfunction as one of the earliest pathophysiological events that characterize AD. These findings have therefore driven the scientific interest towards the identification of possible biomarkers of synaptic dysfunction.
In the last decade, several proteins have been proposed as possible biomarkers of synaptic damage and the three most investigated synaptic proteins are Neurogranin, Synaptosome-associated protein 25 (SNAP-25), and Synaptotagmin-1 (Fig. 1) [9, 10].
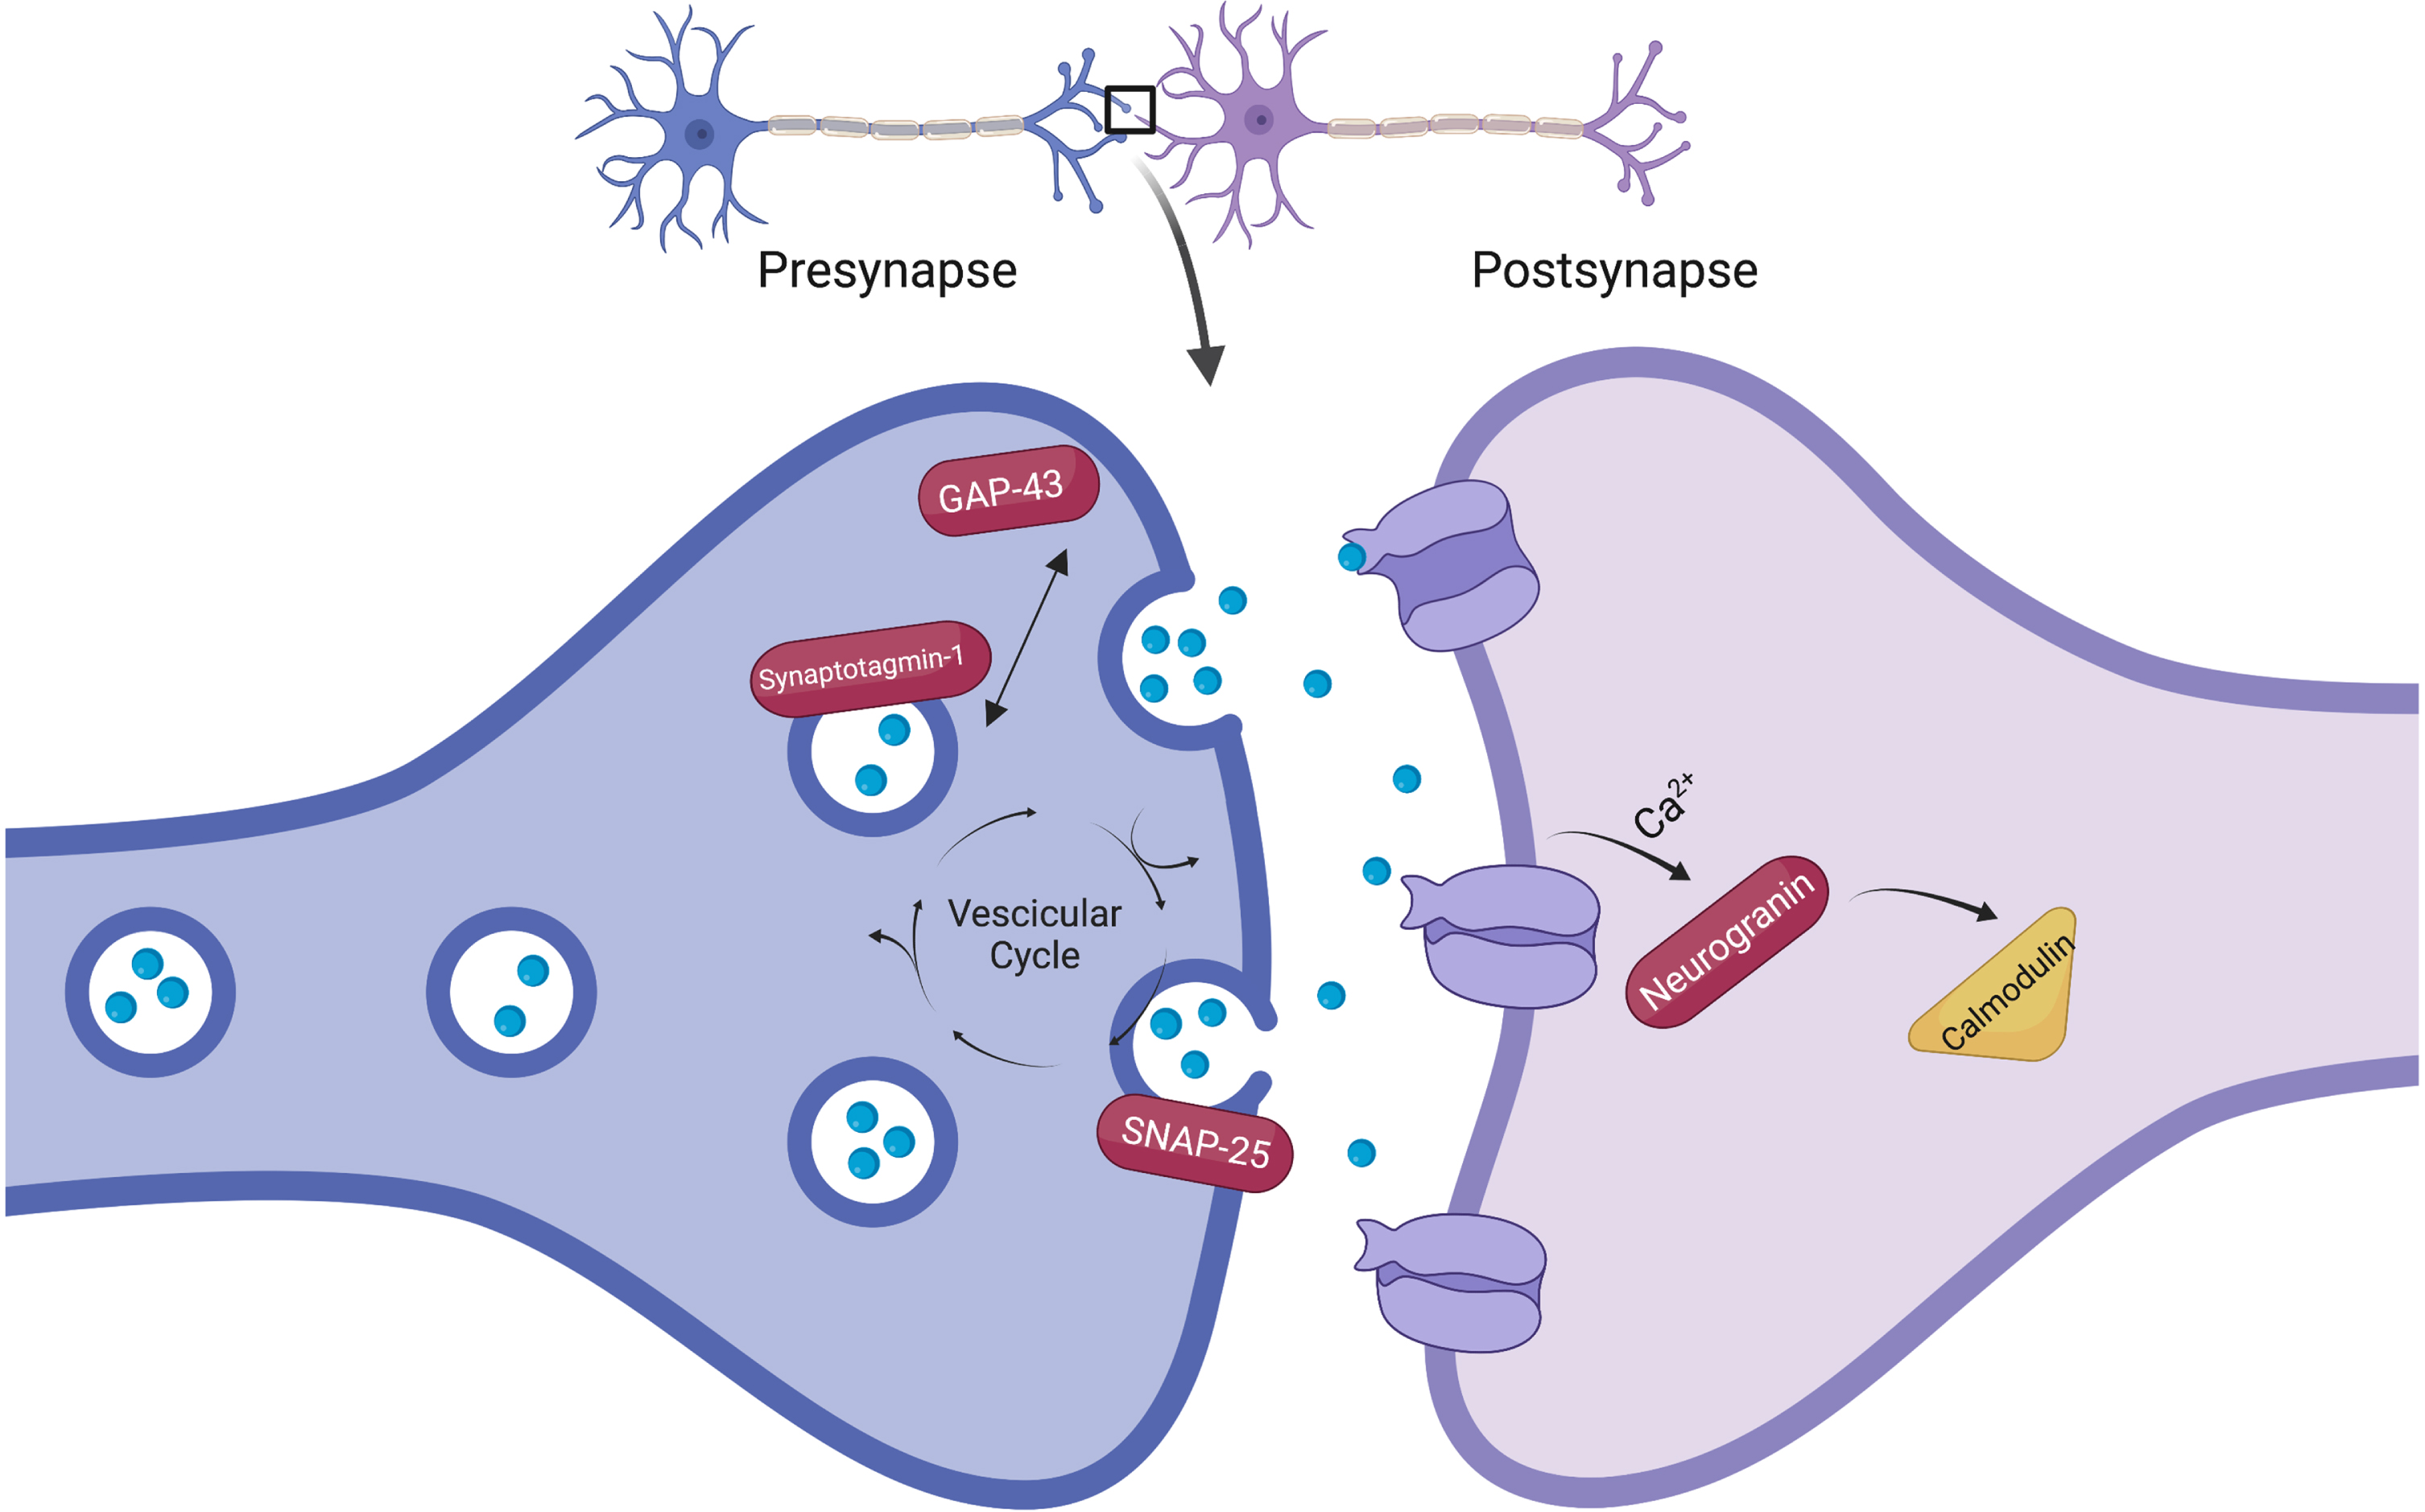
Schematic representation of the most studied synaptic biomarkers. Neurogranin is localized postsynaptically, while synaptosome-associated protein 25 (SNAP-25), growth-associated protein 43 (GAP-43) and Synaptotagmin-1 are localized presynaptically. The figure is made with www.biorender.com.
Neurogranin is a postsynaptic calmodulin-binding protein involved in the modulation of activity-dependent synaptic plasticity and long-term potentiation [11] and could play a role in AD. Increased concentrations of neurogranin in the cerebrospinal fluid (CSF) of AD patients have been demonstrated in some studies [12, 13], and its levels correlate with brain atrophy, Aβ burden, and other CSF biomarkers in AD patients [14]. Furthermore, neurogranin levels could predict disease progression and conversion to dementia in AD patients over time [15]. Overall, available data indicate still conflicting results on the use of neurogranin as a biomarker in AD [9]. Synaptosome-associated protein 25 and synaptotagmin-1 are two proteins involved in synaptic vesicle exocytosis and thus considered markers of synaptic activity. They have also emerged as possible diagnostic tools in AD, resulting increased in the CSF of patients compared to healthy controls [16, 17].
However, at present, there is no consensus on the use of these synaptic biomarkers in the diagnosis of AD. With this assumption, we conducted a systematic review with meta-analysis to assess whether fluid synaptic biomarkers are impaired in AD, aiming to advance our understanding of their role and possible future applications.
METHODS
Standard protocol approvals, registrations
The systematic review and meta-analysis were performed in accordance with the Preferred Reporting Items for Systematic Reviews and Meta-analyses (PRISMA) guidelines [18]. A protocol for this study has been previously registered in PROSPERO (registration number: CRD42021277487).
Search strategy
PubMed, Scopus, EMBASE, and Web of Science were searched for articles reporting synaptic proteins as fluid biomarkers in AD. Search terms applied for literature search are reported in the Supplementary Material. No language, study design restrictions, or date of publication limit were applied. The search was conducted by one author (F.R.) up to October 1, 2021; an update of the search to include any additional studies was made on June 18, 2022. The list of included studies was screened (F.R., A.C., and M.S.) to identify eligible articles for inclusion. We included in the meta-analysis all case– control studies with extractable data, published either as full-length articles or letters in peer-reviewed journals. No gray literature was searched because of the significant risk of introducing bias into the interpretation of results. The authors of the selected manuscripts were contacted in case of incomplete data or questions about data extraction. If there was no reply after two contacts occurring at least 15 days apart, the study was not included in the meta-analysis.
Data screening and inclusion and exclusion criteria
Study inclusion and exclusion were performed with a prescreening based on title and abstract. If no evident exclusion criteria were observed (i.e., reviews or editorials, studies not related to AD or conducted using in vitro, animal models, or postmortem analysis), a full-text analysis was conducted independently by two authors (F.R. and M.S.). Any disagreement was discussed and resolved with two different authors (A.C. and S.B.). All studies reporting synaptic biomarkers in the blood (serum/plasma) and/or CSF of patients with AD and with healthy individual cognitively unimpaired (CU) were included in the meta-analysis. According to recent review updates [9, 10] priority attention was given to the proteins neurogranin, SNAP-25, and synaptotagmin-1. The following exclusion criteria were applied: studies with less than 10 AD participants, control group with inflammatory conditions or with neurologic or psychiatric diagnosis (and no healthy control group), and biomarkers measured by nonquantitative methods. Only studies presenting data as mean and standard deviation (SD) or standard error (SE) and using established criteria for AD diagnosis, including clinically defined [19] and biomarker-defined [1, 20–22] criteria were selected for the meta-analysis.
Data extraction
Data extraction from included studies was conducted independently by two authors (F.R. and A.C.). Data extracted were sample size; sex (expressed as percentage of men in each group); age; AD diagnostic criteria; fluid sample; detection method; biomarker mean and SD. When available, we also extracted data on CSF concentrations of Aβ42 and phosphorylated tau (P-tau); data on total tau levels could not be extracted from most of the studies. When data were reported only in graphs, a digital ruler was utilized to estimate the biomarker values, as previously described [23]. Whether this method also failed, the authors were contacted. In case of different studies analyzing the same biomarker on the same cohort (e.g., Alzheimer Disease Neuroimaging Initiative cohort), the one with the highest number of included subjects was selected. Genetic background was not considered in this analysis due to the paucity of genetic information in cohorts.
Bias assessment
Risk of bias was assessed by two authors independently (F.F. and A.G.) following the revised Quality Assessment of Diagnostic Accuracy Studies (QUADAS-2) [24], a tool recommended for use in systematic review. The 12 questions adapted from the QUADAS-2 and applied in this study are listed in the Supplementary Material. Only studies with biomarker-supported diagnosis were considered at low risk of bias in the assessment section. Publication bias was tested by visual inspection of funnel plots and by Egger’s regression test.
Statistical analysis
Studies were grouped according to the synaptic biomarker used and a meta-analysis was conducted for each of them. To consider intrinsic variability, the Hedge G method with random-effect models was applied to pool effect sizes to determine overall effect size with 95% confidence intervals. The significance of pooled effect sizes was measured with the z test. Results were statistically significant if the corrected p value was < 0.05. Individual study weights were estimated with the inverse of the variance. The heterogeneity among studies was identified with the χ2 test quantified by I2. The I2 values of 25%, 50%, and 75% were low, moderate, and high heterogeneity, respectively. Publication bias was tested by Egger’s regression test. All the analyses were conducted with SPSS version 28.0.
RESULTS
The initial search strategy (identified 1,238 records in PubMed, 1,023 in Scopus, 1,503 in EMBASE, and 998 in Web of Science. After duplicates (n = 2,133) removal, 2,627 abstracts were screened. A search update performed on June 18, 2022 on the same databases described above identified an additional 402 articles. A total of 2,827 articles were excluded after title and abstract reading. Two hundred and four full texts were assessed for eligibility. Eight authors were contacted to access further information, of whom five were unresponsive. Twenty-three studies were included in the systematic review and 15 studies were included in the meta-analysis (Fig. 2).
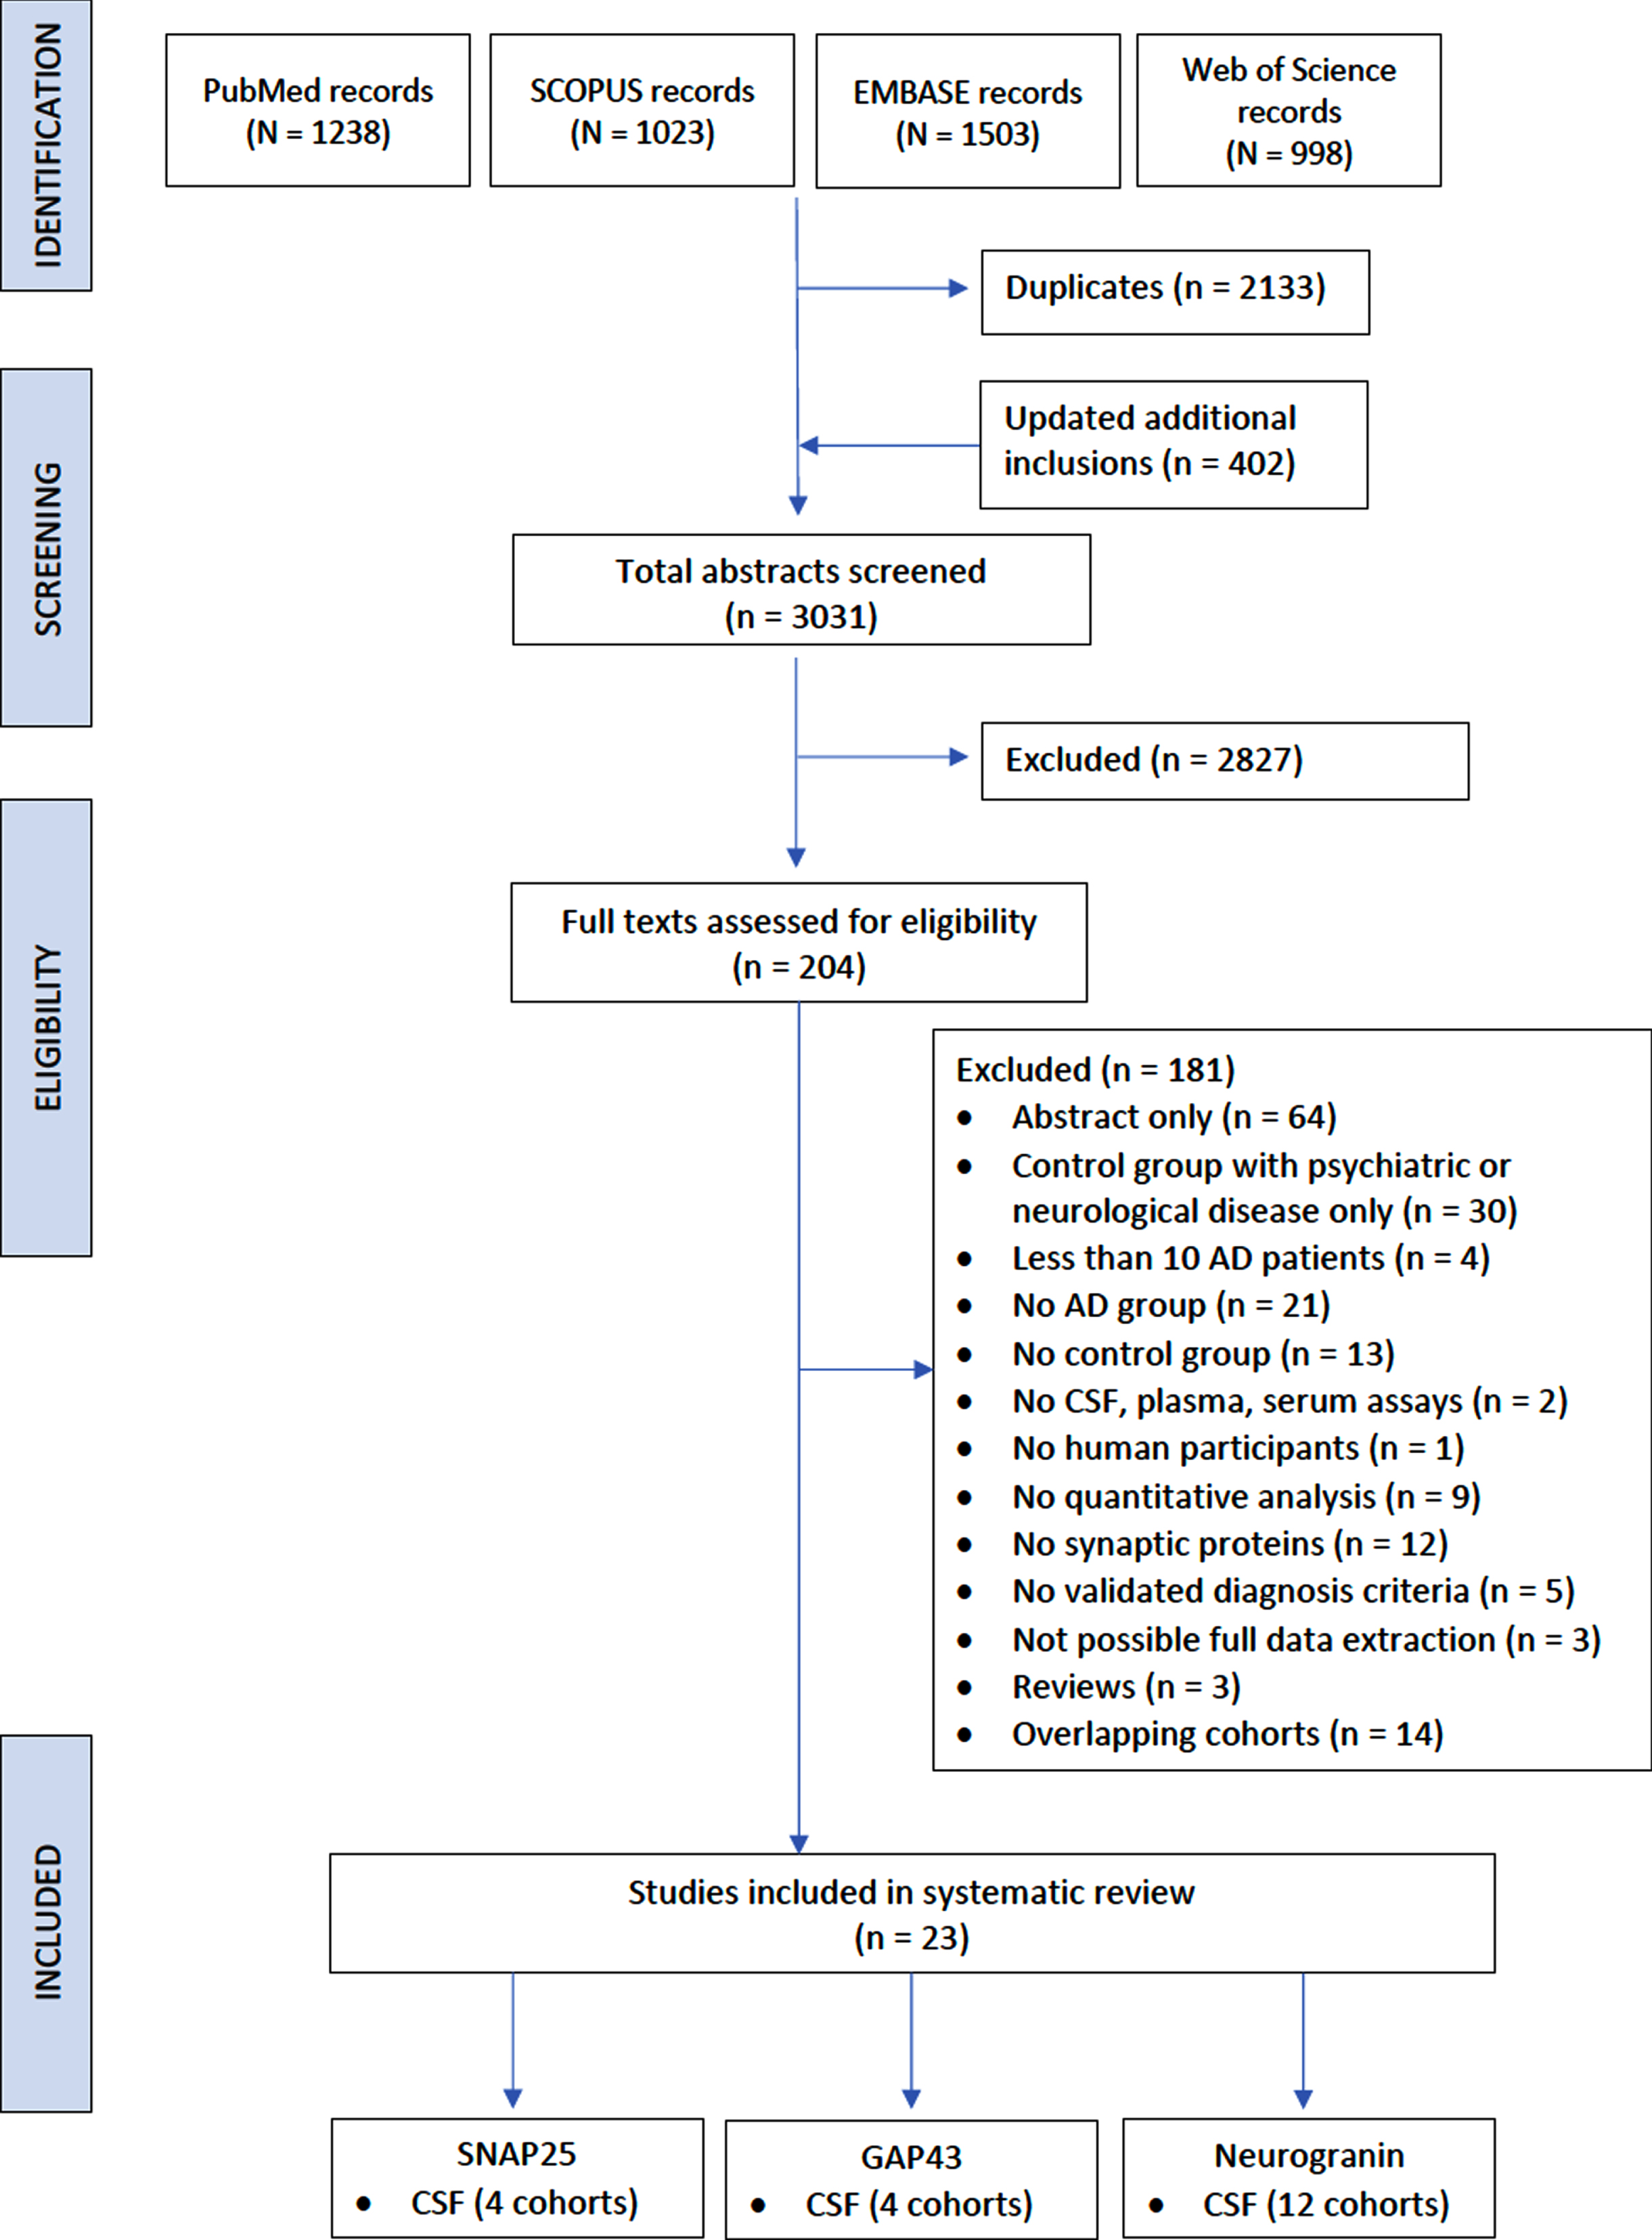
Study selection flow. Flowchart of included studies. AD, Alzheimer’s disease; CSF, cerebrospinal fluid; SNAP-25, synaptosome associated protein-25; GAP-43, growth associated protein-43.
Most studies were classified as being at intermediate risk of bias. Data for the individual items of the instrument are shown in Supplementary Table 1.
Neurogranin
Among the studies examined, the most investigated synaptic protein was found to be neurogranin. The main characteristics of the studies included in the systematic review are shown in Table 1.
Description of included studies (neurogranin)
MMSE, Mini-Mental State Examination; CSF, cerebrospinal fluid. *Expressed in mean (SE). †Expressed in median (IQR).
Most of the studies analyzed Neurogranin levels in CSF. Only a few studies evaluated neurogranin concentrations in other body fluids as plasma.
For CSF analysis, the most frequently used method to evaluate neurogranin concentrations was enzyme-linked immunosorbent assay (ELISA). All studies included in the meta-analysis used ELISA to assay neurogranin in CSF. Twelve independent cohorts were included in the meta-analysis, with a total of 827 AD patients and 1,237 control subjects. We found a significant increase in Neurogranin levels in CSF of patients with AD compared to CU individuals (z = 4.82; p < 0.001), with an effect size of 1.01 (95% CI 0.60 –1.42) (Fig. 3).
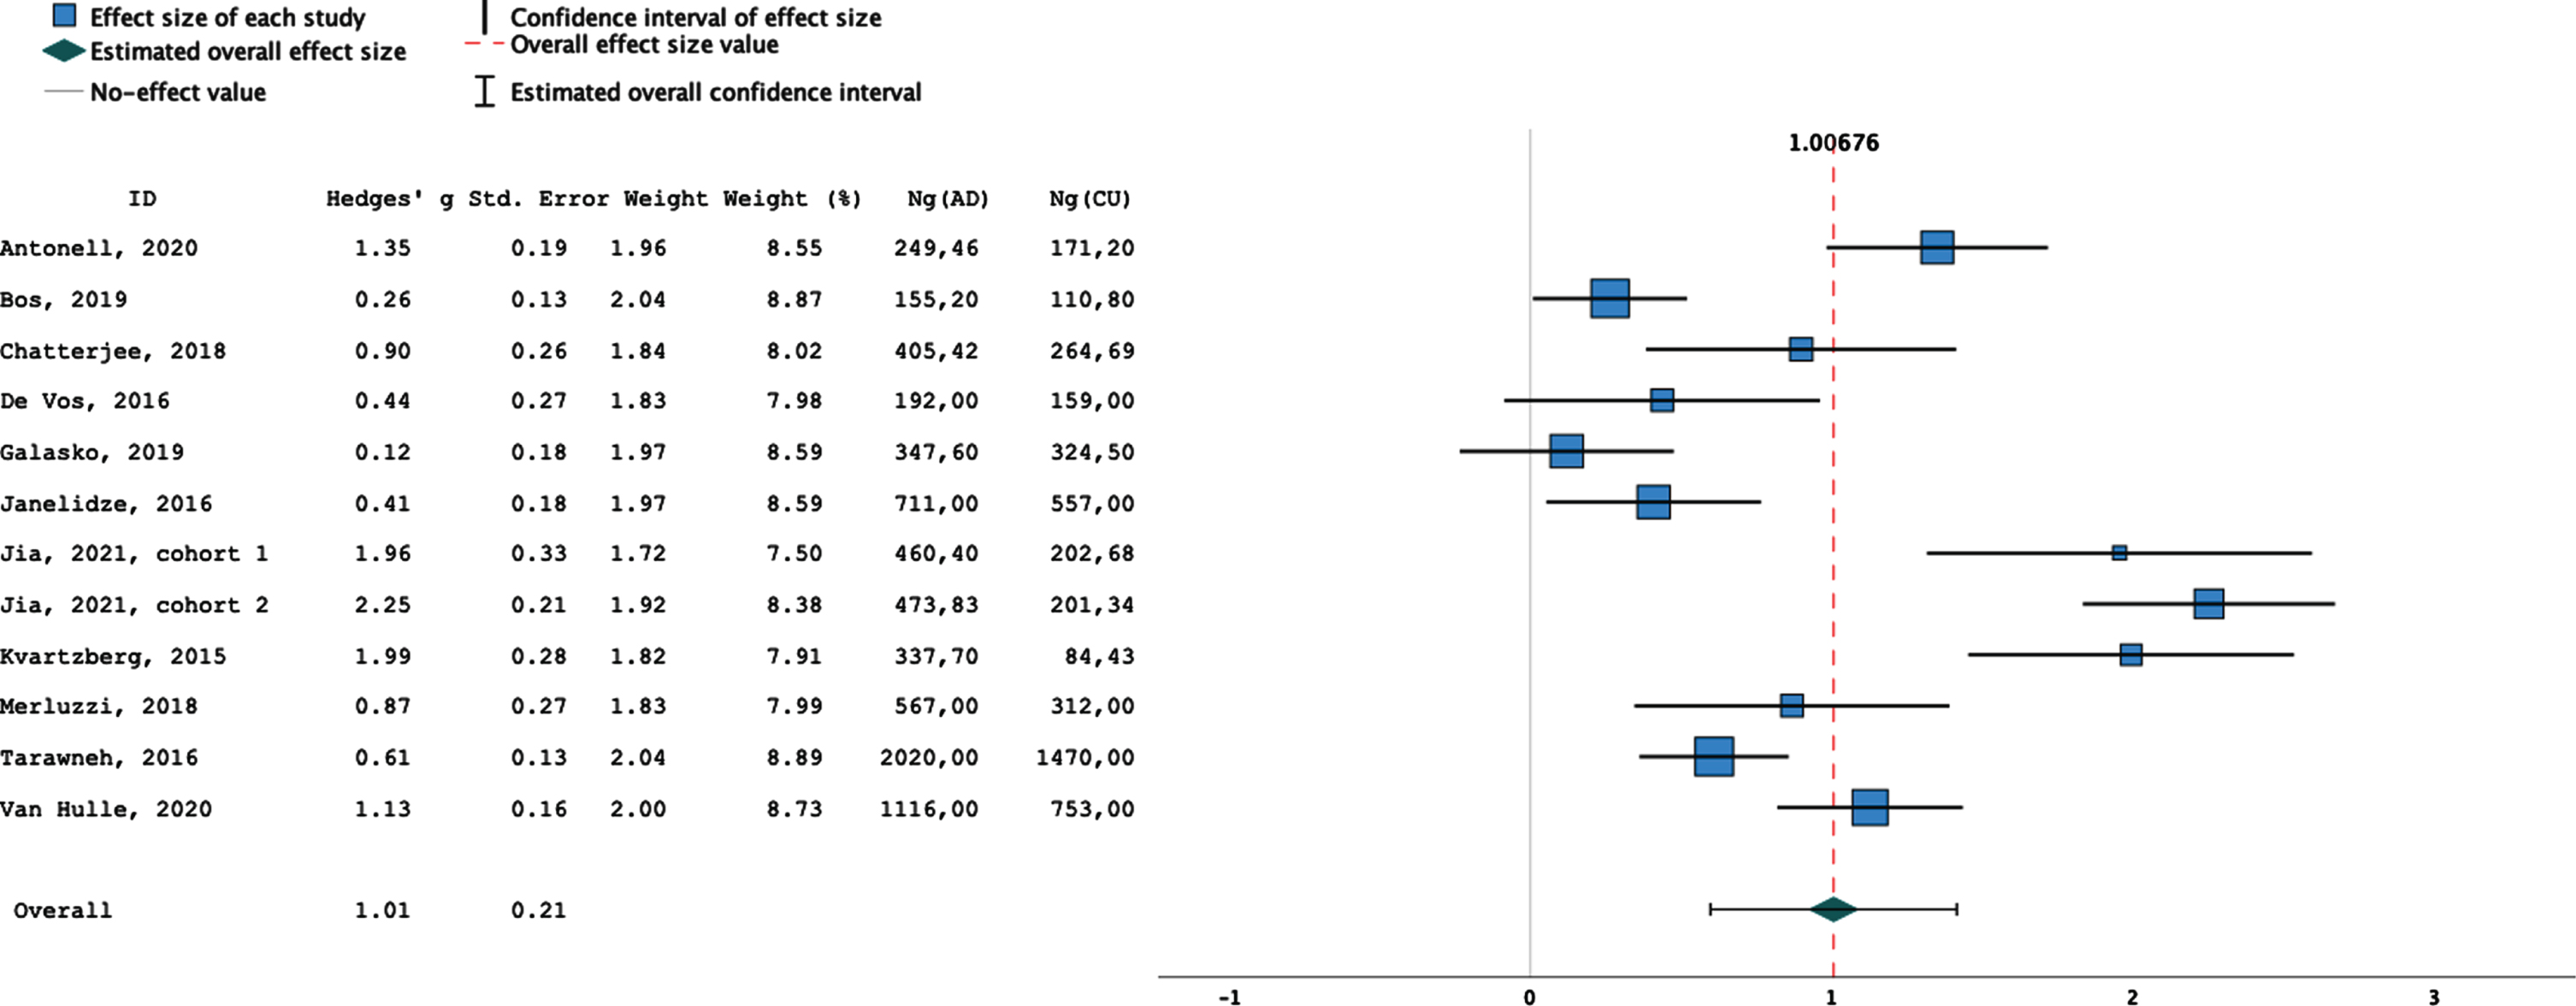
Neurogranin in CSF: Forest Plot of included studies. The last 2 columns on the right indicate the mean values of neurogranin in AD patients and controls of each study, expressed in pg/ml.
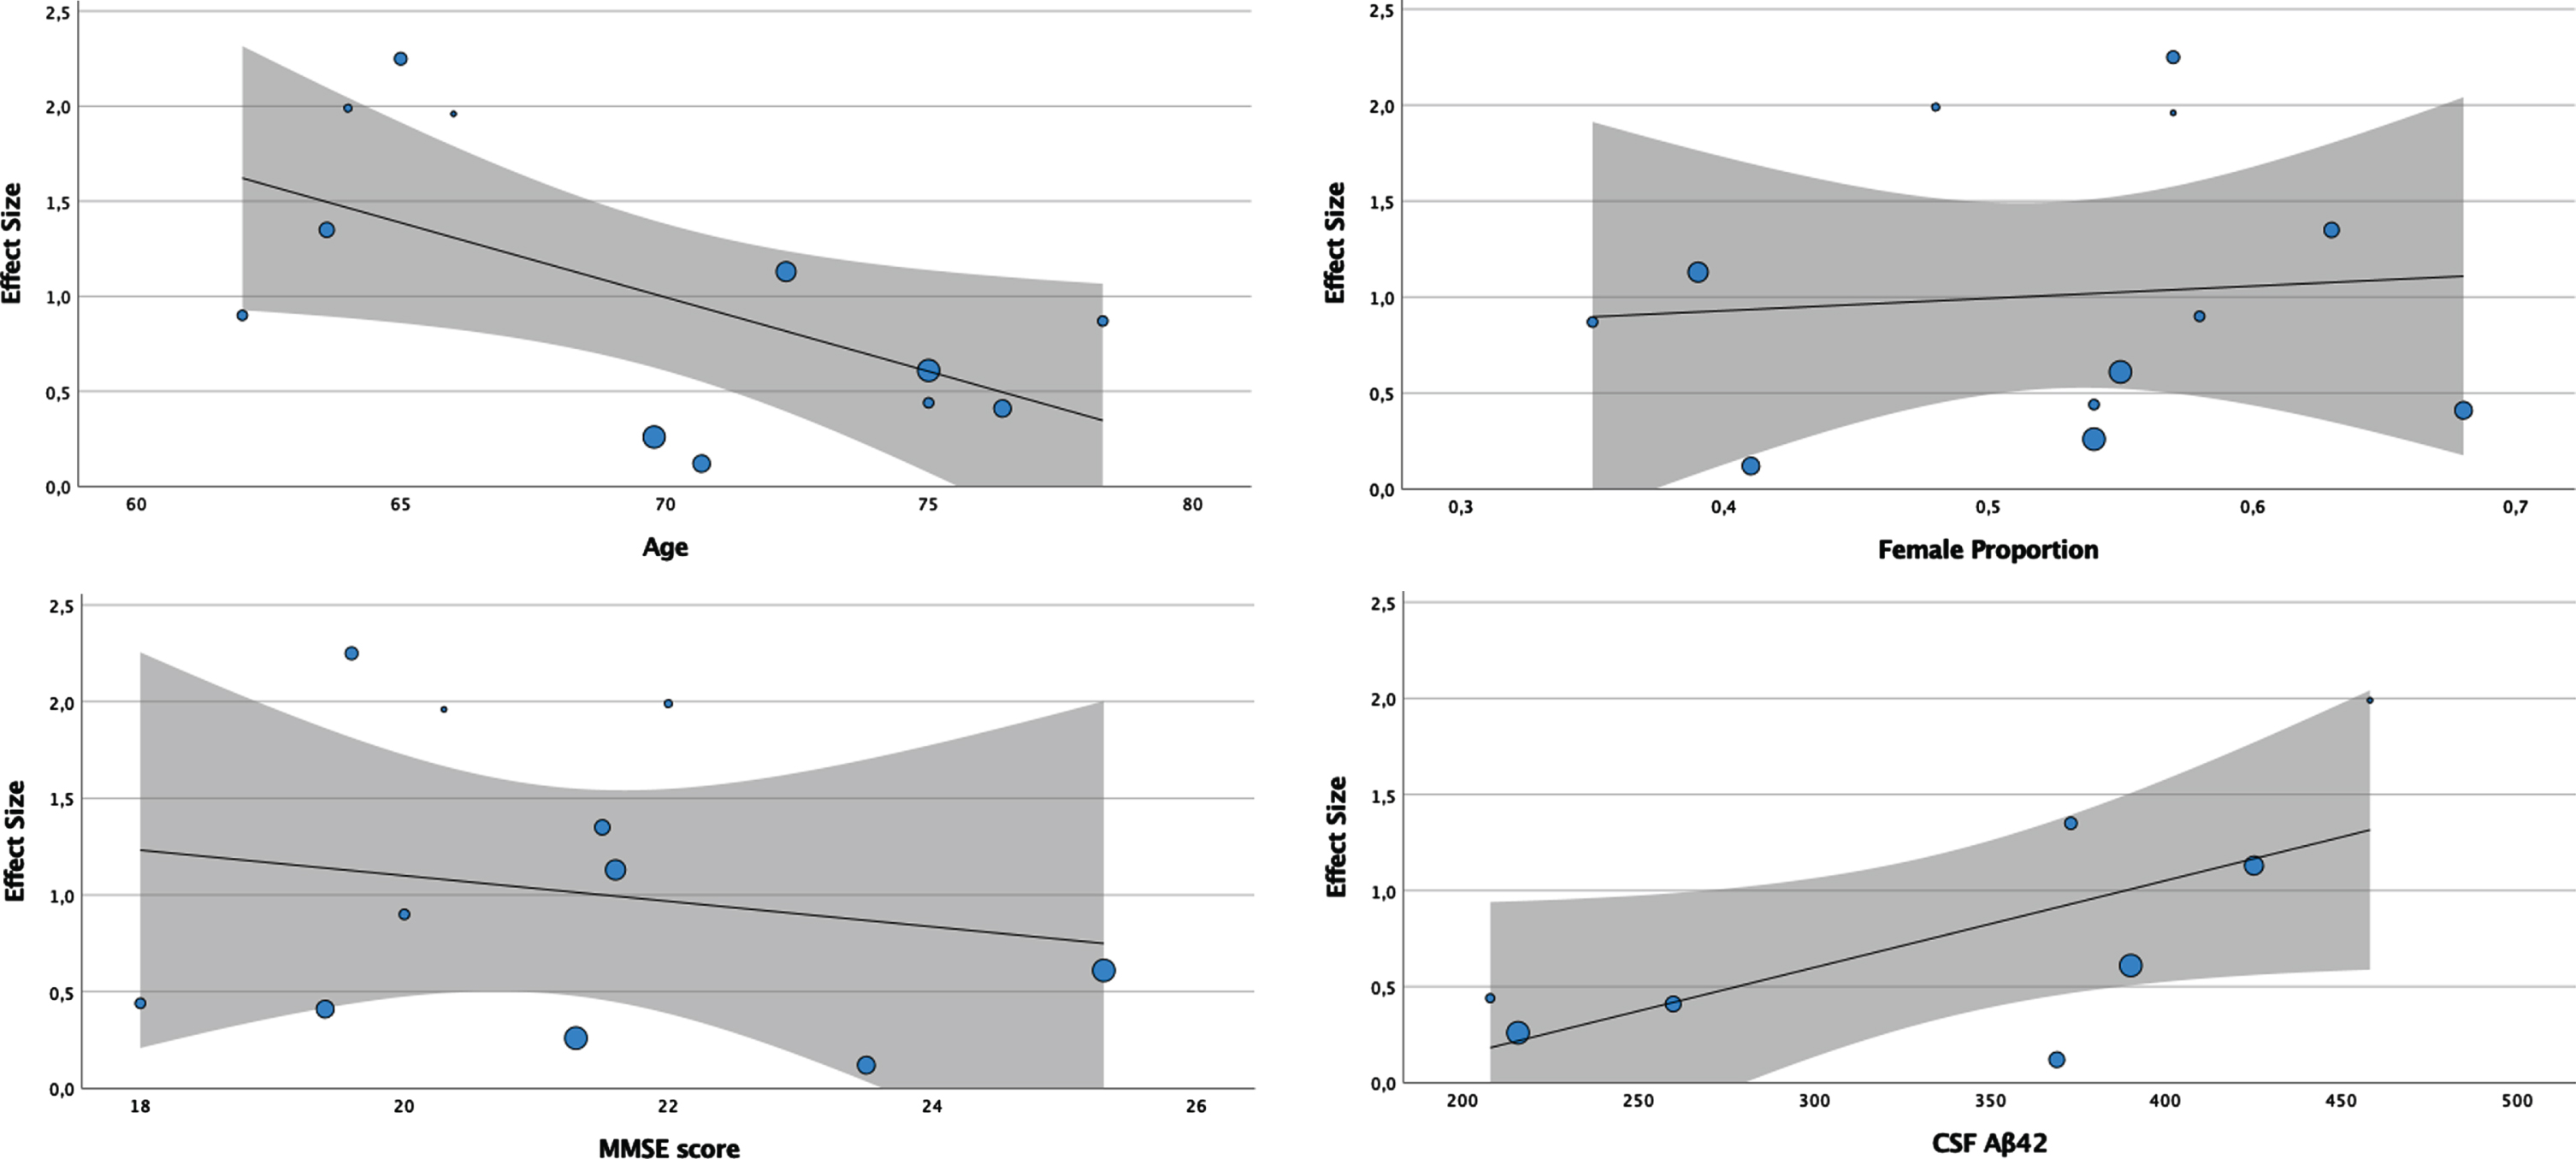
Meta-regression analyses of available covariates (age, sex, MMSE, Aβ42). The size of the bubbles is proportional to the weight of the individual study. The line represents the meta-regression prediction line, and the area around it the 95% confidence interval.
Age and sex were found to be statistically significant moderators of effect size at the meta-regression analysis. Specifically, there was an increase in effect size as the age of patients decreased (p < 0.001) and as the proportion of females increased (p < 0.001).
Meta-regression analysis was also performed by identifying other clinical covariates as possible moderating factors. Both Mini-Mental State Examination (MMSE) score (p < 0.001) and CSF levels of Aβ42 (p < 0.001) moderate the effect size. In both cases, effect size increases as MMSE and Aβ42 values decrease. In contrast, no moderating effect was identified for P-tau (p = 0.327). Results of the analyses are shown in Fig. 4.

SNAP-25 in CSF: Forest plot of included studies. The last 2 columns on the right indicate the CSF mean values of SNAP-25 in AD patients and controls of each study, expressed in pg/ml.
A high heterogeneity among included studies was observed (I2 = 0.92, p < 0.001).
Graphical analysis of the funnel plot provides evidence for publication bias, with an asymmetry in the funnel plot ( Supplementary Figure 1). Furthermore, the publication bias was evidenced by a significant Egger’s test (p < 0.001).
Only two studies [13, 28] that investigated blood levels of neurogranin met the inclusion criteria of this study, thus making a pooled analysis not possible.
SNAP-25
Studies that explored SNAP-25 levels as a fluid biomarker in AD patients versus CU subjects were found to be lower in number, and their characteristics are summarized in Table 2. The CSF was the prevalent sample used for biomarker assays, while only one study has focused on plasma. All studies included in the meta-analysis used ELISA to assay SNAP-25 in CSF. Four independent patient cohorts were included in the meta-analysis, with a total of 164 AD patients and 247 CU subjects.
Description of included studies (SNAP-25)
SNAP-25, Synaptosome-associated protein 25; NDE, neuronal derived exosomes; MMSE, Mini-Mental State Examination; CSF, cerebrospinal fluid.
A significant increase in SNAP-25 levels in CSF of patients with AD compared to CU individuals (z = 4.45; p < 0.001), with an effect size of 0.84 (95% CI 0.47 – 1.22; Fig. 4). A moderate to high heterogeneity was observed (I2 = 0.65; p < 0.01). In addition, graphical analysis of the funnel plot highlighted concern about publication bias, with an asymmetry in the funnel plot (Supplementary Figure 2) and it was statistically significant in the Egger’s test (p = 0.013).
Only two studies [32, 38] investigating SNAP-25 on blood have emerged, not allowing a meta-analysis to be performed.
Synaptotagmin-1
Synaptotagmin-1 levels appear to be increased in the CSF of AD patients.
Although the literature search yielded some studies investigating this protein at the CSF level in patients with AD or other dementias [17, 44], only one of them [32] met the inclusion and exclusion criteria of our study. In that study, synaptotagmin-1 levels in neuron-derived exosomes were found to be increased compared with healthy controls.
Emerging biomarkers for synapse pathology
Other possible biomarkers of synaptic pathology have emerged, and the main characteristics of the individual studies are shown in Table 3.
Description of included studies
GAP-43, Growth associated protein 43; Nlgn1, Neuroligin1; NPTX1, neuronal pentraxin 1; NRXNs, (Neurexin 1,2,3); NFASC, Neurofascin; NCANP, neurocan core protein; NDEs, neuronal derived exosomes; MMSE, Mini-Mental State Examination; CSF, cerebrospinal fluid.
Among them, it can be noted that 3 studies involved presynaptic growth associated protein-43 (GAP-43), making it possible to include 4 independent cohorts in order to conduct a meta-analysis. Four independent patient cohorts were included in the meta-analysis, with a total of 503 AD patients and 390 CU subjects. A significant increase in GAP-43 levels in CSF of patients with AD compared to CU individuals (z = 3.34; p < 0.001), with an effect size of 1.21 (95% CI 0.49 – 1.19; Fig. 5). A high heterogeneity was observed (I2 = 0.94; p < 0.001). Graphical analysis of the funnel plot highlighted an asymmetry in the funnel plot ( Supplementary Figure 3), which resulted statistically significant in the Egger’s test (p = 0.001).
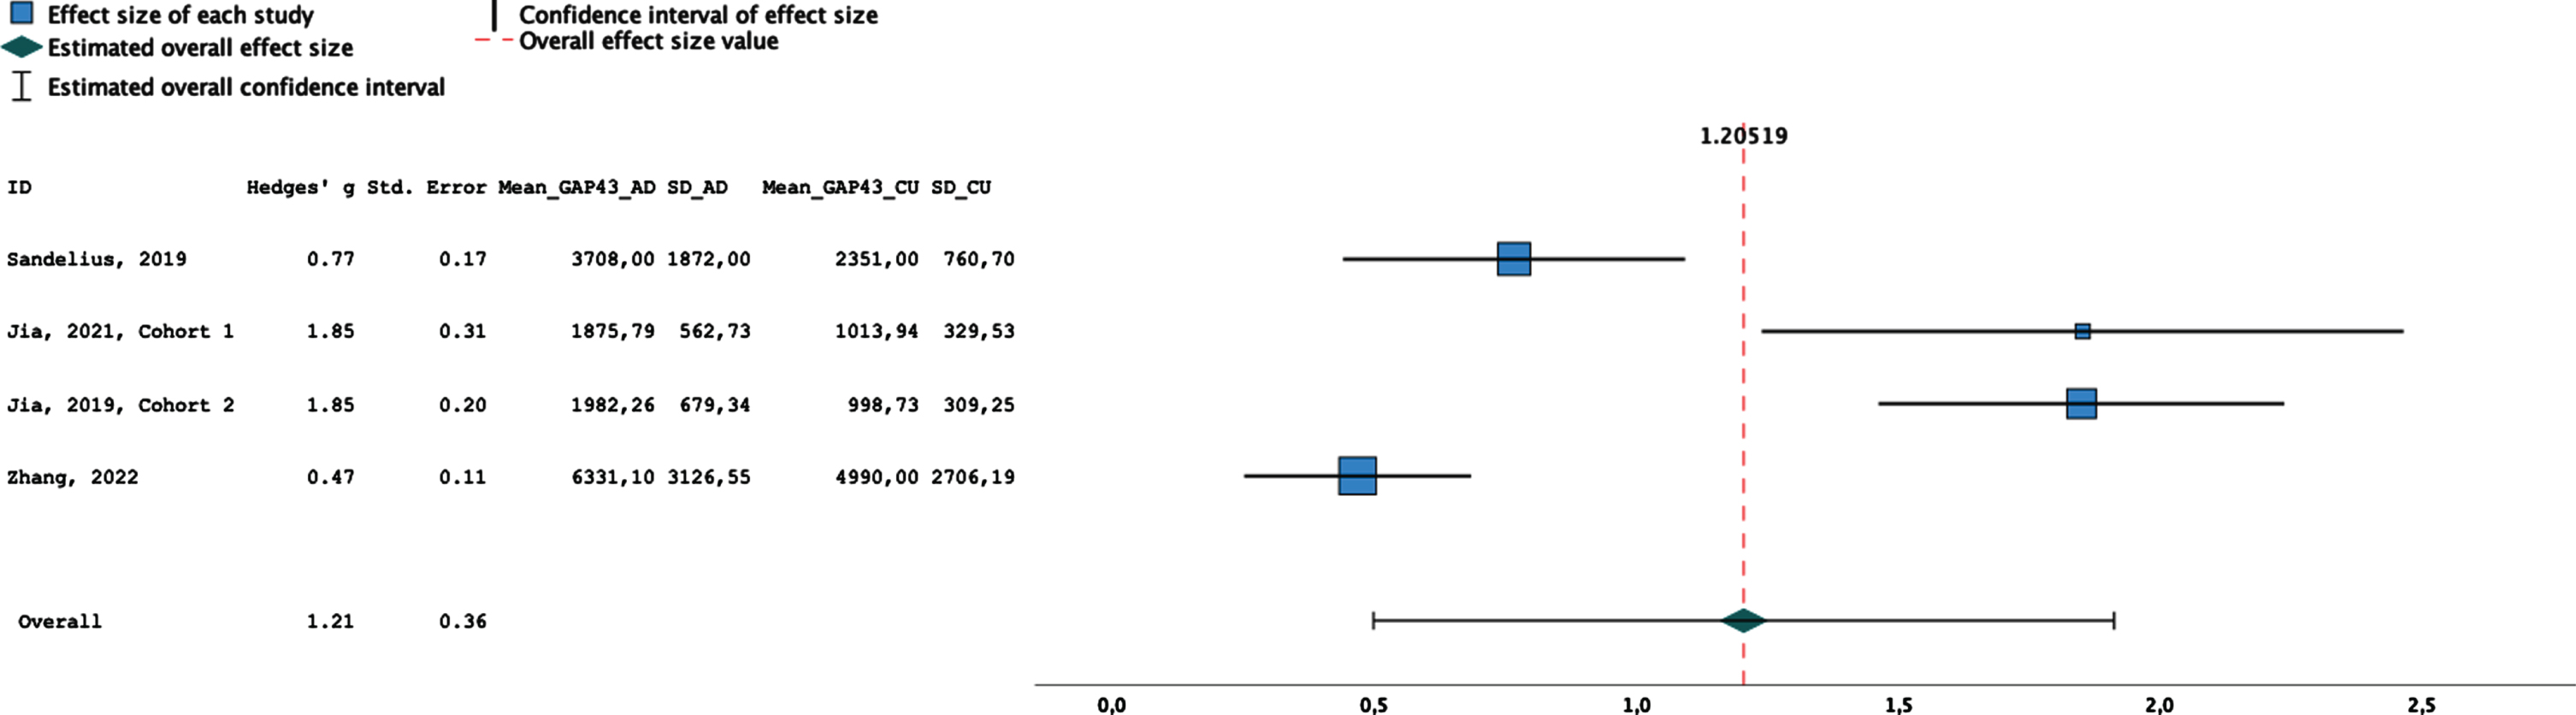
GAP-43 in CSF: Forest plot of included studies. The last 2 columns on the right indicate the CSF mean values of GAP-43 in AD patients and controls of each study, expressed in pg/ml.
DISCUSSION
In this study, a comprehensive systematic literature review and meta-analysis of key synaptic proteins as possible candidate biomarkers of AD was conducted.
Neurogranin is the most investigated synaptic biomarker. This study confirms significant increased concentrations of neurogranin in the CSF of patients with AD compared with healthy controls.
At the meta-regression analysis, significant effect size moderators were found.
The observation that patient age represents a significant moderator of effect size could be partly explained by a lower probability of co-pathology in the brains of patients with lower age groups. This could suggest that neurogranin may be specific for AD. Conversely, the moderating effect of CSF Aβ42 was in the opposite direction than expected in patients with AD, indicating the lack of a specific relationship between the values of Aβ42 and neurogranin. Also of note is the absence of significance at the meta-regression analysis for P-tau. These results raise the question of whether neurogranin may represent a specific biomarker of AD. Some studies have shown an increase of this biomarker selectively in AD patients compared to other dementias [14, 42] but a recent study on an autopsy-confirmed cohort seems to contradict these findings [45], suggesting that CSF neurogranin is not suitable as differential diagnosis biomarker for AD.
Our results are in line with previous meta-analyses regarding CSF neurogranin as a biomarker in AD [46–49], in particular regarding the demonstration of its increase in the CSF of AD patients compared with controls. However, their conclusions differ partially from ours. Indeed, one study [46] pointed to CSF neurogranin as a possible state biomarker in AD, while another [47] concluded that neurogranin can differentiate AD from other neurodegenerative diseases. This discrepancy probably reflects the different search method and inclusion/exclusion criteria used. Interestingly, a meta-analysis [48] regarding longitudinal studies in patients with mild cognitive impairment hypothesized that neurogranin may be useful in predicting cognitive decline in the AD continuum. Finally, a meta-analysis with similar results [49] indicates a possible role of CSF neurogranin in monitoring the progression of cognitive impairment in AD.
The tendency for the effect size to increase as the MMSE values decrease is in line with previous reports [50] and confirm the correlation of neurogranin with cognition levels and other biomarker of neurodegeneration. Finally, the moderating effect of sex on effect size emphasizes the importance of accounting for possible gender differences in AD.
A high heterogeneity and presence of possible publication bias was found in this meta-analysis. This could be partially explained by different pre-analytical and analytical methods among studies, suggesting that there is still relatively little homogeneity in studies aimed at investigating new biomarkers. Indeed, the high variability of neurogranin concentration levels obtained from the different studies should be emphasized, imposing caution in interpreting the results emerging from our analysis. Another limitation is represented by the risk of publication bias that may have partially affected our findings.
Taken together, these results indicate that CSF neurogranin is increased in patients with AD compared with controls and may be used as a biomarker of synaptic damage but without added value in the differential diagnosis between AD and other dementias.
From the systematic review, we then identified SNAP-25 protein as a possible synaptic biomarker of AD. For the first time, a meta-analysis was performed, reporting a significant increase in SNAP-25 levels in CSF of patients with AD compared to healthy individuals. Again, we noted a wide variability in the results of individual studies and moderate heterogeneity. The role of SNAP-25 in the differential diagnosis of AD remains to be clarified and needs further study.
Only one study [32] examining Synaptotagmin-1 met the selection criteria of our systematic review and showed a significant increase in AD patients compared with controls.
Finally, other proteins are emerging as possible biomarkers of synaptic damage, indicating great interest in identifying novel biomarkers that may provide an advantage in terms of diagnostic precision, or possible new therapeutic targets, of AD [51].
Through systematic review we identified three studies regarding the measurement of GAP-43 protein in patients with AD and healthy controls. We described for the first time in this meta-analysis a significant increase of GAP-43 protein in CSF of patients with AD. Although no definite conclusions can be drawn, these data are promising, in particular considering that GAP-43 protein was found to be selectively increased in AD patients in a study in which several neurodegenerative diseases were included [42].
Possible limitations of this study can be identified in the incomplete extraction of data from some individual studies, which precluded their inclusion in the meta-analysis. In addition, it was decided not to analyze, because of the heterogeneity of the diagnostic criteria used, the levels of synaptic biomarkers in patients with mild cognitive impairment. This could have clarified the role of these proteins in the early stages of AD, and some studies seem to indicate an increase in synaptic biomarkers already in the preclinical stages of the disease [50].
Conclusion
Neurogranin, SNAP-25, and GAP-43 are possible biomarkers of synaptic damage in AD. This meta-analysis emphasizes the importance of biomarkers of synaptic damage and demonstrates that they are altered in patients with AD compared to cognitively normal controls. However, this meta-analysis highlights that there are still relatively few studies investigating these biomarkers in patients with AD or other dementias and reveals wide heterogeneity in literature. To date, it is too early to define what the precise role of these biomarkers might be, and further studies are needed. Whether these biomarkers can provide information on the likelihood of conversion to dementia in patients with mild cognitive impairment, or whether their value may be related to monitoring disease progression, is not yet fully clarified.