
Abstract
Background:
Alzheimer’s disease (AD) brings heavy burden to society and family. There is an urgent need to find effective methods for disease diagnosis and treatment. The robust rank aggregation (RRA) approach that could aggregate the resulting gene lists has been widely utilized in genomic data analysis.
Objective:
To identify hub genes using RRA approach in AD.
Methods:
Seven microarray datasets in frontal cortex from GEO database were used to identify differential expressed genes (DEGs) in AD patients using RRA approach. STRING was performed to explore the protein-to-protein interaction (PPI). Gene Ontology enrichment and Kyoto Encyclopedia of Genes and Genomes pathway analyses were utilized for enrichment analysis. Human Gene Connectome and Gene Set Enrichment Analysis were used for functional annotation. Finally, the expression levels of hub genes were validated in the cortex of 5xFAD mice by quantitative real-time polymerase chain reaction.
Results:
After RRA analysis, 473 DEGs (216 upregulated and 257 downregulated) were identified in AD samples. PPI showed that DEGs had a total of 416 nodes and 2750 edges. These genes were divided into 17 clusters, each of which contains at least three genes. After functional annotation and enrichment analysis, TAC1 is identified as the hub gene and may be related to synaptic function and inflammation. In addition, Tac1 was found downregulated in cortices of 5xFAD mice.
Conclusion:
In the current study, TAC1 is identified as a key gene in the frontal cortex of AD, providing insight into the possible pathogenesis and potential therapeutic targets for this disease.
INTRODUCTION
Alzheimer’s disease (AD) is a neurodegenerative disease characterized by progressive cognitive impairment and behavioral impairment, which is the most prevalent type of dementia [1]. With the development of population aging, AD patients are increasing year by year, seriously threatening the health and life safety of the elderly, and at the same time causing a heavy economic burden to the family and society [1–3]. Therefore, there is an urgent need for early diagnosis and treatment of AD [1].
The typical pathological features of AD are extracellular amyloid plaques caused by amyloid-β (Aβ) aggregation and abnormal neurofibrillary tangles caused by intracellular tau protein aggregation. The popular pathological mechanisms include amyloid cascade hypothesis, tau hypothesis, cholinergic neuron damage, inflammation, synaptic dysfunction, oxidative stress, and so on [4–6]. However, the precise pathogenesis of AD remains unclear, which may pose obstacles to the diagnosis and treatment of the disease. In recent years, to solve this problem, lots of research have been conducted to identify key genes of AD using open-source software and public databases.
Differentially expressed genes (DEGs) have been identified by high-throughput technologies in mRNA expression levels of brain tissues between cognitively normal and AD individuals [7–10]. Dozens or hundreds of DEGs could be found by these studies, which may be related to the disease. However, only a small proportion of them will be clinically translated for disease diagnosis and prognosis. Combining different data sources can be difficult because batch effects and small sample sizes can affect the comparability of gene expression levels in different datasets. Hence, the results should be integrated in an unbiased manner. The robust rank aggregation (RRA) approach has been proposed recently [11]. Briefly, it is used to aggregate the resulting gene lists after analyzing different datasets separately. This approach has been widely utilized to identify key genes in cancer and neurodegenerative diseases [12–15].
In the present study, we aimed to find the hub genes in the frontal cortex of AD using RRA approach [11]. We analyzed several microarray datasets from GEO database, performed enrichment analysis and functional annotation of DEGs. Finally, TAC1 is identified as a key gene in AD and is also found downregulated in AD mouse model, suggesting the possible potential of this gene in disease diagnosis and treatment.
MATERIALS AND METHODS
Data collection
The microarray datasets used in the present study were downloaded from the GEO database (https://www.ncbi.nlm.nih.gov/geo/). We searched the GEO database for microarray datasets using the keyword “Alzheimer” and the included criteria were described in our previous study [16]. Briefly, they were datasets from human frontal cortex of both AD and cognitively normal (CN) samples, with the number of rows in each platform was > 30,000 and the number of samples was > 20. Finally, seven datasets were selected, and the detailed information were shown in Table 1 [17–30].
Characteristics of the included datasets
AD, Alzheimer’s disease; CN, cognitively normal; GSE, Gene Expression Omnibus Series; GPL, Gene Expression Omnibus Platform.
Identification of differentially expressed genes and RRA analysis
The selected datasets were analyzed using Perl (version 5.18.4) and the R package “limma” [31]. Then, the RRA analysis was performed via the R package “RobustRankAggreg” [11] to integrate the DEGs of those datasets to find the most significant DEGs. The RRA method can identify genes with statistical relevance and rank them in an unbiased way [11]. Genes with adjusted p < 0.05 were considered as robust DEGs in the RRA analysis. The heatmap was made by GraphPad Prism (version 8.4.0, https://www.graphpad.com). The R package “OmicCircos” was used to exhibit the chromosomal locations and expression patterns of significant DEGs from the RRA analysis [32].
Functional enrichment analyses
For significant DEGs from RRA analysis, Gene Ontology (GO) enrichment and Kyoto Encyclopedia of Genes and Genomes (KEGG) pathway analyses were conducted with the R package “clusterProfiler” [33]. The terms of GO and KEGG pathways with adjusted p < 0.05 were considered as significant and exhibited as bubble plots by the R package “GOplot” [34].
Protein-to-protein interaction
The online STRING database (Version 11.0, https://string-db.org) was performed to explore the protein-to-protein interaction (PPI). The interaction file was then put into Cytoscape and genes with degree≥20 were considered as candidate genes. The significant DEGs were then divided into several modules using MCODE of Cytoscape (Version 3.7.1, https://cytoscape.org). For genes in different modules, the online functional annotation database named DAVID (version 6.8, https://david.ncifcrf.gov) were used to perform GO and KEGG analyses.
Validation of candidate genes in datasets
Expression data of candidate genes extracted from the seven datasets were used to validate their differential expression in frontal cortex. We utilized GraphPad Prism (version 8.4.0) to perform the unpaired t test between CN and AD groups, and to generate violin plots and bar plots for visualization.
Mice and quantitative real-time polymerase chain reaction
The animal study protocol was reviewed and approved by the Ethics Committee of Shandong Provincial Hospital, Cheeloo College of Medicine, Shandong University. 5xFAD and wild-type (WT, non-transgenic littermates) mice with mixed genders were used for the validation of the expression levels of robust DEGs in the current study. As described in our previous study [16], total RNA was extracted from cortices of 8-month-old 5xFAD and WT mice and quantitative real-time polymerase chain reaction (qRT-PCR) was done on LightCycler® 480 Real-Time PCR System. The internal control was β-Actin and 2 - ΔΔCT method was used for the calculation of relative expression. The primer sequences were shown in Supplementary Table 1.
Human Gene Connectome and GSEA
Human Gene Connectome (HGC) server was used to find the relationship between AD-related genes and hub genes [35, 36]. AD-related genes were defined as genes related to AD in the Human Gene Mutation Database (http://www.hgmd.cf.ac.uk/ac/index.php), the Human Phenotype Ontology (https://hpo.jax.org/app/) and Online Mendelian Inheritance in Man (https://www.omim.org) (Supplementary Table 2). For the functional enrichment of AD-related genes and hub genes, DAVID (version 6.8, https://david.ncifcrf.gov) were used to perform GO and KEGG analyses. GSEA (version 4.0.3) was performed to explore the potential biological functions of the key genes [37]. Samples in GSE122063 were divided into two groups according to the expression level of the hub genes, respectively [16]. The database “c5.go.bp.v7.2.symbols.gmt” was chosen for enrichment analysis. Terms with p value < 0.05 and FDR < 0.25 were defined as significant.
Statistical analysis
The normality test and homogeneity of variance test were performed on data extracted from GEO datasets and qRT-PCR data. Data that passed these two tests then underwent t-testing for comparisons. Data that passed the normality test, but did not pass the homogeneity of variance test, underwent t-testing with Welch correction. GraphPad Prism (version 8.4.0) was utilized to perform the abovetests.
RESULTS
Screening of DEGs by RRA
Figure 1 shows the overall workflow of this study. After RRA analysis, 473 DEGs (216 upregulated and 257 downregulated) were identified in AD samples. The polarity of genes described as “upregulated” or “downregulated” in this article is with respect to AD vs. CN. The expression of the top 40 DEGs (top 20 upregulated and top 20 downregulated) were showed in heatmap (Supplementary Figure 1). The top 200 DEGs (top 100 upregulated and top 100 downregulated) were chosen to visualize their expression patterns and chromosomal locations across the seven datasets, as well as their logarithmic adjusted p values and interactions among these genes from STRING (Fig. 2).
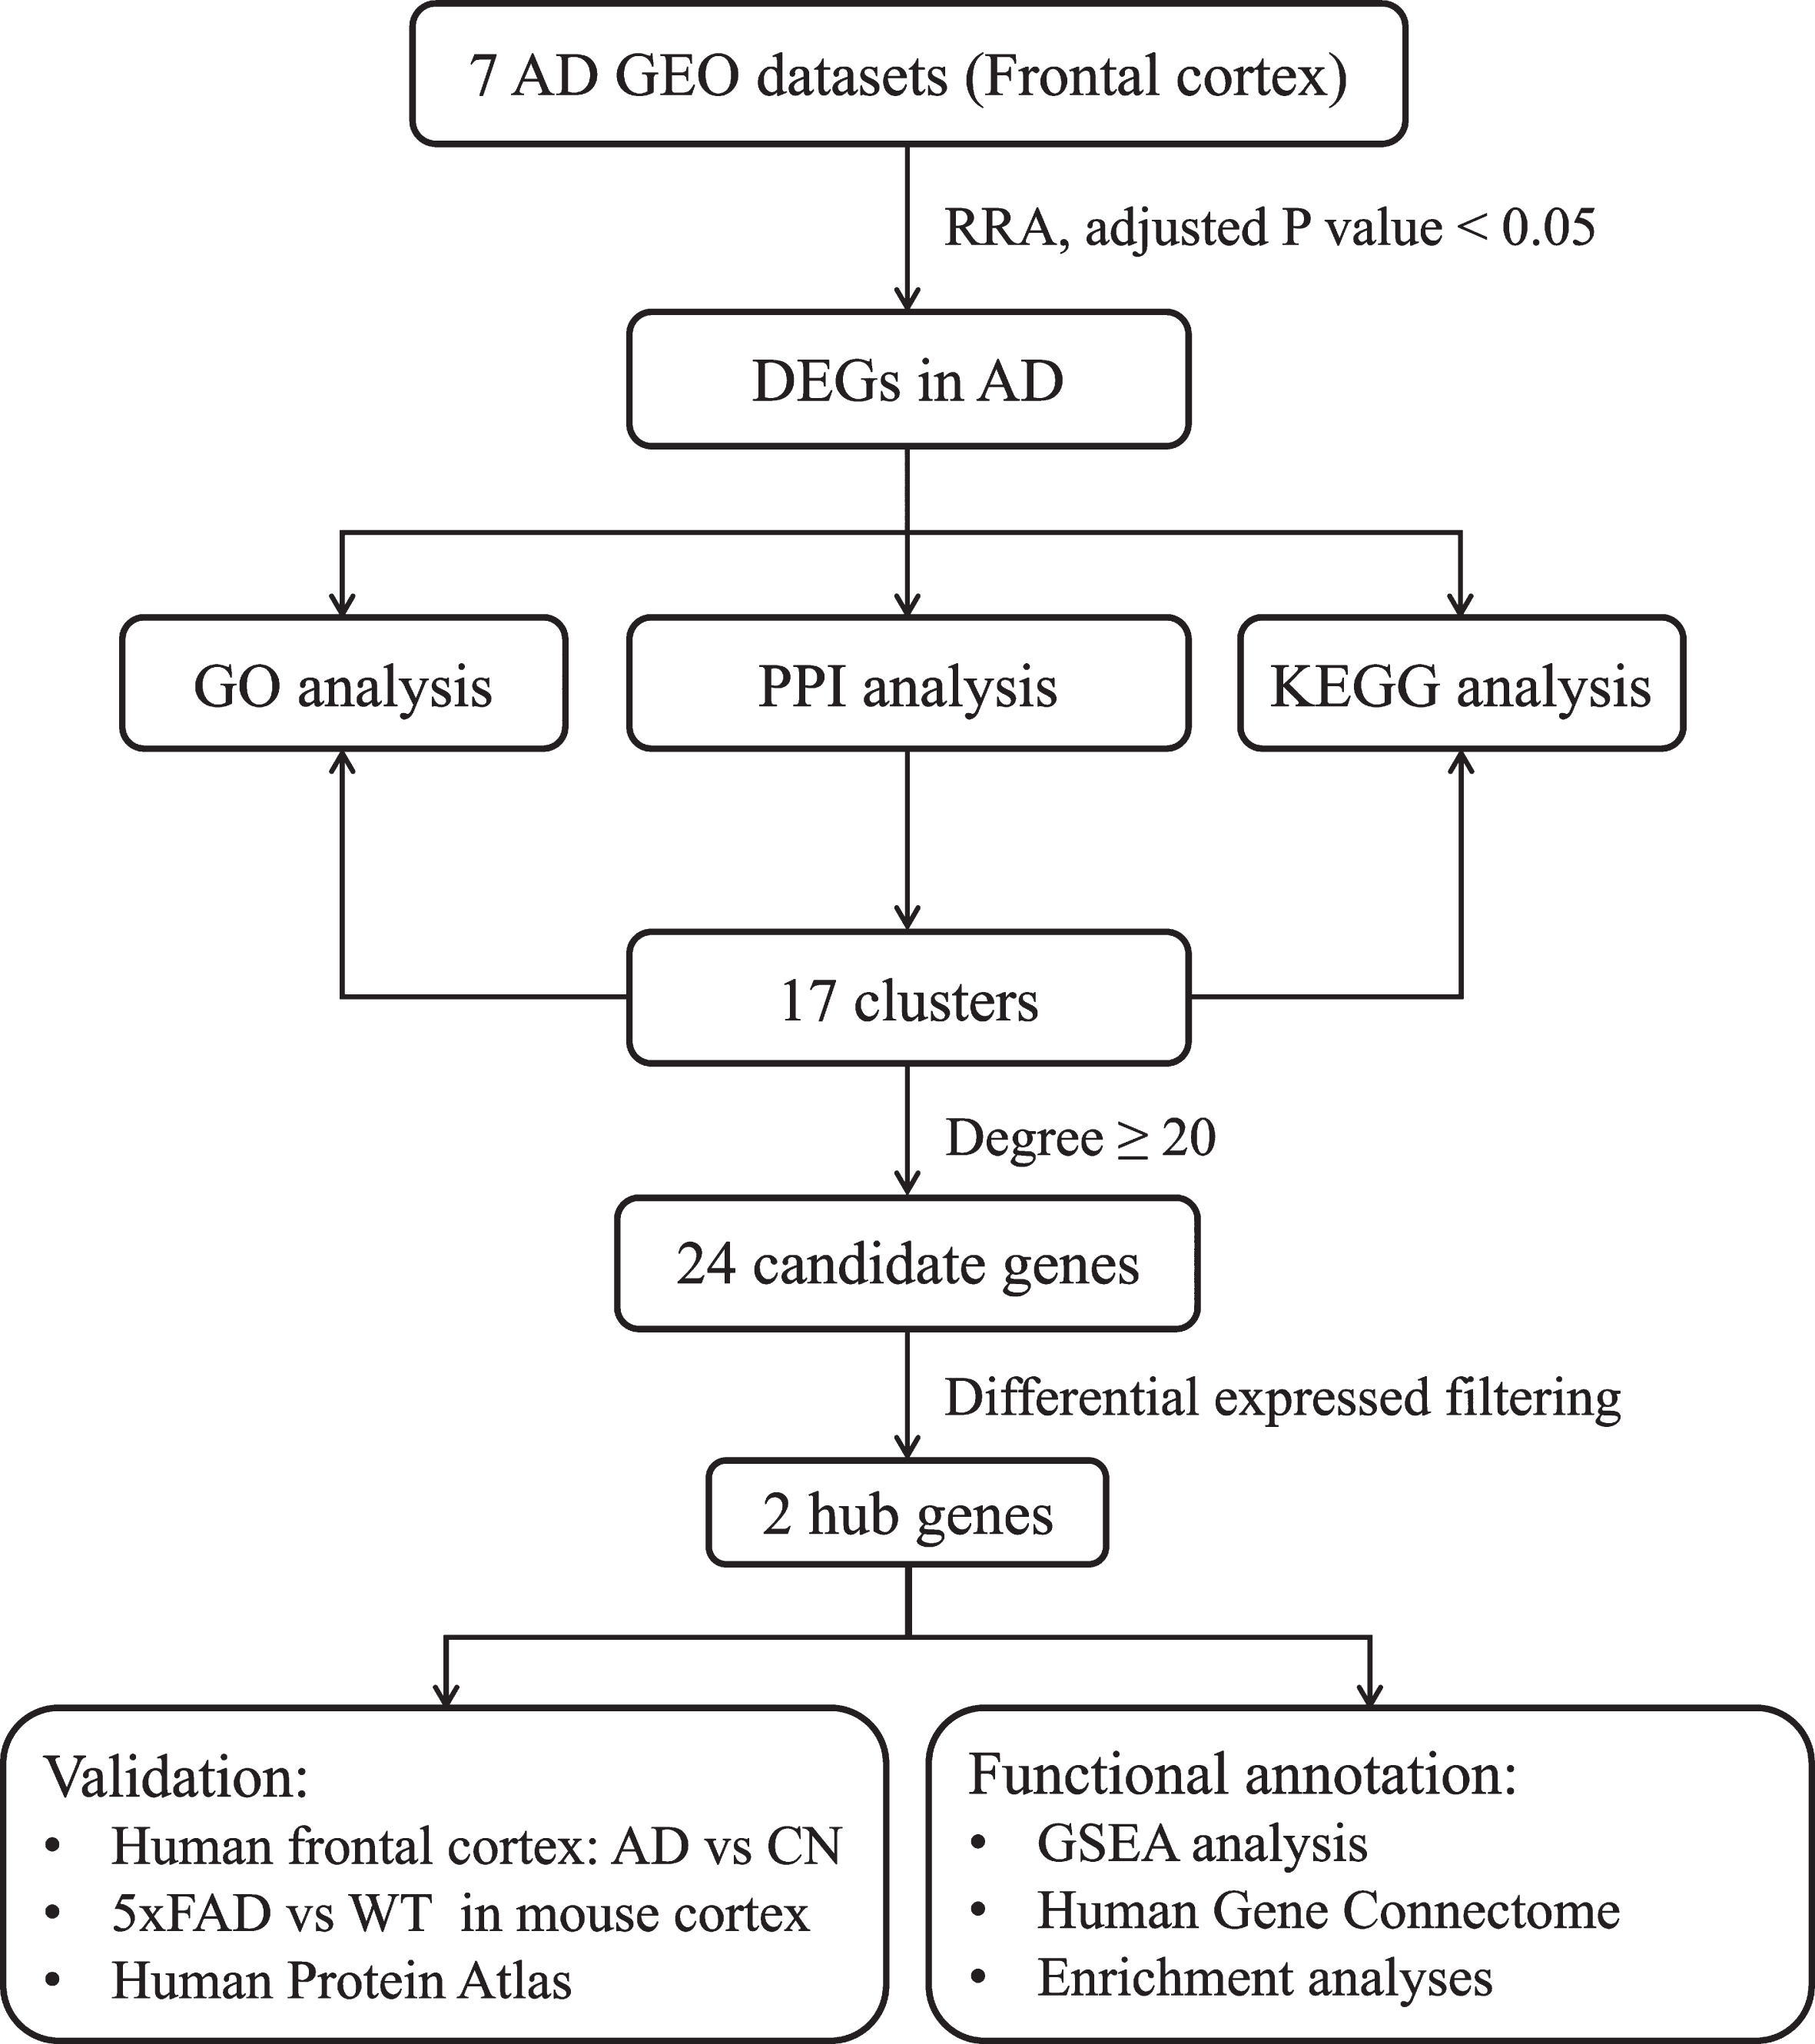
Study workflow. AD, Alzheimer’s disease; DEG, differentially expressed genes; GEO, Gene Expression Omnibus; GO, Gene Ontology; GSEA, Gene Set Enrichment Analysis; KEGG, Kyoto Encyclopedia of Genes and Genomes; PPI, Protein– Protein Interaction; RRA, Robust Rank Aggregation; WT, wild type.
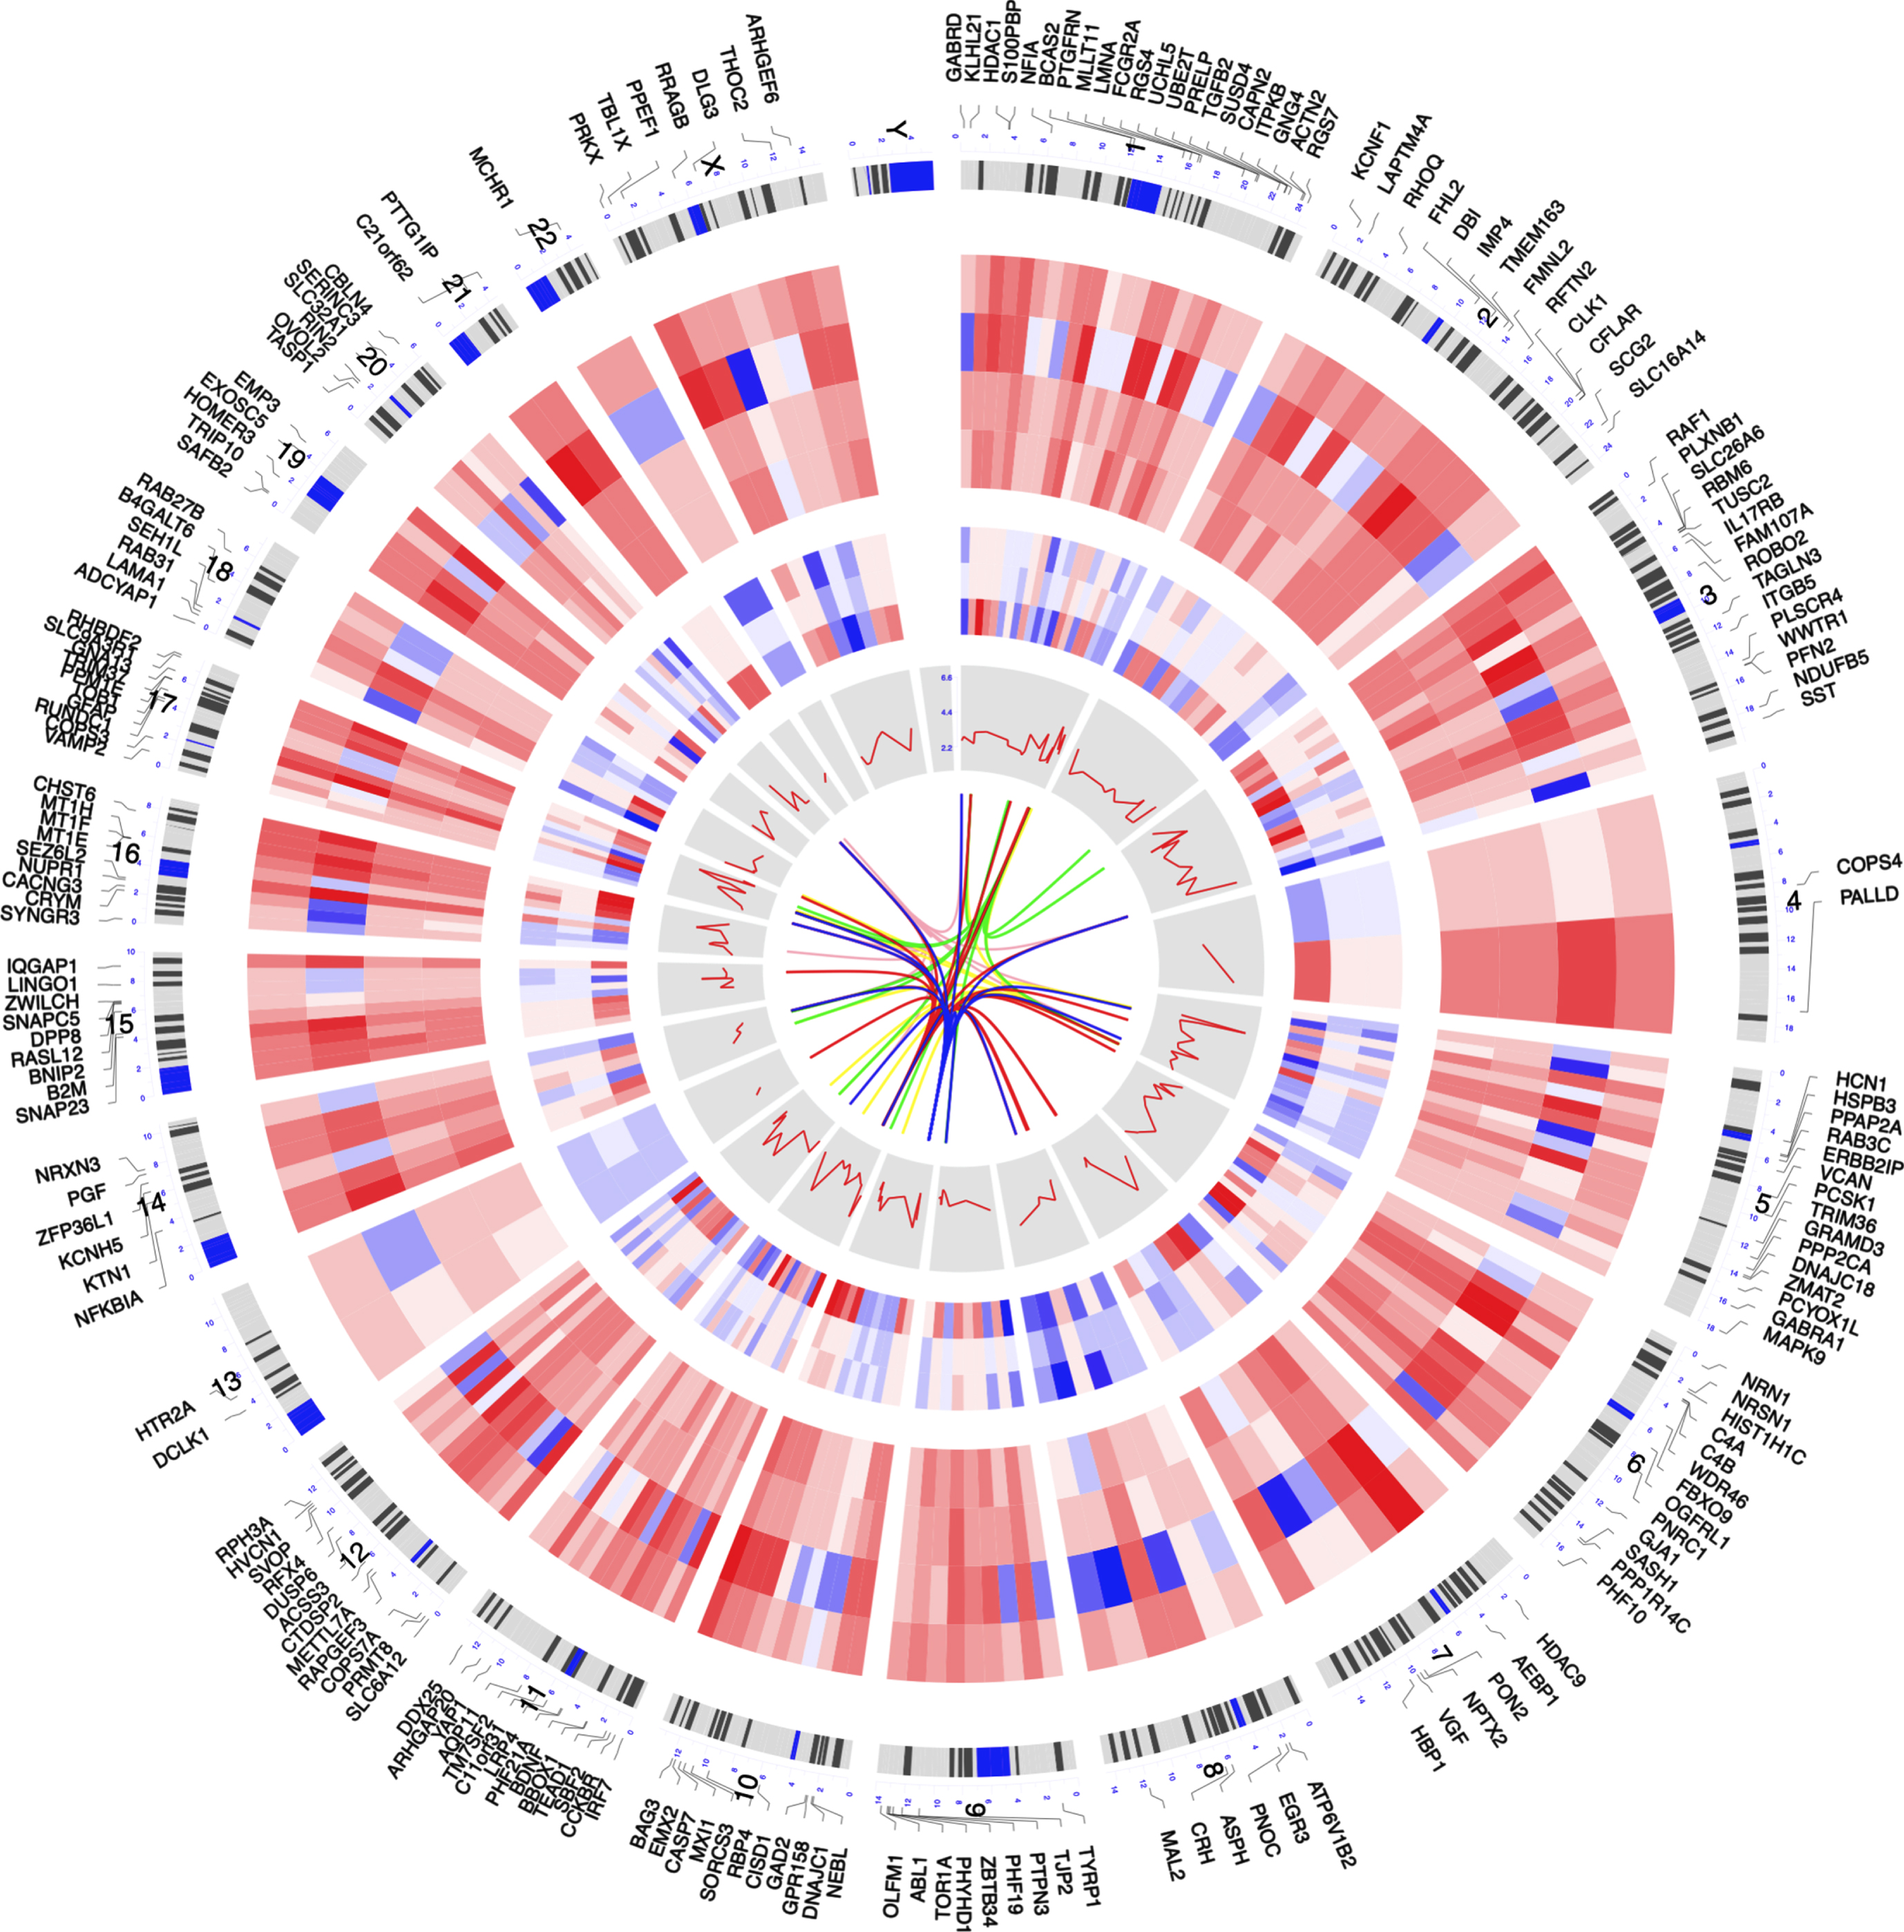
Circos plot of expression patterns and chromosomal positions of top 200 differential expressed genes (DEGs). The outer circle represents chromosomes; lines coming from each gene point to their specific chromosomal locations. The expression of top 100 upregulated and top 100 downregulated DEGs are represented in the inner circular heatmaps. The red lines in the inner layer indicates – log10 (adjust p value in RRA analysis) of each genes. The innermost layer shows the interaction between the DEGs in STRING (version 11.0, https://string-db.org).
Functional enrichment analysis of DEGs
All significant DEGs from RRA analysis were used to perform GO and KEGG analysis, and top 15 of these terms according to adjusted p values were shown (Fig. 3). We found enrichment in several biological process of GO terms. The significant DEGs were enriched in urogenital system development, cellular response to zinc ion and cellular response to glucocorticoid stimulus (Fig. 3A). As to the cellular component of GO, the top three terms were presynapse, neuronal cell body and exocytic vesicle (Fig. 3B), and the top three terms of molecular function in GO were ATPase-coupled cation transmembrane transporter activity, ATPase-coupled ion transmembrane transporter activity and benzodiazepine receptor activity (Fig. 3C). For KEGG pathway analysis, these DEGs were mostly enriched in GABAergic synapse, Mineral absorption and Retrograde endocannabinoid signaling pathways (Fig. 3D).

Gene Ontology (GO) and Kyoto Encyclopedia of Genes and Genomes (KEGG) analysis of all differential expressed genes. Bubble plots indicated enrichment analysis of genes. (A) Biological process of GO analysis. (B) Cellular component of GO analysis. (C) Molecular function of GO analysis. (D) KEGG pathways.
PPI and key module identification
PPI showed that the significant DEGs had a total of 416 nodes and 2,750 edges (Supplementary Figure 2). Using the MCODE of Cytoscape, these genes were divided into 17 clusters, each of which contains at least three genes (Fig. 4). According to GO and KEGG analyses, these clusters were enriched in different biological processes and pathways (Supplementary Table 3), such as GABAergic synapse, Mineral absorption, Spliceosome, etc. Under the threshold of degree≥20, there were 24 genes identified as candidate genes: BDNF, IGF1, GNG3, SLC32A1, GNB5, SYP, TAC1, SST, EIF4E, GAD2, GNG4, GRIN2A, ITPKB, ABL1, GABBR2, GABRD, GAD1, GFAP, MAPK9, GABRA1, HDAC1, CRH, SMAD4, VAMP2.

Clusters in protein-protein interaction analysis. Seventeen clusters were included.
Validation of the expression of candidate genes
Among those candidate genes, BDNF, CRH, GABRA1, GABRD, GFAP, ITPKB, SST, and TAC1 were differentially expressed in more than five of seven datasets (p < 0.05, 0.01, 0.001 or 0.0001; Fig. 5, Supplementary Figure 3). Then, we chose two genes, TAC1 and GABRA1, which were seldom reported in AD [38], as hub genes and for further validation in cortices of 5xFAD and WT mice. Results of qRT-PCR showed that Tac1 was down regulated in cortices of 5xFAD mice (p < 0.05; Fig. 6A), while the expression of Gabra1 in 5xFAD mice had no difference with that in WT mice (Supplementary Figure 4). We also found the high expression of TAC1 in caudate, putamen, nucleus accumbens, hypothalamus, and hippocampus, as well as in inhibitory neurons (Supplementary Figures 5 and 6) using the Human Protein Atlas Database (https://www.proteinatlas.org/).

Expression of TAC1 in datasets. AD, Alzheimer’s disease; CN, cognitively normal; ns, no significance; *p < 0.05; **p < 0.01; ***p < 0.001; ****p < 0.0001.
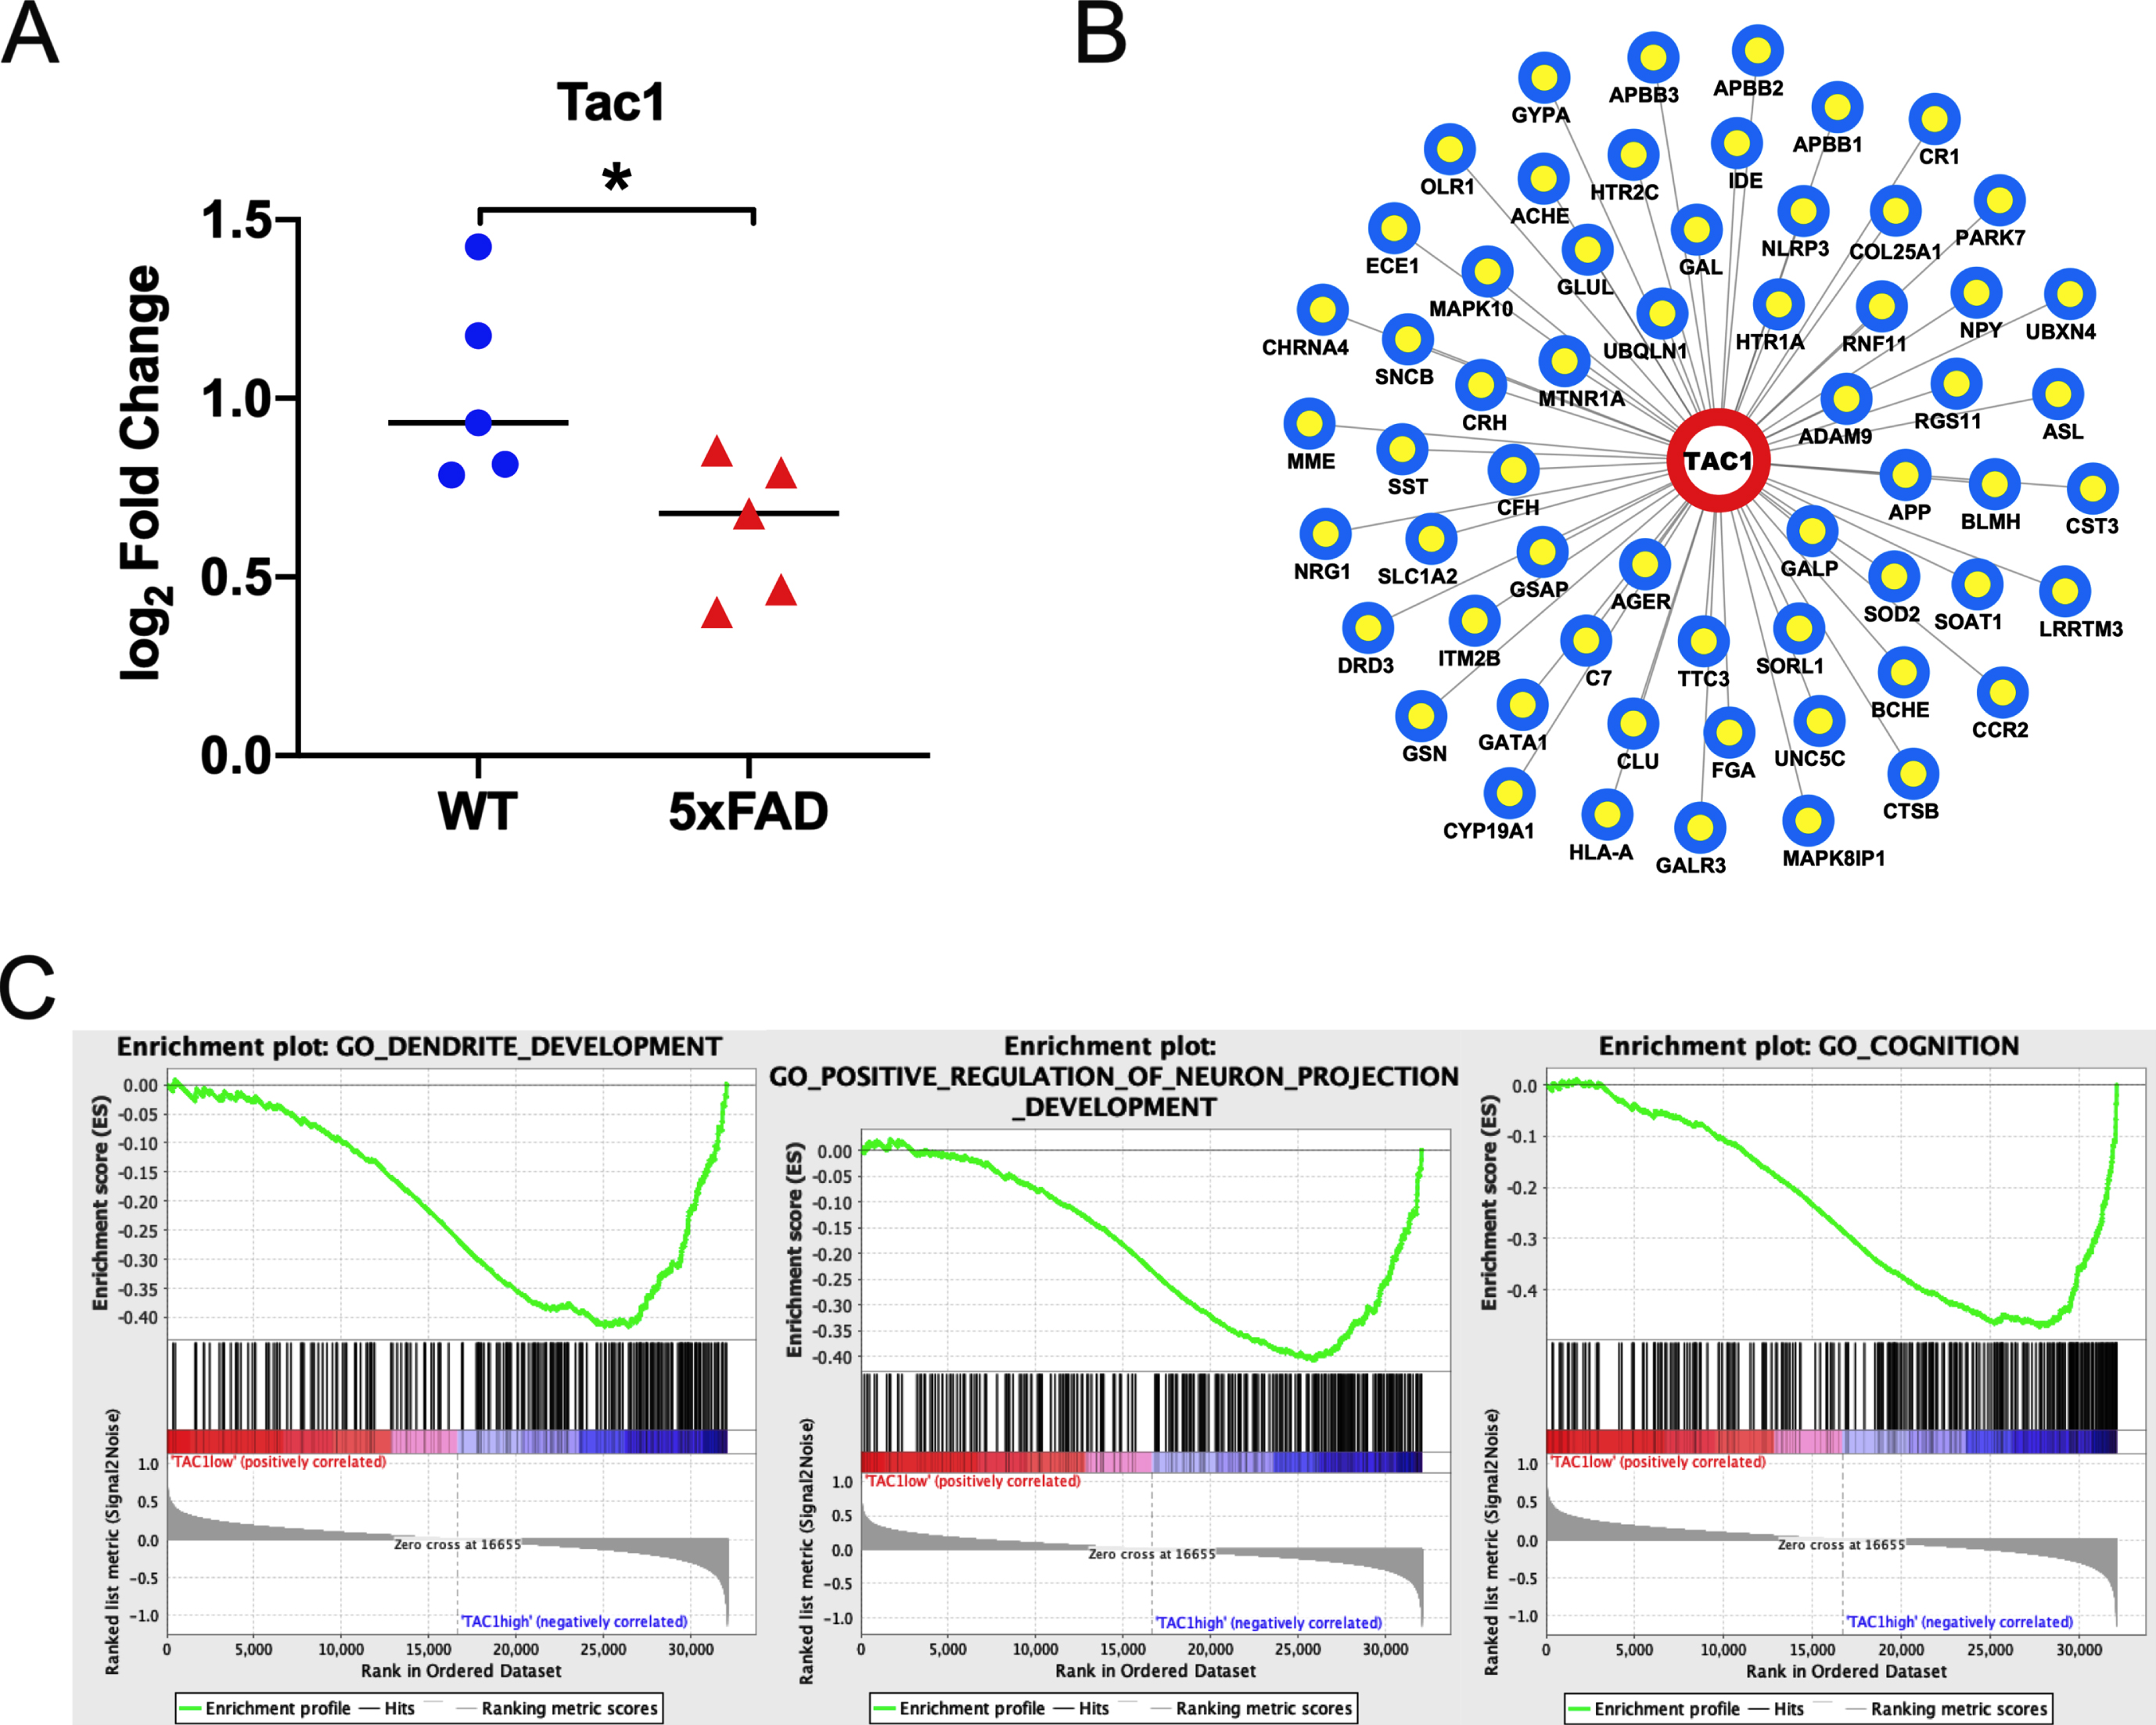
Expression of TAC1 in mice and functional annotation of TAC1. A) Expression of TAC1 in mice. WT, wild type; *p < 0.05; the black horizontal lines indicate median (t-testing; n = 5 in each group). B) Interactions between TAC1 and AD-related genes. C) Gene Set Enrichment Analysis of TAC1. Only listed the three functional gene sets mostly related to Alzheimer’s disease.
HGC and GSEA reveals the potential biological function of TAC1
HGC indicated that there were 59 AD-related genes interacted with TAC1 (Fig. 6B), such as A βPP, CLU, CRH and so on. According to the biological process of GO analysis, TAC1 and AD-related genes were enriched in chemical synaptic transmission, inflammatory response and innate immune response (Supplementary Table 4). GSEA showed that high expression of TAC1 was mostly involved in dendrite development, positive regulation of neuron projection development and cognition (Fig. 6C).
DISCUSSION
In the current study, we analyzed seven GEO datasets in frontal cortex from AD patients and CN individuals using RRA approach. Nearly 500 DEGs were identified and mostly were associated with synaptic functions. We found 17 clusters enriched in different biological pathways and identified 24 candidate genes. Finally, we revealed TAC1 may play roles in AD and was related to neuron development after validation of the expression and exploration of the function.
TAC1, short for tachykinin precursor 1, encodes preprotachykinin-1 and is enriched in central nervous system (CNS). It is reported that TAC1 was a hub gene in the frontal and temporal cortex of patients with vascular dementia [39, 40]. Consistent with our findings in the cortices of 5xFAD mice, TAC1 was found downregulated in the hippocampus of AD patients and AβPP/PS1 mice in recent studies [41, 42]. Other studies have reported that TAC1 was significantly downregulated in the whole brain of AD [42, 43], which was further confirmed in the current study. The previous bioinformatics analysis pointed out that there may be differential expression of TAC1 in AD human or mouse brain tissues. However, the current study integrated multiple datasets by the RRA method to detect the potential importance of TAC1 more accurately and focused on the feature exploration of TAC1. To sum up, the above findings suggested that TAC1 was differential expressed in neurodegenerative diseases, especially in AD, indicating the import roles of this gene in AD.
The post-translational products of TAC1 are neurokinin A and substance P [44]. Neurokinin A could be further modified to generate neurokinin K and neuropeptide gamma [45]. These products are widespread within the CNS and have been reported to fluctuate in association with stress and anxiety [46]. It is reported that substance P could modulate the excitability of nerve cells, and can also activate microglial neurokinin 1 receptor and enhance neuroinflammation, which plays a critical role in the initiation and progression of neurodegeneration diseases such as AD, Parkinson’s disease, and multiple sclerosis [47, 48]. In addition, substance P has been reported to remove the higher-order oligomers (i.e., hexamers and dodecamers) of Aβ25 - 35 and reduce the toxicity of Aβ25 - 35 [49]. Neurokinin B (NKB), encoded by TAC3 which is paralogous to TAC1, was able to inhibit formation of Aβ aggregates [50]. Moreover, NKB can bind to copper ions and may be involved in synaptic copper homeostasis [51]. The above reference mining indicated the possible mechanisms of TAC1 in the progression of AD.
However, the current study has several limitations. First, the expression of TAC1 was validated in 8-month-old 5xFAD mice. Further studies are warranted to explore the changes of its expression with age- and sex-effect as well as the spatial changes. Second, the underlying mechanisms of TAC1 should be discovered in the future as the present study identified TAC1 as a hub gene in AD. Third, although there was no significant difference in the expression of GABRA1 between AD and wild-type mice in this study, further verification is needed to clarify its expression and possible mechanism in the disease.
In summary, we identified TAC1 was a key gene in frontal cortex in AD, which was validated in AD mice model. Functional annotation and reference mining suggested that TAC1 and its products were mostly related to synaptic and inflammatory functions. However, further investigation is needed to elucidate the critical roles of TAC1 in AD.
Footnotes
ACKNOWLEDGMENTS
We thank the researchers of the public datasets for sharing the data used in this study and the participants that included in the public datasets.
FUNDING
The present study was supported in part by the National Key R&D Program of China (grant no.: 2017YFC1310100); the National Nature Science Foundation of China (grants no.: 82171175, 81861138008, and 82011530139); the Academic Promotion Program of Shandong First Medical University (2019QL020); the Taishan Scholar Program of Shandong Province, China; the Integrated Traditional Chinese and Western Medicine Program in Shandong Province (YXH2019ZXY008); Shandong Provincial Key Research and Development Program (2021LCZX03); the Brain Science and Brain-like Intelligence Technology Research Projects of China (2021ZD0201801 and 2021ZD0201808).
CONFLICT OF INTEREST
The authors have no conflict of interest to report.