
Abstract
Background:
The A/T/N framework allows for the assessment of pathology-specific markers of MRI-derived structural atrophy and hypometabolism on 18FDG-PET. However, how these measures relate to each other locally and distantly across pathology-defined A/T/N groups is currently unclear.
Objective:
To determine the regions of association between atrophy and hypometabolism in A/T/N groups both within and across time points.
Methods:
We examined multivariate multimodal neuroimaging relationships between MRI and 18FDG-PET among suspected non-Alzheimer’s disease pathology (SNAP) (A–T/N+; n = 14), Amyloid Only (A+T–N–; n = 24) and Probable AD (A+T+N+; n = 77) groups. Sparse canonical correlation analyses were employed to model spatially disjointed regions of association between MRI and 18FDG-PET data. These relationships were assessed at three combinations of time points –cross-sectionally, between baseline visits and between month 12 (M-12) follow-up visits, as well as longitudinally between baseline and M-12 follow-up.
Results:
In the SNAP group, spatially overlapping relationships between atrophy and hypometabolism were apparent in the bilateral temporal lobes when both modalities were assessed at the M-12 timepoint. Amyloid-Only subjects showed spatially discordant distributed atrophy-hypometabolism relationships at all time points assessed. In Probable AD subjects, local correlations were evident in the bilateral temporal lobes when both modalities were assessed at baseline and at M-12. Across groups, hypometabolism at baseline correlated with non-local, or distant, atrophy at M-12.
Conclusion:
These results support the view that local concordance of atrophy and hypometabolism is the result of a tau-mediated process driving neurodegeneration.
Keywords
INTRODUCTION
Clinical manifestations of neurodegenerative diseases including Alzheimer’s disease (AD) and frontotemporal lobar degeneration (FTLD) are thought to be the result of neurodegeneration in select brain networks that occurs based on the distribution of underlying neuropathology [1]. In line with this view, the “A/T/N” framework [2] has emphasized classifying subjects based on pathology in order to improve antemortem predictions of disease progression [3, 4]. In the A/T/N classification schema, the staging of AD is delineated based on the presence/absence of markers of amyloid-β (A), phosphorylated tau (T), and neurodegeneration (N) in the cerebrospinal fluid (CSF). Thus, subjects are classified into one of multiple possible categories of biomarker abnormality: biomarker “Normal” (BN) for A–T–N–, “Amyloid Only” for A+T–N–, “AD-Continuum” for any A+ category and suspected “Non-AD pathologic change” (SNAP) for any A- with either T+ or N+. In comparison to extensive research delineating the pathological course of AD biomarkers [5–7], consensus on the etiology and the trajectory of SNAP subjects remains unclear [8–12]. It is of critical interest to develop sensitive and specific biomarkers which can differentiate A/T/N groups and provide increased information regarding their longitudinal trajectories.
Imaging measures of structural and functional brain integrity provide an objective and accessible biological means of assessing disease progression in vivo [13–16], correlate with clinical and cognitive measures [13, 18], and are sensitive to preclinical disease stages [19]. However, is currently unclear how the spatial and temporal pattern of multiple measures of neurodegeneration differ among A/T/N groups. Thus, a better understanding of how multimodal signatures vary as a function of pathological syndrome could serve as a valuable biomarker for these groups. In multimodal neuroimaging research, concordance of imaging modalities refers to the degree to which the signal generated by each modality mirrors the other, and has been used to compare and contrast neuroimaging measures such as atrophy and hypometabolism [20–24]. In particular, Sintini and colleagues [22] examined individuals with atypical clinical phenotypes of AD and found that tau-PET measures showed strong correlations with local (i.e., spatially contiguous) neurodegeneration (e.g., 18FDG-PET hypometabolism), suggesting tau may be the driving force behind neurodegeneration in this unique cohort. However, many of these studies measured concordance across the whole brain [21] or locally at the level of lobe [20] or network [24], thus providing only a limited description of the link between structure and function in the brain given that functionally connected yet spatially distributed brain regions can be affected by neuropathology [25].
Although they are not specific markers of neurodegenerative pathology, structural MRI-derived measures of cortical atrophy and 18FDG-PET hypometabolism are routinely used as biomarkers of neurodegeneration [26–28]. Importantly, atrophy and 18FDG-PET hypometabolism may overlap in critical “hub” regions of functional networks [29], which could serve as key drivers of disease. Moreover, progression of abnormalities in measures of brain structure and function occurs in an unequal temporal and spatial pattern within the brain [30]. Indeed, different pathophysiological aspects of neurodegenerative disorders can be captured by different neuroimaging modalities [31]. Further, the cortical pattern of structural and functional changes is not yet well understood among SNAP subjects, and no study to date has directly compared both the cross-sectional and longitudinal relationships between neuroimaging measures among A/T/N groups.
Here, we aimed to determine the relationship between atrophy and hypometabolism in A/T/N groups both within and across time points. Further, we employed methods to elucidate either local or distant (i.e., spatially disjointed) relationships, allowing insights into both the spatial and temporal patterning of neurodegeneration in A/T/N groups across time. To do so, we implemented sparse canonical correlation analysis (SCCA), an unsupervised multivariate method that estimates the linear relationship between two data sets. SCCA has been implemented previously in neuroimaging studies to compute spatially disjointed associations between modalities [22, 33]. We hypothesized that within time point concordance of atrophy and hypometabolism, as assessed by the SCCA, would be more spatially overlapping than cross-time point canonical dimensions. Cross time-point concordance, in particular baseline 18FDG-PET to 1-year follow-up atrophy, would be the least spatially overlapping (i.e., spread across brain regions), given the hypothesis that alternations in 18FDG-PET occur early due to synaptic activity disruptions that subsequently project trans-synaptically to downstream regions resulting in atrophy [34]. Further, due to the supposed regional effects of tau pathology on neurodegeneration, tau-positive groups (SNAP, Probable AD) would show the most spatially overlapping relationships of atrophy and hypometabolism, as compared to Amyloid-Only subjects.
METHODS
Participant selection
Data used in the preparation of this article were obtained from the Alzheimer’s Disease Neuroimaging Initiative (ADNI) database (https://adni.loni.usc.edu). ADNI was launched in 2003 as a public–private partnership, led by principal investigator Michael W. Weiner, MD. The primary goal of ADNI has been to test whether serial MRI, PET, other biological markers, and clinical and neuropsychological assessment can be combined to measure the progression of AD. Full details of subject recruitment, scanning protocols, diagnostic criteria, as well as imaging and CSF data processing are available on https://www.adni-info.org. ADNI protocols can further be found in reports by Jack et al. [35] and Mueller et al. [36]. Procedures involving experiments on human subjects are done in accord with the ethical standards of the Committee on Human Experimentation of the institution in which the experiments were done. ADNI participants were included in the current study when CSF, structural MRI and 18FDG-PET data were available at baseline visit and structural MRI and 18FDG-PET data were available at Month-12 (M-12) follow-up visit.
CSF samples were analyzed at the University of Pennsylvania, according to procedures as described in the ADNI procedures manual (https://www.adni-info.org/) using Elecsys CSF immunoassays. Amyloid deposition in the brain is associated with decreased levels of amyloid-β1–42 peptide (Aβ) in the CSF, while high levels of tau protein phosphorylated at threonine 181 (p-tau) in CSF are related to tau aggregation in the brain [37]. Measures of CSF total tau (t-tau) are considered a marker of non-AD specific neurodegeneration [38]. Participants were designated into A/T/N groups based on positive or negative A, T, or N status, using published cut-off points [39]: amyloid positivity (i.e., A+/A–) was based on an Aβ1–42 cut-off of <977 pg/mL; tau positivity (i.e., T+/T–) was based on a p-tau cut-off of >23 pg/ml; neurodegeneration positivity (i.e., N+/N–) was based on t-tau cut-off of >213 pg/ml. Consequently, we designated four A/T/N groups: “Biomarker Normal” (BN) who were A–T–N–, “SNAP” who were Amyloid-negative (A–T–N+, A–T+N–, and A–T+N+), “Amyloid-Only” who were only positive for only Aβ (i.e., A+T–N–), and “Probable AD” who were positive for Aβ, t-tau, and p-tau (A+T+N+).
Image processing
Structural MRI
Detailed descriptions of the ADNI image acquisition protocols procedures and post-acquisition preprocessing procedures can be found at https://www.adni.loni.usc.edu. This included geometric distortion of gradient nonlinearity, non-uniformity normalization, and histogram-peak sharpening, resulting in image volumes at 1×1×1 mm3 uniform resolution. After downloading from ADNI database, all T1-weighted MRI scans were processed through FreeSurfer version 5.3 [40] to generate cortical surface and thickness measures. Images were then subjected to quality control by visual inspection and any erroneous segmentation was corrected according to FreeSurfer data troubleshooting protocol. Manual correction was repeated until data were deemed ready to use by manual segmentation experts, and any scans noted to contain large or immutable errors were excluded. Cortical thickness was estimated as the distance between white matter and pial matter at each vertex. To match intrinsic smoothness of 18FDG-PET images, a 14 – mm FWHM kernel was applied to the cortical GM thickness data along the cortical white surface [41]. Cortical thickness values obtained through FreeSurfer were then mapped onto a MNI152 non-linear average (i.e., template white surface), resulting in per-subject thickness maps containing 297,800 vertices across all subjects for statistical analysis and visualization.
18FDG-PET
Detailed ADNI pre-processing steps for 18FDG-PET images can be found at https://adni.loni.usc.edu/methods/PET-analysis/pre-processing. These included co-registration, averaging, standardizing the spatial resolution, orientation, and normalization, as well as scanner-specific smoothing to achieve a uniform smoothing level of isotropic 8 mm FWHM. After downloading images from ADNI, 18FDG-PET images were then co-registered with their respective MRI images using the FSL-FLIRT program [42] based on normalized mutual information, using 9 degrees of freedom and normalized correlation as cost function. Cortical 18FDG-PET uptake values were then re-indexed to the above mentioned MNI-152 template white surface, resulting in corresponding vector sets of cortical 18FDG-PET update values across all subjects for statistical analysis and visualization. To achieve the same effective smoothness for 18FDG-PET data as with the cortical thickness processing of 14-mm FWHM, we determined the initial smoothness of the cortical 18FDG-PET uptake on the surface and performed additional smoothing [43]. The above MRI and 18FDG-PET image processing steps resulted in multimodal vectors of cortical gray matter thickness and cortical gray matter 18FDG-PET uptake data smoothed to the same degree across all subjects and correspondingly indexed over the MNI152 non-linear average template white surface.
Generation of vertex- and patch-wise W-score maps
After the above processing steps, W-scores [44, 45] were computed for cortical thickness and 18FDG-PET uptake to adjust for the effects of normal aging (Fig. 1A). W-scores were calculated by fitting a general linear model (GLM) in a set of reference subjects against age, then taking the standardized residuals generated from this model for all subjects [46]. They are analogous to z-scores, reflecting standardized levels of atrophy and hypometabolism for each individual subject after age-adjustment. For the reference set, we used subjects without a clinical diagnosis who remained cognitively normal through the ADNI follow-up period (see [47] for further details). Vertex-wise W-scores were then calculated for cortical thickness and 18FDG-PET uptake for all subjects following the formula: [(subject’s raw value) –(subject’s expected value)]/ (standard deviation of the residuals in the reference set). Finally, cortical surface vertices were parcellated into 360 roughly-equal-sized patches according to a validated atlas from the Human Connectome Project [48]. Patch-wise cortical thickness and 18FDG-PET W-scores were obtained by averaging W-scores across all vertices within a patch and used in subsequent sparse canonical correlation analyses. For supplemental analyses, W-scores for atrophy and hypometabolism were also entered into patch-wise direct comparisons using t-tests assuming unequal variances. Significance of T-scores was corrected for multiple comparisons using the Benjamini-Hochberg false discovery rate (FDR) of 0.05.
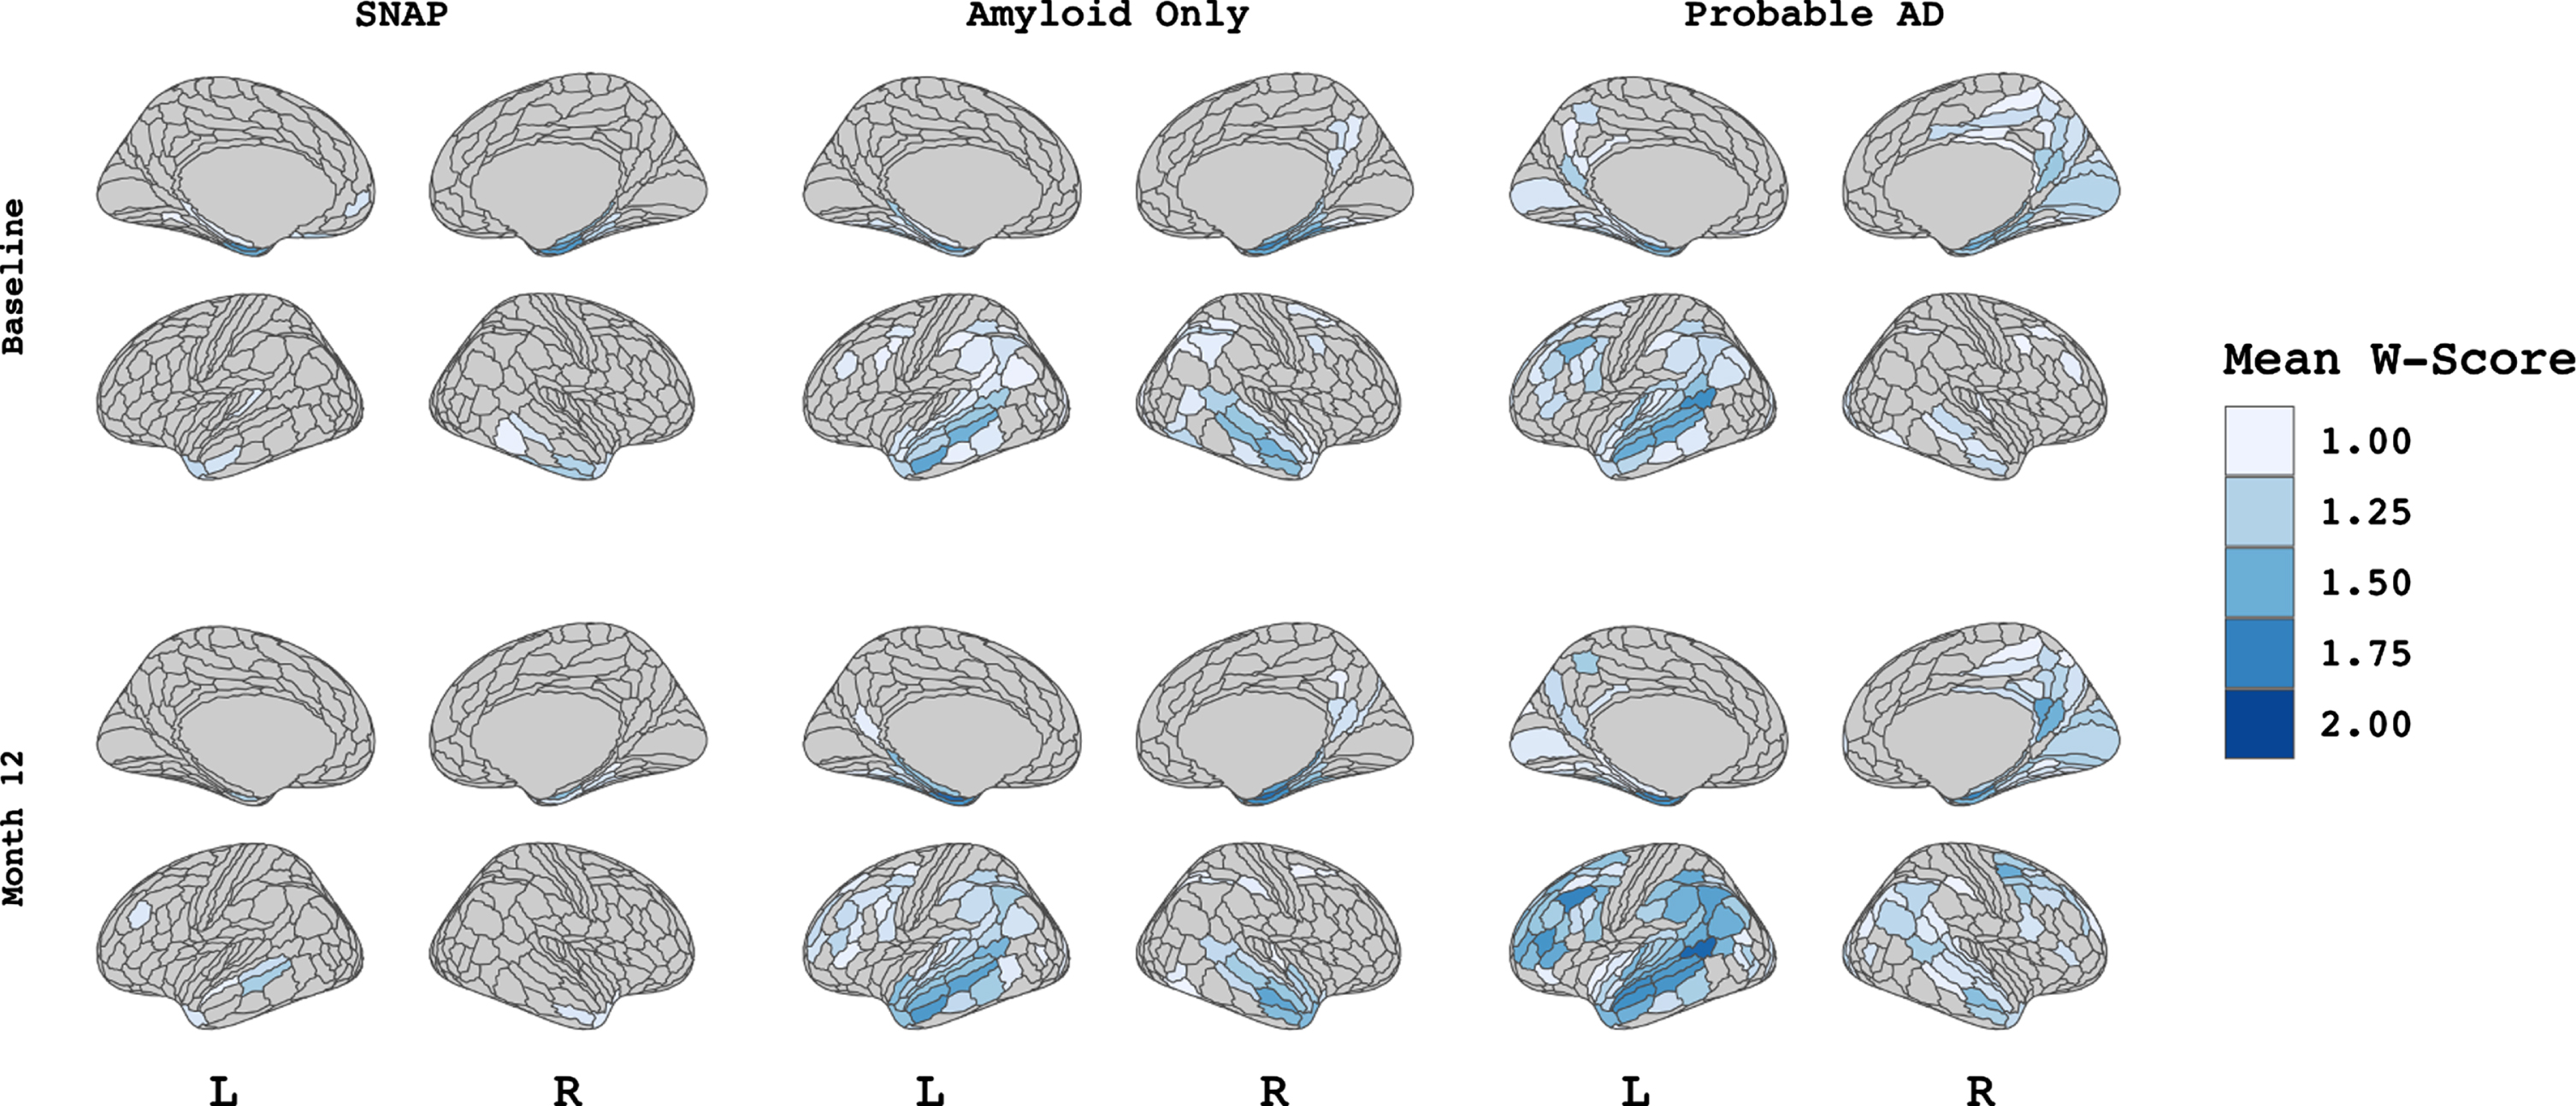
Patterns of cortical atrophy among A/T/N groups. Figure showing W-score values for each A/T/N group at both baseline visit (upper panel) and M-12 follow-up visit (lower panel). Values indicate the mean W-score within each of 360 patches (HCP-MMP1 atlas) per group thresholded at values greater than 1 to demonstrate atrophy that differs from expected trajectory based on age.
Multivariate sparse canonical correlation analysis
SCCA is an unsupervised multivariate method that estimates the linear relationship designed to take maximal advantage of the correlation among multivariate random variables [49]. Here, SCCA was applied using the penalized multivariate analysis (PMA) R package [50] to examine the relationships between baseline hypometabolism and atrophy, between M-12 hypometabolism and atrophy, and between baseline hypometabolism and M-12 atrophy, within each ATN group. In each analysis, a sparsity lasso penalty of 0.3 for both 18FDG-PET and MRI data was used, consistent with prior investigations [22, 32]. We applied permutation testing [22, 33] with 10,000 permutations to assess the significance of identified canonical relationships, wherein the p-value was defined as the ratio between the number of permutations that resulted in an equal or higher correlation than the original correlation and the total number of permutations applied. Due to the number of SCCAs performed across groups, significance was adjusted using the Benjamini-Hochberg FDR of 0.05. The first canonical dimension, which had 72 (out of 360) patches with non-zero weights, was used for visualization as a color map on the overall average surface using the R package ggseg [51]. Finally, we calculated a Dice spatial overlap between the non-zero patches between atrophy and hypometabolism for further interpretation, using the R package philentropy [52].
Relationship of SCCA regions to cognitive change
We assessed whether the neuroimaging features selected by the SCCA were related to changes in cognition. Cognition was assessed using a composite scale for memory, ADNI-Mem, [53] extracted from the ADNI neuropsychological battery. The 1-year rate of change in ADNI-Mem was modeled using a linear mixed effects model with fixed effects of time, age, sex, years of education and APOE ɛ4 genotype status with random slope and intercept terms for each participant. The rate of change in cognition for each individual was extracted from the model. Rates of change were then regressed against the mean W-score within the set of patches selected by the SCCA for each modality within each ATN group. Significance was adjusted for multiple comparisons using Benjamini-Hochberg correction for a false discovery rate of 0.05.
RESULTS
Participants
The demographics and clinical characteristics of the study population are listed in Table 1. Differences in study variables were assessed among A/T/N groups using chi-square tests for categorical variables and analyses of variance (ANOVAs) with follow-up pairwise comparisons for continuous variables. Data from 135 subjects with both baseline and M-12 visits from the ADNI database were included in this study. The “Biomarker Normal” (BN) group had 20 subjects, the “SNAP” group had 14 subjects, the “Amyloid Only” had 24, and the “Probable AD” group had 77. There were no significant differences between groups in age or sex. The Probable AD group showed greater frequency of APOE ɛ4 carriers than BN, SNAP, and Amyloid Only (p < 0.05), while Amyloid Only showed greater APOE ɛ4 carriership frequency than SNAP (p < 0.01). The Probable AD group had lower MMSE and ADNI-Mem score and a higher Clinical Dementia Rating Scale Sum of Boxes (CDRSB) score compared to BN, SNAP, and Amyloid Only subjects (all p < 0.05). Probable AD group showed a higher frequency of individuals with a clinical diagnosis of dementia than compared to BN, SNAP, and Amyloid Only subjects (all p < 0.001).
Demographic characteristics
Table showing summary of demographic variables. Results are reported as mean (std) for continuous variables or counts for discrete variables. 1indicates p < 0.5 for post-hoc pairwise analyses versus Biomarker Normal. Age and education are reported in years. MMSE, Mini-Mental State Exam; Memory Composite, Alzheimer’s Disease Neuroimaging Initiative Memory Composite; CDRSB, Clinical Diagnostic Rating Scale Sum of Boxes; CN, cognitively normal; MCI, mild cognitive impairment.
Patterns of cortical atrophy and hypometabolism among A/T/N groups
Figure 1 displays vertex-wise patterns of cortical atrophy among the three A/T/N groups at baseline and M-12 visits. Group average W-scores were thresholded at values greater 1 to visualize atrophy that differed from the expected value based on age. Qualitatively, cortical atrophy among the SNAP group was minimal at both baseline and M-12. However, a small amount of atrophy can be seen in the medial temporal regions at baseline that was relatively stable across time. Among Amyloid Only subjects, there is also evidence of temporal lobe atrophy at baseline, with additional atrophy in the inferior parietal and posterior cingulate cortex, then extends to include the bilateral middle temporal gyrus at M-12. Probable AD subjects show a characteristic pattern of medial temporal atrophy at baseline, expanding to the inferior parietal, precuneus, and dorsolateral frontal cortex at M-12.
Figure 2 displays patterns of cortical hypometabolism in the three A/T/N groups at baseline and M-12. Qualitatively, mild 18FDG-PET hypometabolism was observed in the SNAP subjects in the dorsolateral frontal and temporoparietal regions at both baseline and M-12. Amyloid Only subjects showed left-hemisphere predominant hypometabolism in the dorsolateral prefrontal and inferior parietal lobule at M-12 only, with minimal hypometabolism at baseline. Hypometabolism in Probable AD subjects follow a canonical temporo-parietal-predominant pattern at both baseline and M-12. T-scores directly comparing levels of atrophy and hypometabolism in each A/T/N group at baseline and M-12 are available in Supplementary Figure 1. T-scores are visualized as colormaps where red indicates greater hypometabolism than atrophy and blue indicates greater atrophy than hypometabolism, after controlling for multiple comparisons at an FDR of <0.05.
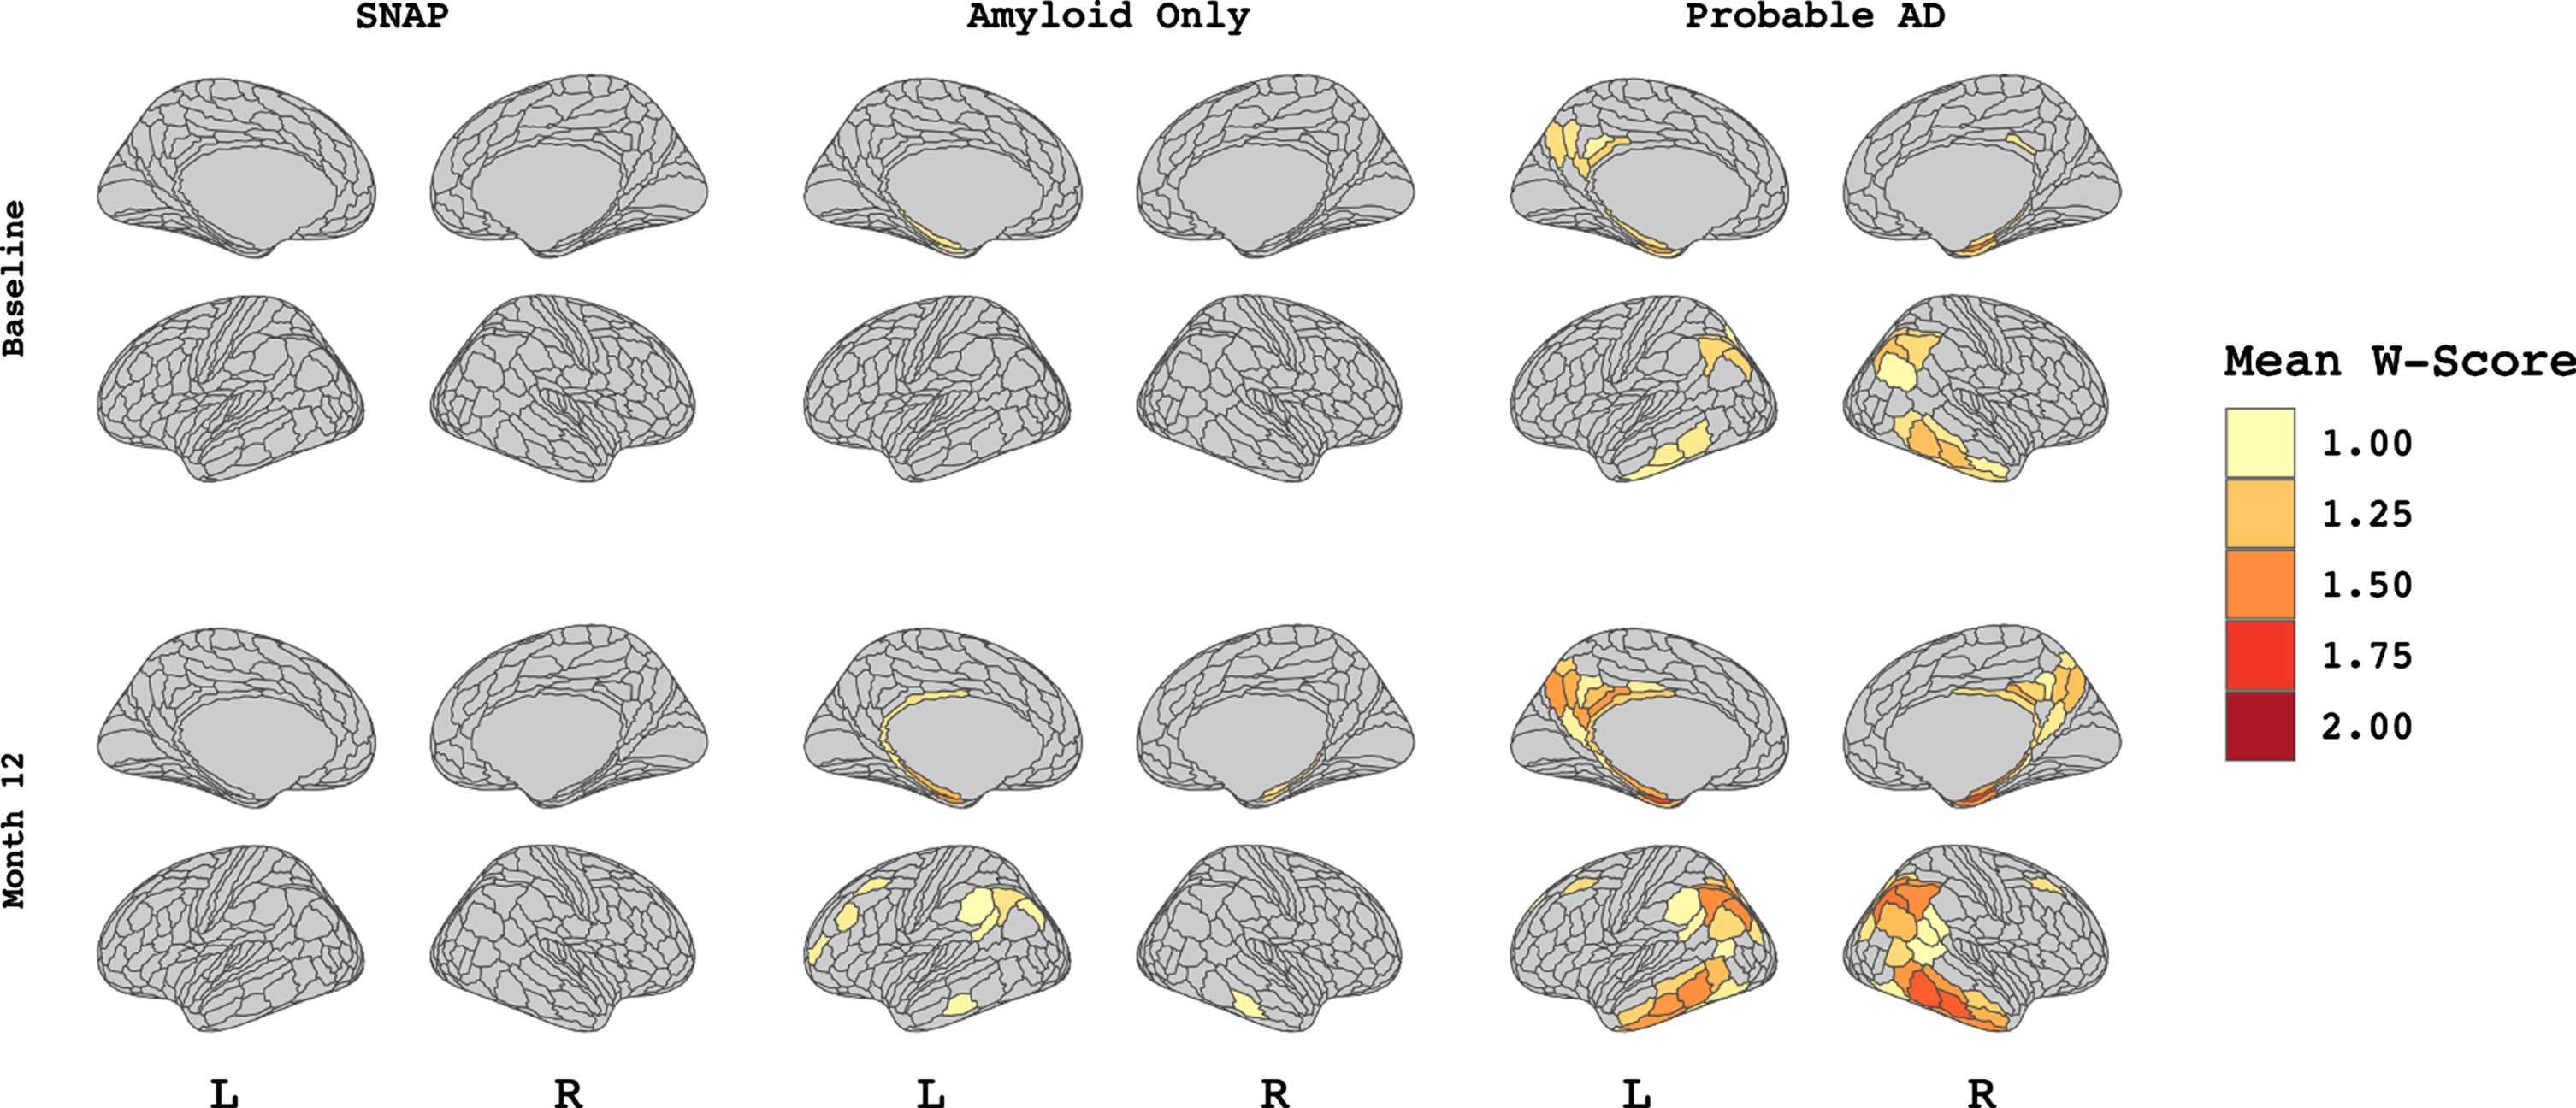
Vertex-wise patterns of FDG-PET hypometabolism among A/T/N groups. Figure showing vertex-wise W-score values for each A/T/N group at both baseline visit (upper panel) and M-12 follow-up visit (lower panel). Values indicate the mean W-score within each of 360 patches (HCP-MMP1 atlas) per group thresholded at values greater than 1 to demonstrate hypometabolism that differs from expected trajectory based on age.
Multivariate sparse canonical correlation
The BN group did not show any significant association between atrophy and 18FDG-PET hypometabolism in any time point combinations. Significant relationships for the SNAP group are displayed in Fig. 3. Each panel displays the patches which contributed to the first canonical dimension from hypometabolism (red), atrophy (blue), or both (purple). Visual inspection revealed an association (p < 0.01) between baseline atrophy in the bilateral prefrontal, left precuneus, and inferior temporal gyrus with baseline hypometabolism in temporoparietal regions, with a Dice correlation (i.e., degree of spatial overlap) of 0.25. There was a significant (p < 0.05) association between baseline hypometabolism in the right temporal lobe to bilateral frontal pole and cingulate atrophy at M-12, with minimal overlap (Dice correlation 0.02). Finally, the relationship between baseline hypometabolism and atrophy at M-12 was significant (p < 0.001) with a high degree of spatial overlap (Dice = 0.56), concentrated in the bilateral (right > left) temporal lobe.
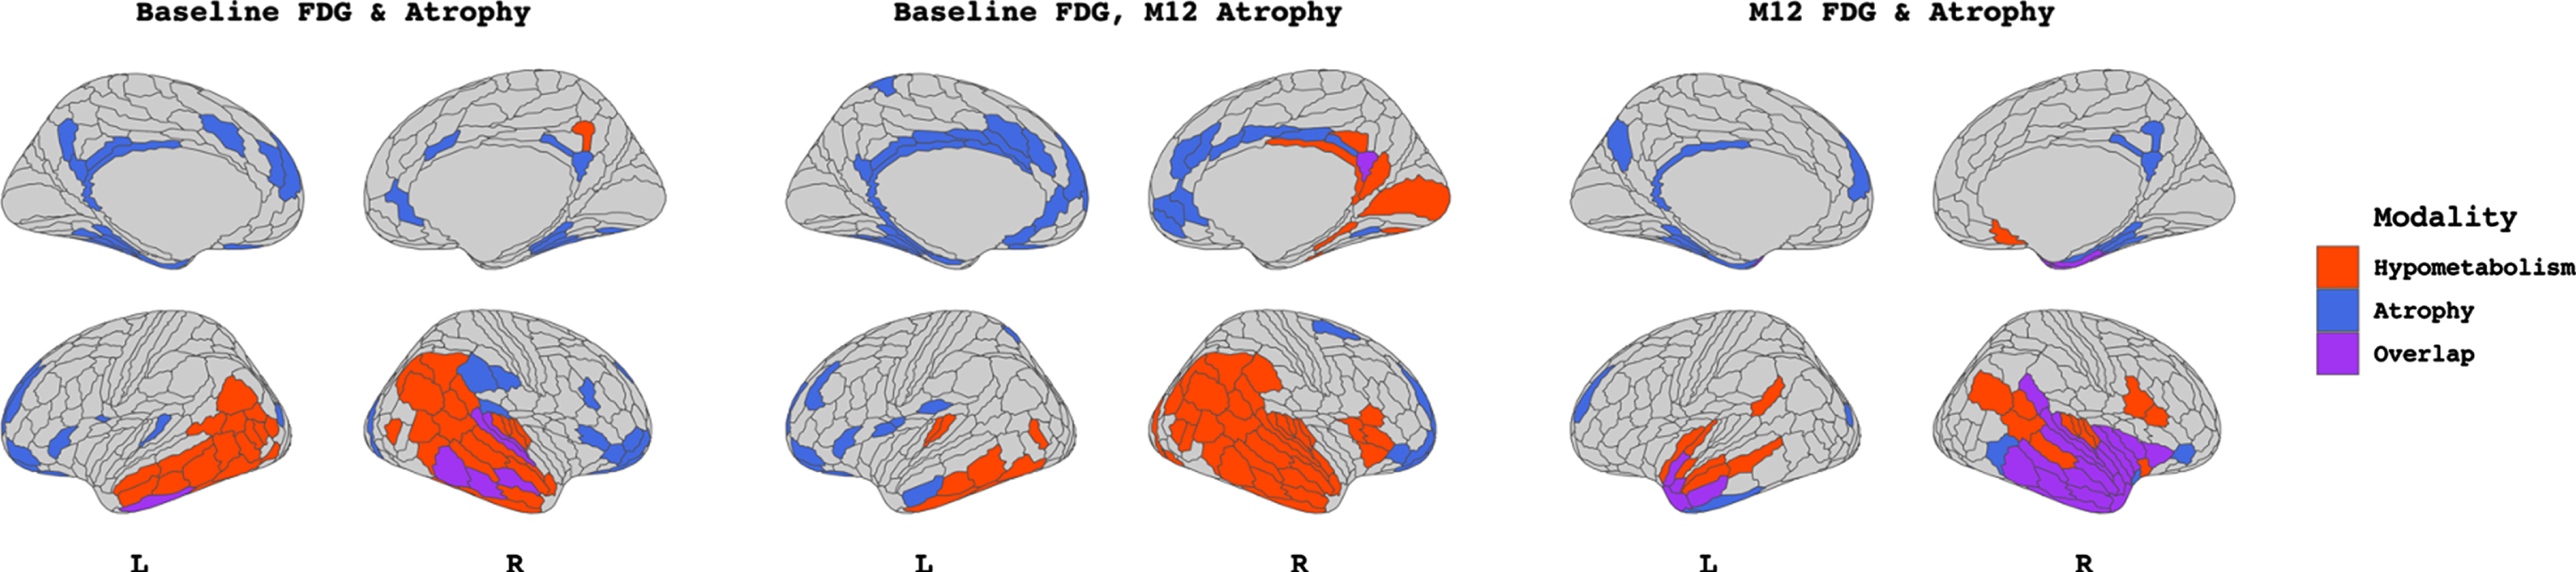
Output from sparse canonical correlation analyses performed within the SNAP group (n = 14) between baseline FDG-PET hypometabolism and baseline atrophy W-scores (left), between baseline FDG-PET hypometabolism and M-12 atrophy W-scores (middle), and between M-12 FDG-PET hypometabolism and M-12 atrophy W-scores (right). Patches filled in red and blue represent those which contribute to the canonical dimension from FDG-PET hypometabolism and atrophy, respectively. Patches filled in purple represent those which contribute to the canonical dimension from both modalities. Patch demarcation corresponds to HCP-MMP1 atlas.
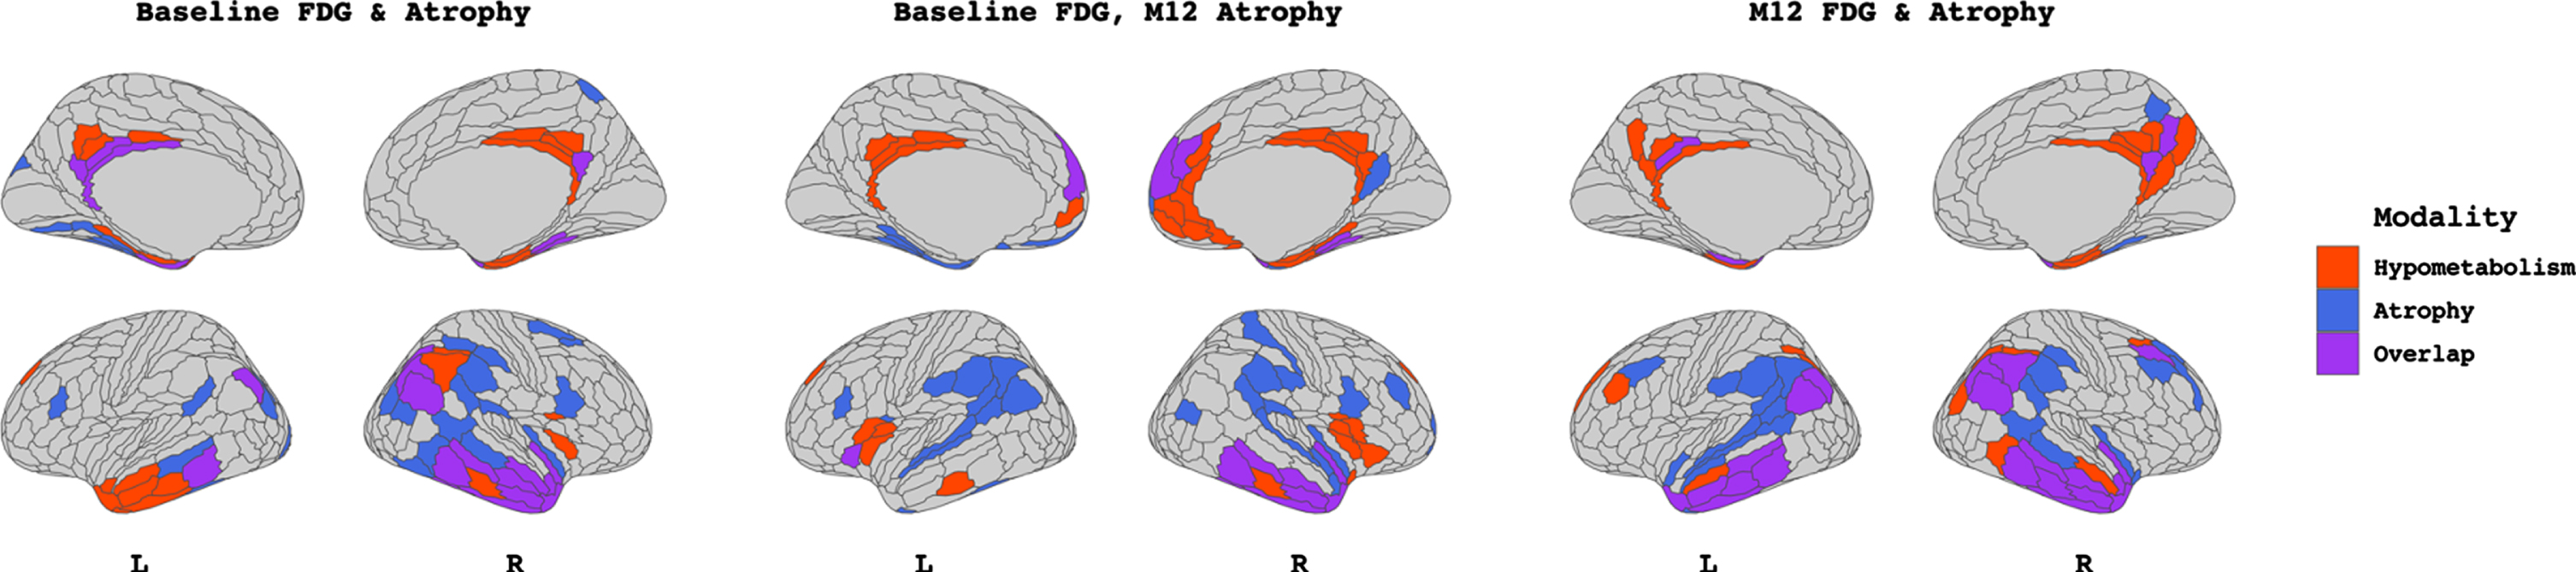
Significant relationships for the Amyloid Only group are displayed in Fig. 4. Baseline atrophy throughout the frontal, parietal and temporal lobe and bilateral prefrontal cortical hypometabolism were significantly associated (p < 0.01). Overlap was observed in the right inferior parietal lobule (IPL), left precuneus, and right inferior temporal gyrus at a Dice correlation of 0.12. A significant relationship (p < 0.05) was observed between baseline hypometabolism within the bilateral IPL, precuneus and frontal cortex and diffuse atrophy at M-12 in the temporal, parietal and occipital regions, with an overlap Dice correlation of 0.28. At month-12, hypometabolism in the frontal pole and orbitofrontal cortex correlated and atrophy in the dorsolateral prefrontal (DLPFC) as well as anterior temporal regions showed a significant association (p < 0.01), with an overlap Dice correlation of 0.28.

Output from sparse canonical correlation analyses performed within the Amyloid Only group (A+T–N–, n = 24) between baseline FDG-PET hypometabolism and baseline atrophy W-scores (left), between baseline FDG-PET hypometabolism and M-12 atrophy W-scores (middle), and between M-12 FDG-PET hypometabolism and M-12 atrophy W-scores (right). Patches filled in red and blue represent those which contribute to the canonical dimension from FDG-PET hypometabolism and atrophy, respectively. Patches filled in purple represent those which contribute to the canonical dimension from both modalities. Patch demarcation corresponds to HCP-MMP1 atlas.
Figure 5 displays significant relationships in the Probable AD group significant (all p < 0.001). Atrophy-hypometabolism SCCA at baseline showed a high degree of spatial overlap (Dice = 0.45), concentrated in the bilateral temporal lobes for both atrophy and hypometabolism. Baseline hypometabolism in the right temporal and anterior and posterior cingulate cortices correlated with bilateral temporoparietal/IPL atrophy at M-12, with an overlap Dice correlation of 0.29. M-12 analysis revealed a high degree of overlap (Dice 0.50) between hypometabolism and atrophy, concentrated in the temporoparietal cortices.
Output from sparse canonical correlation analyses performed within the Probable AD (A+T+N+, n = 77) group (n = 24) between baseline FDG-PET hypometabolism and baseline atrophy W-scores (left), between baseline FDG-PET hypometabolism and M-12 atrophy W-scores (middle), and between M-12 FDG-PET hypometabolism and M-12 atrophy W-scores (right). Patches filled in red and blue represent those which contribute to the canonical dimension from FDG-PET hypometabolism and atrophy, respectively. Patches filled in purple represent those which contribute to the canonical dimension from both modalities. Patch demarcation corresponds to HCP-MMP1 atlas.
Relationships to cognition
In the SNAP group, baseline 18FDG-PET hypometabolism was correlated to the slope of cognitive change (i.e., hypometabolism was related to declining cognition) within the patches identified as correlated to both baseline and M-12 atrophy (all p < 0.05, Table 2). Atrophy at baseline within patches identified as correlated to baseline hypometabolism was correlated to negative slope of cognitive change (i.e., cortical thinning was related to declining cognition, p < 0.05). Among Amyloid Only subjects, neither hypometabolism nor atrophy in SCCA-derived regions at any time point showed a significant relationship to cognitive change (all p > 0.05). In Probable AD, hypometabolism at baseline within patches identified as correlated to baseline and M-12 atrophy showed a significant relationship to negative slope of cognitive change (all p < 0.05).
Regression Analyses Predicting Slope of ADNI-Mem
*p < 0.05. **p < 0.01. Multiple comparisons correction applied: FDR.
DISCUSSION
In this study, we investigated local and distant relationships between atrophy and hypometabolism, both cross-sectionally and longitudinally, across the AD continuum [2]. To do so, we implemented novel multivariate SCCA methodology and applied it to both within- and across-time point data. We showed that, in SNAP subjects, while at the group level there were only minimal deviations from age-expected patterns of atrophy and hypometabolism, a pattern of bilateral temporal lobe hypometabolism at baseline correlated with spatially distant atrophy at baseline as well as at M-12 follow-up. At M-12, however, spatially overlapping relationships between atrophy and hypometabolism in the bilateral (right > left) temporal lobes were observed. Additionally, we observed that Amyloid Only subjects, who showed only mild deviations from age-expected patterns of atrophy and hypometabolism at the group level, showed atrophy-hypometabolism relationships which were generally spatially contiguous (i.e., proximal but not directly spatially overlapping, Dice ranged from 0.24–0.28) both within and across time-points. We found that Probable AD subjects, who showed characteristic patterns of significant deviations from age-expected patterns of atrophy and hypometabolism in the temporoparietal cortex, also showed highly spatially overlapping relationships between atrophy and hypometabolism (Dice ranged 0.29–0.50), concentrated in the bilateral temporal lobes at all time points assessed. Additionally, patterns across the time points showed the least amount of overlap, i.e., when baseline 18FDG-PET hypometabolism was correlated with atrophy at M-12 follow-up, in particular for the SNAP (Dice = 0.02) and Probable AD groups (Dice = 0.29). Overlaps were generally low in Amyloid Only subjects at all time points assessed (Dice ranged from 0.24–0.28), possibly reflecting the aforementioned spatially contiguous relationships between the patches contributing to the canonical dimensions among this group. Finally, we showed that 18FDG-PET hypometabolism in regions identified by the SCCA were correlated to subjects’ longitudinal rates of cognitive change in the SNAP and Probable AD groups, while atrophy in regions identified by the SCCA showed similar relationships to cognition only within the SNAP group.
In typical AD-related neuropathological change, alterations in brain glucose metabolism begin in the posterior cingulate cortex before spreading to the neighboring precuneus and temporoparietal cortical areas [54–57]. In contrast, atrophy typically begins in the medial temporal lobe and extends later into the lateral temporal lobes, cingulate cortex, and temporoparietal regions [58–61]. Generally, cortical hypometabolism is observed to be more widespread than atrophy until late in the disease process [23, 63]. Further, patterns of regional alterations in hypometabolism are often topographically distinct from those of atrophy [20, 64]. Explanatory theories with regard to the discrepancy between the topology of atrophy and hypometabolism include that hypometabolism is thought to reflect early synaptic dysfunction that precedes atrophy [65, 66], or that hypometabolism more closely reflects tau pathology due to stronger observed relationships of local hypometabolism to tau-PET [67–71]. Alternatively, it has been posited that FDG-PET hypometabolism can occur in regions that are physically distant, but functionally connected, to a structural or pathological lesion [72]. Indeed, hypometabolism has been shown to have stronger associations with amyloid-PET uptake in functionally connected regions than with local amyloid-PET uptake [73]. Here, we showed evidence of strong regional relationships between atrophy and hypometabolism in the Probable AD group when both modalities were assessed at baseline and M-12 follow-up visit as well as in the SNAP group at M-12 follow-up. While we did not directly assess tau pathology, this finding of a stronger spatial coupling of atrophy and hypometabolism in CSF tau-positive subjects is consistent with prior research suggesting that tau accumulation drives local neurodegeneration [64, 74]. It is important to note, however, that while measures of CSF p-tau are related to degree of tau-pathology as assessed by tau-PET, these effects are only moderate [75]. Atrophy-hypometabolism relationships that may suggest a focal disease process were only evident in our analyses among SNAP at M-12 and among Probable AD at baseline and M-12. Neurobiologically, we hypothesize that this may represent tau “driving” local neurodegeneration in these groups at these time points, thus creating a signal that is both represented in, and correlated between, atrophy and hypometabolism. A logical next step for future research in this area would be to employ similar multivariate paradigms assessing concordance between atrophy and hypometabolism with tau and amyloid PET. If tau indeed drives local neurodegeneration in SNAP and other tau-positive groups, we may expect to find similar overlapping patterns of relationships among canonical dimensions between the two modalities. In contrast, we would expect to see spatially distant relationships between atrophy and amyloid-PET in both Amyloid Only and Probable AD groups.
Our investigation of between time-point relationships between atrophy and hypometabolism revealed topographically distinct relationships between modalities across groups. In particular, non-spatially overlapping but spatially contiguous relationships between atrophy and hypometabolism were consistently observed in the Amyloid Only group across the three sets of time points assessed. While we did not directly assess amyloid-β pathology using amyloid-PET, previous reports of amyloid-PET abnormalities in the absence of indicators of tau pathology have been shown have weak relationships with the patterns of neurodegeneration (atrophy/hypometabolism) and cognition [44, 76]. However, longitudinal studies of AD subjects suggest that amyloid-β and p-tau may act synergistically to trigger clinical disease progression [77, 78]. Indeed, while initial amyloid-β deposition occurs in the heteromodal association cortices [79], connectivity-mediated interactions between neurofibrillary tangles in the entorhinal cortex and distal amyloid-β may drive further tau spreading and concurrent neurodegeneration [80]. Consistent with these models, we observed relationships between atrophy and hypometabolism in tau-negative subjects which was sparse and typically restricted to lateral prefrontal regions at both baseline and between baseline and M-12 follow-up. At M-12 follow-up, canonical correlation analyses revealed patches of atrophy in the temporal lobe correlated with frontal lobe hypometabolism. Importantly, while Amyloid Only subjects in our study were p-tau negative as assessed by CSF, this does not necessarily preclude the possibility that these individuals harbor tau pathology, either at subthreshold levels or that tau-pathology was developed over the follow-up period.
SNAP subjects are an understudied, presumably heterogenous group of individuals [8–12]. Here, we found minimal deviations from expected atrophy and hypometabolism in SNAP subjects at both baseline and M-12 follow-up visits. This is consistent with our prior study demonstrating minimal group-level differences with biomarker normal subjects in atrophy or hypometabolism among SNAP subjects within the ADNI cohort [24]. This may indicate that the present SNAP group may not reflect individuals with an active neurodegenerative process, as t-tau elevations denoting A/T/N “N” positivity are presumed to be nonspecific and can occur due to a number of non-neurodegenerative processes, including vascular insults, traumatic brain injury, or other medical comorbidities [81]. However, a significant portion of the SNAP subjects studied here had both t-tau and p-tau positivity and showed clinical disease severity scores similar to those in the Amyloid Only group (see Table 1 for sample characteristics). To that end, the SNAP group may represent individuals with non-Alzheimer’s neurodegenerative pathologies that are commonly observed in elderly or amyloid-negative cohorts, including α-synucleinopathies, non-Alzheimer tauopathies, TDP-43 proteinopathies, or vascular lesions [82, 83]. Postmortem neuropathological examinations reveal that SNAP have heterogeneous pathological profiles and are more likely to have mixed pathologies than amyloid-positive groups [84]. Moreover, the presence of both TDP-43 and tau pathology has been shown to correlate with hippocampal volume among SNAP subjects [84], offering a possible mechanistic role for the amnestic deficits observed in this group.
We observed atrophy-hypometabolism relationships in SNAP subjects which were topographically overlapping, similar to those in the Probable AD group, but at the M-12 follow-up visit only, i.e., as they progressed over time. Interestingly, W-scores within regions of 18FDG-PET hypometabolism and atrophy identified as correlated by the SCCA showed significant associations to longitudinal memory change in the SNAP group. These relationships were strongest within regions of 18FDG-PET hypometabolism at baseline that were identified as correlated to M-12 atrophy. Similarly, patches of 18FDG-PET hypometabolism identified as by the SCCA in the Probable AD group as related to longitudinal atrophy were similarly related to cognition. Thus, regions where 18FDG-PET hypometabolism is closely correlated to concurrent and future atrophy could possibly serve as a biomarker for tau-related neurodegeneration and help identify subjects at greatest risk for future cognitive decline. In both SNAP and Probable AD, the SCCA-derived patches of 18FDG-PET hypometabolism that showed significant relationships to cognition were generally located in the bilateral temporal and parietal cortex, areas which are known to neuroanatomically subserve memory functions [85] and to degenerate in AD [86]. However, the SCCA-derived patches of atrophy identified in the SNAP group as correlated to longitudinal cognitive change were located in the posterior and anterior cingulate as well as prefrontal cortex. These areas may support memory [87] but also comprise portions of the salience network [88], which has been shown to selectively degenerate in non-AD neuropathologies, such as behavioral-variant frontotemporal dementia [1]. Future research should investigate whether regions identified by the present SCCA analyses are uniquely implicated in connectivity-based disease progression in this SNAP group.
Several considerations with regard to this work should be noted. First, our sample size was limited by the number of subjects from the ADNI cohort who had both a baseline and M-12 MRI and 18FDG-PET scan, and who additionally underwent CSF immunoassays at baseline. A restrictive number of subjects did not receive CSF immunoassays at their M-12 follow-up visit, and as such we do not know whether all our A/T/N subjects remained in the same category at their follow-up visit. Nevertheless, a considerable strength of the present analysis is the use of a longitudinal subject design. Studies that have previously examined multimodal correlations between imaging modalities have only done so within a single time point [22, 32], and few have examined these relationships both within and across time points within the A/T/N framework [89]. Regarding the A/T/N framework, while we have previously employed the this framework [24] to assess differences between SNAP and Alzheimer’s Disease Continuum (AD-Continuum) subjects, the latter group contains any amyloid-β positive subject. It is likely that the AD-Continuum group is highly heterogenous with regard to clinical or cognitive severity, given that approximately one-third of cognitively normal older adults have AD pathology in their brains [90]. To this end, in the present study, we split the AD-Continuum group into Amyloid Only (e.g., A+T–N–) and Probable AD (A+T+N+) to better understand the differential effect of the presence of amyloid-β versus t-tau/p-tau biomarker positivity on atrophy-hypometabolism relationships.
The present study extends prior findings in several important ways. We found complex spatial associations between atrophy and glucose hypometabolism across three combinations of time points, that additionally differ based on the presence/absence of markers of amyloid-β and tau pathology in the CSF. As predicted, we observed less spatial overlap in the patches which contributed to the atrophy-hypometabolism relationship when baseline hypometabolism was correlated to atrophy at the M-12 follow-up visit. Further, non-spatially overlapping, but spatially contiguous, relationships between atrophy and hypometabolism were observed at all time points in the Amyloid Only group, possibly reflecting early amyloid deposition across heteromodal association cortices that is not yet associated with a tau-mediated neurodegenerative process in the medial temporal lobes. Finally, we observed strong spatial overlap in the atrophy-hypometabolism relationship in both the tau-positive SNAP and Probable AD groups, possibly reflecting tau-driven local neurodegeneration in the temporal cortices. Longitudinal multimodal neuroimaging studies such as these are incredibly valuable in the endeavor to characterize the trajectory of AD and non-AD neuropathological change and can aid in the detection of biomarkers for clinical decline.
Footnotes
ACKNOWLEDGMENTS
The authors have no acknowledgments to report.
FUNDING
This project was supported by R01-AG055121 from the National Institute on Aging.
CONFLICT OF INTEREST
The authors have no conflict of interest to report.