
Abstract
Background:
We have explored dementia’s blood-based protein biomarkers in the Texas Alzheimer’s Research and Care Consortium (TARCC) study. Among them are adipokines, i.e., proteins secreted by adipose tissue some of which have been associated with cognitive impairment.
Objective:
To associate adipokines with dementia severity and replicate their association across cohorts and biofluids (serum /plasma).
Methods:
We used eight rationally chosen blood-based protein biomarkers as indicators of a latent variable, i.e., “Adipokines”. We then associated that construct with dementia severity as measured by the latent dementia-specific phenotype “δ” in structural equation models (SEM). Significant factor loadings and Adipokines’ association with δ were replicated across biofluids in the Alzheimer’s Disease Neuroimaging Initiative (ADNI).
Results:
Eight adipokine proteins loaded significantly on the Adipokines construct. Adipokines measured in plasma (ADNI) or serum (TARCC) explained 24 and 70% of δ’s variance, respectively. An Adipokine composite score, derived from the latent variables, rose significantly across clinical diagnoses and achieved high areas under the receiver operating characteristic curve (ROC/AUC) for discrimination of Alzheimer’s disease from normal controls (NC) or cases of mild cognitive impairment (MCI) and between NC and MCI.
Conclusion:
These results again suggest that SEM can be used to create latent biomarker classifiers that replicate across samples and biofluids, and that a substantial fraction of dementia’s variance is attributable to peripheral blood-based protein levels via the patterns codified in those latent constructs.
Keywords
INTRODUCTION
There is growing interest in the role obesity in the pathogenesis of dementia and Alzheimer’s disease (AD). It has been proposed that adipose tissue might contribute to cognitive impairment via several mechanisms, including cerebrovascular disease, alterations in brain structure, and by the release of and adipocytokines (i.e., “adipokines”) [1–3]. Obesity and aging can lead to dysregulated adipokine release [4].
We have associated the serum adipokine adiponectin (APN) with dementia severity among participants in the Texas Alzheimer’s Research and Care Consortium (TARCC) [5]. Other adipokines have been shown to mediate the unique effects of age [6] and depressive symptoms [7] on dementia severity. Serum resistin rises with dementia severity and is elevated in “AD” cases identified as being demented solely by depressive symptoms [8, 9]. That adipokine also fully attenuates the unique 2.3-fold risk of 5-year prospective mild cognitive impairment (MCI) conversion to clinical “AD” associated with symptoms of depression [10].
Dementia severity in those analyses was measured by the latent dementia-specific phenotype “δ’ (for “dementia”). δ is extracted from Spearman’s general intelligence factor g [11] via confirmatory factor analysis (CFA) in a structural equation model (SEM) framework [12]. Our bifactor SEM model parses g into two orthogonal (unrelated) fractions: 1) δ, i.e., “the psychometric correlates of functional status”, and 2) g’, i.e., residual variance in g that is empirically unrelated to IADL [13].
δ can be “reified” as a composite “d-score” and applied to individuals as an omnibus dementia severity metric, i.e., a dementia-specific phenotype. Because g is thought to contribute to all cognitive measures, it has proven feasible to construct δ from a wide range of batteries. This results in multiple d-score composites which comprise a set of δ “homologs”. In genetics, a homolog is a gene derived from an ancestral gene and retaining the original’s function. All δ homologs published to date achieve similarly strong correlations with dementia severity [e.g., as measured by the Clinical Dementia Rating Scale “Sum of Boxes” (CDR-SB)] [14] and high areas under the receiver operating characteristic curve (AUC/ROC) for the discrimination of various dementias from normal controls (NC).
The two δ homologs most relevant to this analysis are the ethnicity equivalent “dEQ” homolog [15] and the “TARCC to the Alzheimer’s Disease Neuroimaging Initiative (ADNI)” homolog, “dT2A” [16]. dEQ was engineered to achieve factor equivalence in TARCC across Mexican-American (MA) and non-Hispanic White (NHW) ethnicities. Our first demonstration of APN’s association with δ was accomplished using dEQ [5]. However, we have recently replicated several other blood-based TARCC biomarker findings in ADNI using dT2A. TARCC and ADNI are both well-characterized longitudinally-followed convenience samples of community-dwelling elderly persons with and without cognitive impairment [17, 18]. Their cognitive batteries overlap substantially, and both have deployed similar blood-based biomarker panels processed by a common vendor [i.e., Rules Based Medicine (RBM) of Austin, Texas].
Using dT2A, we have successfully replicated the blood-based protein mediators of Age’s unique effect on δ [19], and inflammation’s age-independent association with δ across cohorts and biofluids [20]. TARCC measures blood-based protein biomarkers in serum, while ADNI measures them in plasma.
For the current analysis, we explore the associations between δ and the several adipokines available in TARCC and ADNI. At least 600 proteins have been identified as putative “adipokines” [21]. However, TARCC has data on eight, including APN, alpha 1 anti-trypsin (A1-AT), interleukin-1 receptor agonist (IL-1ra), leptin (Leptin), monocyte chemoattractant protein-1 (MCP-1), resistin (Resistin), tumor necrosis factor alpha (TNFa), and vascular endothelial growth factor (VEGF). These have been measured in serum in TARCC. All but IL-1ra are available in plasma in ADNI. ADNI additionally has data on plasma complement factor H (Complement H), which is unavailable in TARCC. From these biomarkers, we construct a latent “Adipokines” factor representing their integrated effect on δ in TARCC. We then replicate our findings in ADNI across cohorts and biofluids.
MATERIALS AND METHODS
This is a secondary analysis of data collected by TARCC and ADNI. We have previously replicated other blood-based biomarkers as predictors of δ in these two cohorts using methods identical to those employed in this analysis [19, 20]. These will be briefly reviewed below.
Subjects
Informed consent was obtained from all participants (or their legally authorized proxies) before data collection, and both studies are approved by their respective Institutional Review Boards (IRB).
ADNI
ADNI data used in the preparation of this article were obtained from the ADNI database (http://adni.loni.usc.edu). ADNI is a well characterized longitudinal convenience sample developed to validate magnetic resonance, positron emission tomography, cerebrospinal fluid, and genetic biomarkers for use in AD clinical trials. The initial 5-year study, ADNI-1, enrolled cognitively normal, MCI, and AD subjects, and the subsequent studies (ADNI-GO and ADNI-2) added early- and late-MCI cohorts. ADNI has provided a framework for similar initiatives worldwide, including TARCC.
TARCC
TARCC is a longitudinally followed convenience sample of elderly persons with AD (n = 1,275), MCI (n = 723), or NC (n = 1,445) (and 58 “others”) recruited from five Texas medical schools. These categorical clinical diagnoses were established through consensus. TARCC’s cohort is ethnically diverse and includes both MA and NHW. However, ethnicity has pronounced effects on serum protein biomarkers in TARCC [14, 23]. We therefore restricted this analysis to NHW TARCC participants (N = 2,213).
Clinical variables
dT2A, a δ homolog for ADNI
dT2A’s construction has been recently described [16]. Its cognitive indicators were limited to observed measures that are common to both studies, including the Boston Naming Test (BNT) [24], Category Fluency (Animals) [25], L7gical Memory I (LMI) and II (LMII) [26], the Mini-Mental Status Examination (MMSE) [27], and Trial-Making Part B (TrailsB) [28]. All are available in TARCC in Spanish translation.
dT2A’s target indicators
In TARCC, we used informant-rated IADL as dT2A’s target indicator [29]. Unfortunately, IADL is not available in ADNI, and so the Functional Assessment Questionnaire (FAQ) [30] was used instead.
Observed clinical measures
Observed clinical measures are often used as covariates or to provide external validation. The following measures are available in both TARCC and ADNI.
Self (informant)-reported age, education, and gender are self-explanatory. TARCC has a substantial number of MA participants. However, there are no racial distinctions in TARCC, and no reported racial effects on plasma protein biomarkers in ADNI.
The Clinical Dementia Rating Scale “Sum of Boxes” (CDR-SB) [14]: The CDR is used to evaluate dementia severity. The rating assesses the patient’s cognitive ability to function in six domains—memory, orientation, judgment and problem solving, community affairs, home and hobbies and personal care. Information is collected during an interview with the patient and their caregiver (15 min).
Geriatric Depression Scale (GDS): Depressive symptoms were assessed in both studies by the GDS [31, 32]. GDS scores range from zero-30. Higher scores are worse. The GDS is valid in demented persons [33].
Blood-based biomarkers
Blood-based biomarkers were processed in both studies by a common vendor (Rules-Based Medicine (RBM) in Austin, TX). RBM conducted multiplexed immunoassay via their human multi-analyte profile (human MAP). Biomarker processing methods have been reported elsewhere [17–19].
Statistical analyses
The analysis was performed using Analysis of Moment Structures (AMOS) software [34]. For this analysis, a reflective latent variable (“Adipokines”) was constructed in both TARCC and ADNI from the eight adipokine biomarkers available in each study. APN, A1-AT, leptin, MCP-1, resistin, TNFa, and VEGF were available in both TARCC and ADNI. Interleukin-1 receptor agonist (IL-1ra) was uniquely available in TARCC. Complement H was uniquely available in ADNI.
TARCC’s RBM biomarkers are known to exhibit significant batch effects. We therefore adjusted each TARCC biomarker with dichotomous dummy variables coding batch. Batch adjustment was not necessary in ADNI.
Missing data
We used Full Information Maximum Likelihood (FIML) methods to address missing data. FIML uses the entire observed data matrix to estimate parameters with missing data. In contrast to list wise or pair wise deletion, FIML yields unbiased parameter estimates, preserves the overall power of the analysis, and is arguably superior to alternative methods, e.g., multiple imputation [35, 36].
Fit indices
The validity of structural models was assessed using two common test statistics. A non-significant chi-square signifies that the data are consistent with the model [37]. However, the ratio of the chi-square to the degrees of freedom in the model is also of interest. A CMIN/DF ratio <5.0 suggests an adequate fit to the data [38]. The comparative fit index (CFI), with values ranging from between 0 and 1, compares the specified model with a model of no change [39]. CFI values below 0.95 suggest model misspecification. Values of 0.95 or greater indicate adequate to excellent fit. A root mean square error of approximation (RMSEA) of 0.05 or less indicates a close fit to the data, with models below 0.05 considered “good” fit, and up to 0.08 as “acceptable” [40]. All three fit statistics should be simultaneously considered to assess the adequacy of the models to the data.
RESULTS
Descriptive statistics are presented in Table 1. Cross-cohort differences exist for almost all the variables, consistent with case-mix and demographic differences between two convenience samples. ADNI appears to have a relatively high fraction of MCI cases, which were recruited explicitly into ADNI-2 and ADNI-GO. TARCC has a much higher prevalence of MA participants. Education favors ADNI, which has a slightly better mean MMSE score. Tables 2 3 present the mean concentration for each biomarker in serum (TARCC) and plasma (ADNI) respectively. We lack access to the number of outliers and samples below the limit of quantification. However, the combined effects of both issues cannot have been more than 3.5% [i.e., N = 31/880 for TNFa in TARCC (Table 2)] as all other biomarkers exhibit less missingness. The batch-adjusted ADIPOKINES construct was significantly associated with baseline body mass index (BMI) in TARCC (r = –0.09, p = 0.002). BMI was not available to us in ADNI.
Descriptive statistics by sample
*TARCC uses 30 item BNT, ADNI uses 60 item BNT. **Scaled score. †p>0.05; ‡ p < 0.001. ADNI, Alzheimer’s Disease Neuroimaging Initiative; Animals, Animal Naming; BNT, Boston Naming Test; CDR-SB, Clinical Dementia Rating scale “Sum of Boxes”; GDS, 30 item Geriatric Depression Scale; LMI, Wechsler Logical Memory immediate recall; LMII, Wechsler Logical Memory delayed recall; MA, Mexican-American; MMSE, Mini-Mental State Exam; SD, standard deviation; TARCC, Texas Alzheimer’s Research and Care Consortium; Trails B, Trail Making Test Part B. *Scaled scores.
Descriptive statistics by diagnosis (TARCC NHW)
*TARCC uses 30 item BNT. **Scaled score.
TARCC’s model had excellent fit [χ2 = 569.2 (86), p < 0.001; CFI = 0.98; RMSEA = 0.05] (Fig. 1). All proteins except TNFa (r = 0.03, p = 0.10) loaded significantly on the Adipokine construct ranging from Leptin (r = 0.06, p < 0.05) to Resistin (r = 0.51, p < 0.001). Leptin, Resistin, and VEGF loaded positively on the Adipokine construct which was strongly (r = 0.86, p < 0.001) and positively (adversely) associated with dT2A. The remaining proteins, measured in serum, had inverse loadings on Adipokines suggesting a moderating effect on dT2A via that construct. Adipokines explained 70% of dT2A’s variance in TARCC. If, on the other hand, the same biomarkers are regressed onto dT2A in a multivariate regression model, fit suffers, only 40% of δ’s variance is explained, and Leptin does not have a significant effect independent of the other proteins (data not shown).
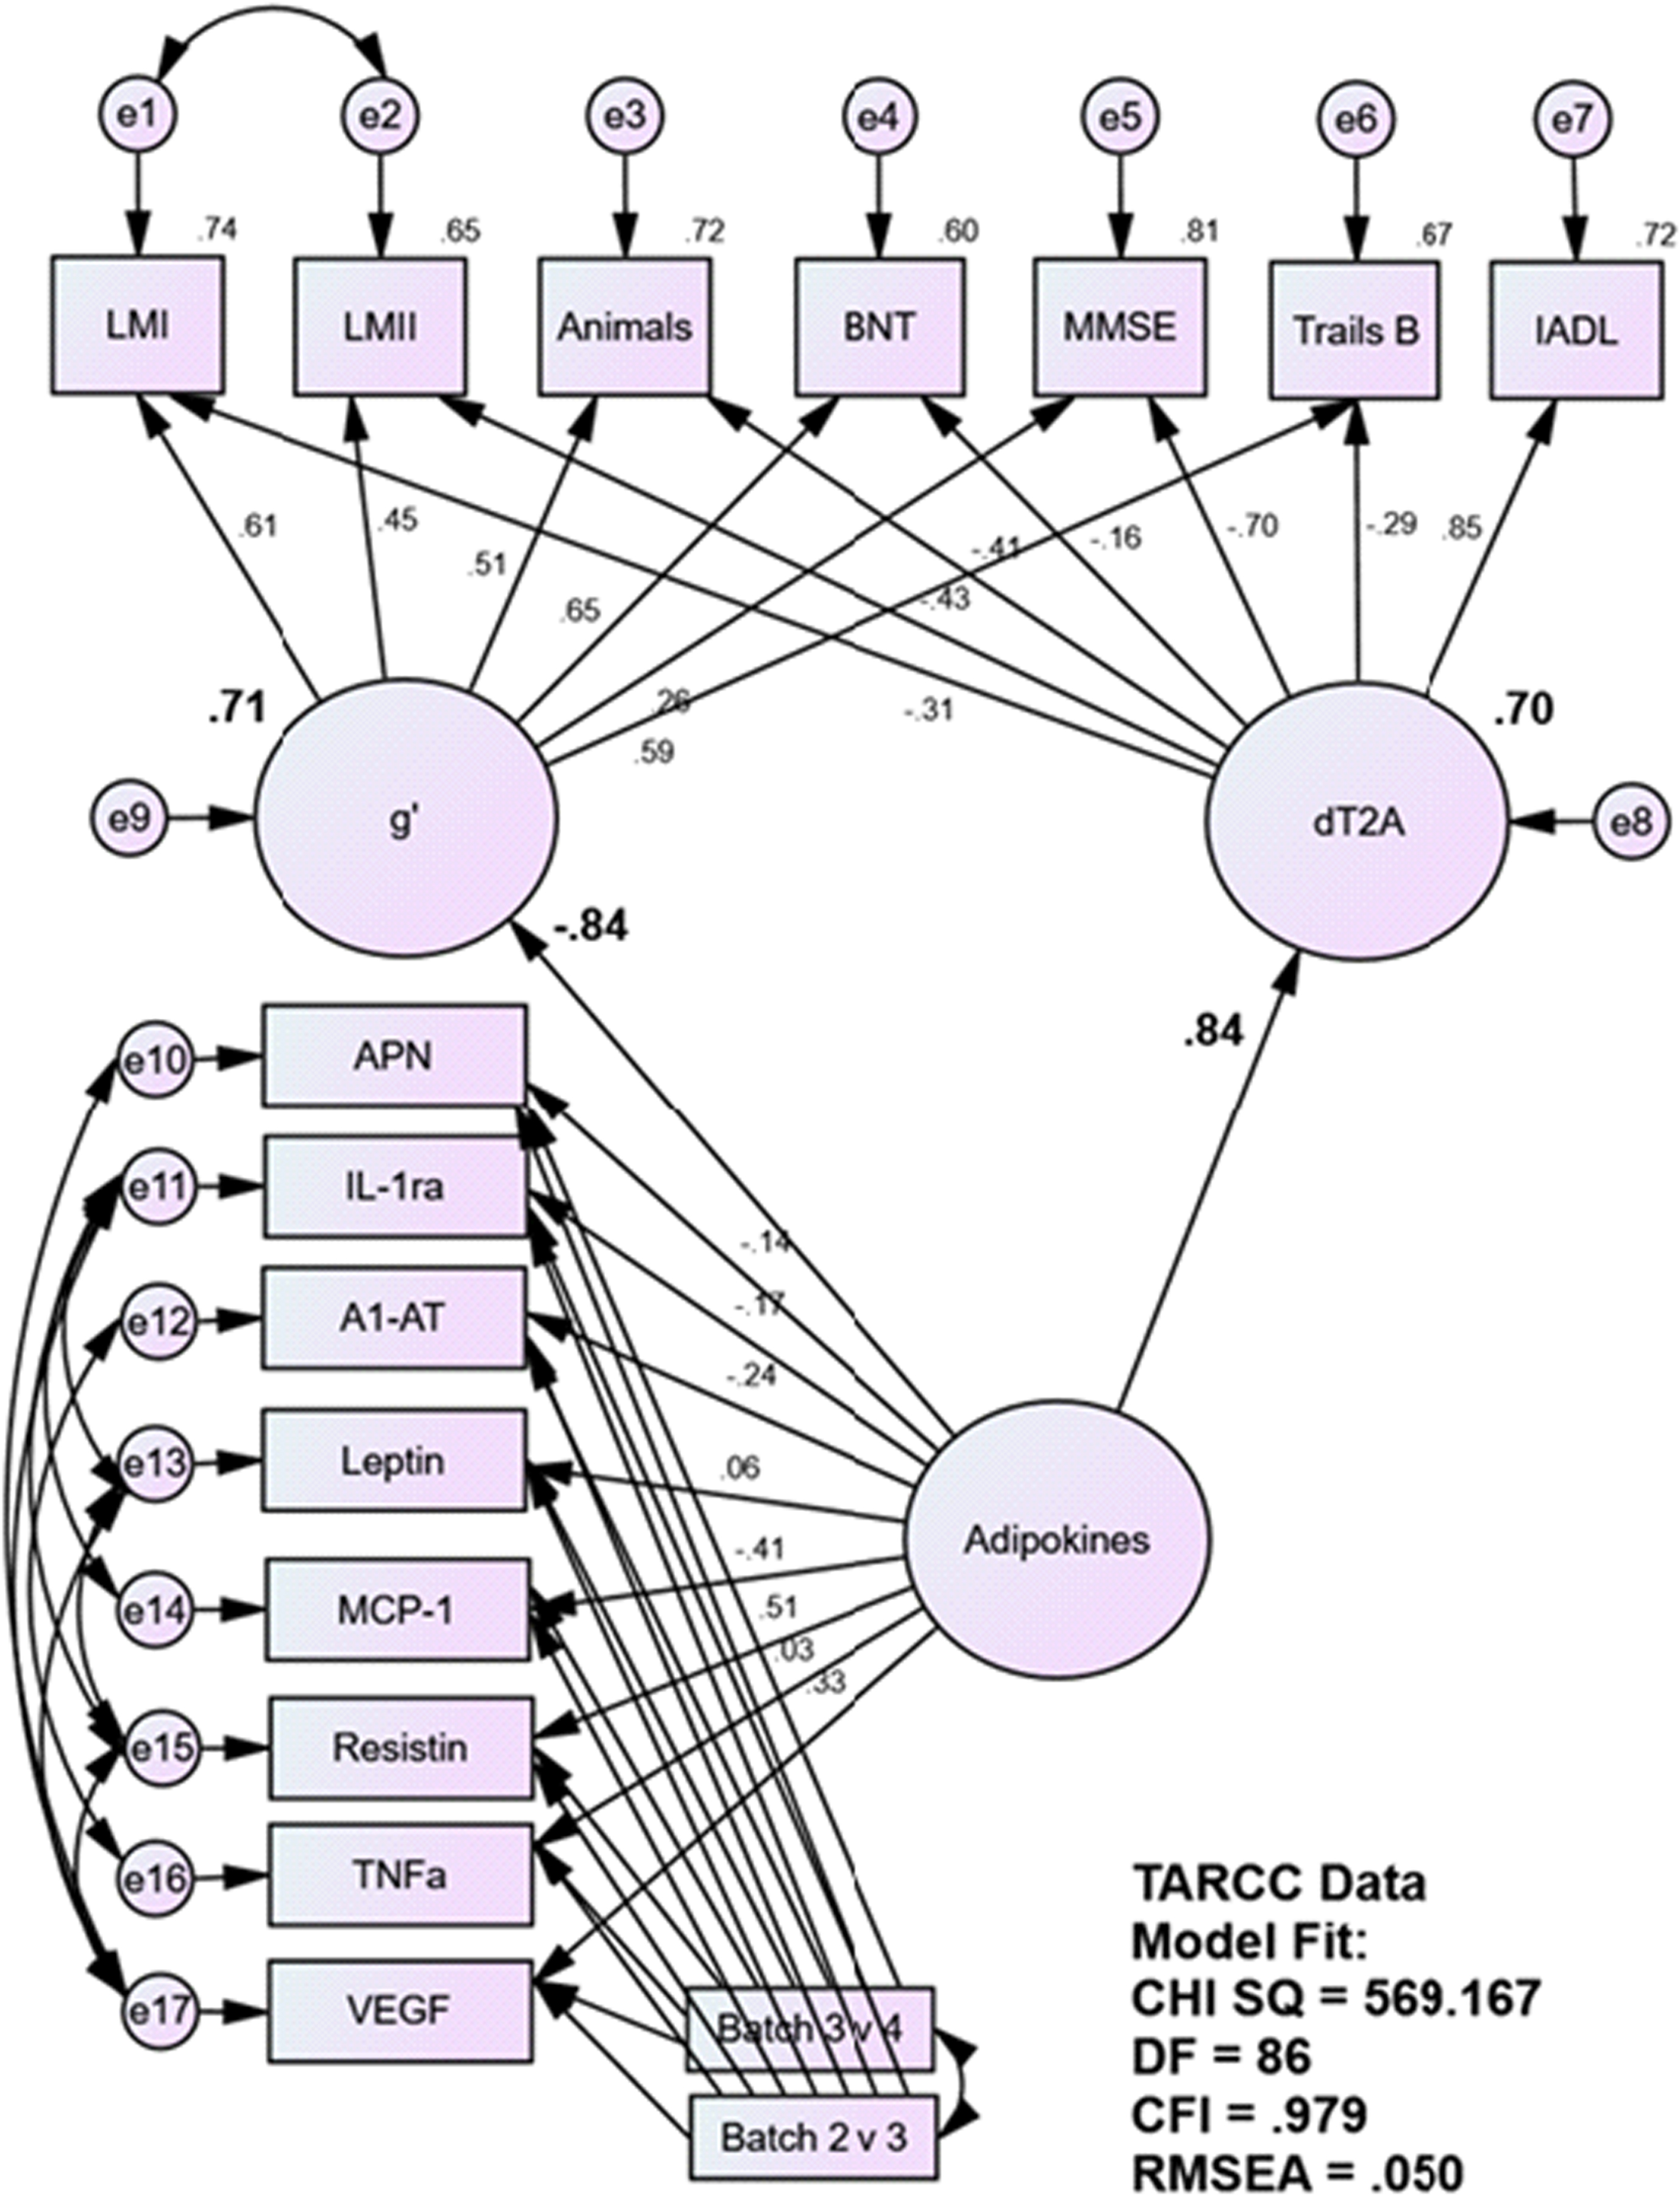
Adipokine’s Association with δ in TARCC (NHW)/Serum. A1-AT, alpha 1 anti-trypsin; Animals, Animal Naming; APN, adiponectin; BNT, Boston Naming Test; CHI QS, Chi Square; CFI, Comparative Fit Index; IADL, Instrumental Activities of Daily Living; IL-1ra, interleukin-1 receptor agonist; LMI, Wechsler Logical Memory immediate recall; LMII, Wechsler Logical Memory delayed recall; MCP-1, monocyte chemoattractant protein-1; MMSE, Mini-Mental State Exam; RMSEA, Root Mean Square Evaluative Assessment; TARCC, Texas Alzheimer’s Research and Care Consortium; TNFa, tumor necrosis factor alpha; Trails B, Trail-Making Test part B; VEGF, vascular endothelial growth factor.
The ADNI model also fit well [χ2 = 160.4 (73), p < 0.001; CFI = 0.99; RMSEA = 0.03] (Fig. 2). The eight proteins, now measured in plasma, had significant loadings on Adipokines which was moderately associated with dT2A (r = 0.49, p < 0.001). and explained 24% of dT2A’s variance. The direction of their association was again positive, consistent with an adverse effect. All the biomarkers loaded positively on Adipokines. If, on the other hand, the same biomarkers are regressed onto dT2A in a multivariate regression model, fit suffers, only 9% of δ’s variance is explained, and APN, MCI-1 and TNFa do not have significant effects independent of the other proteins (data not shown).
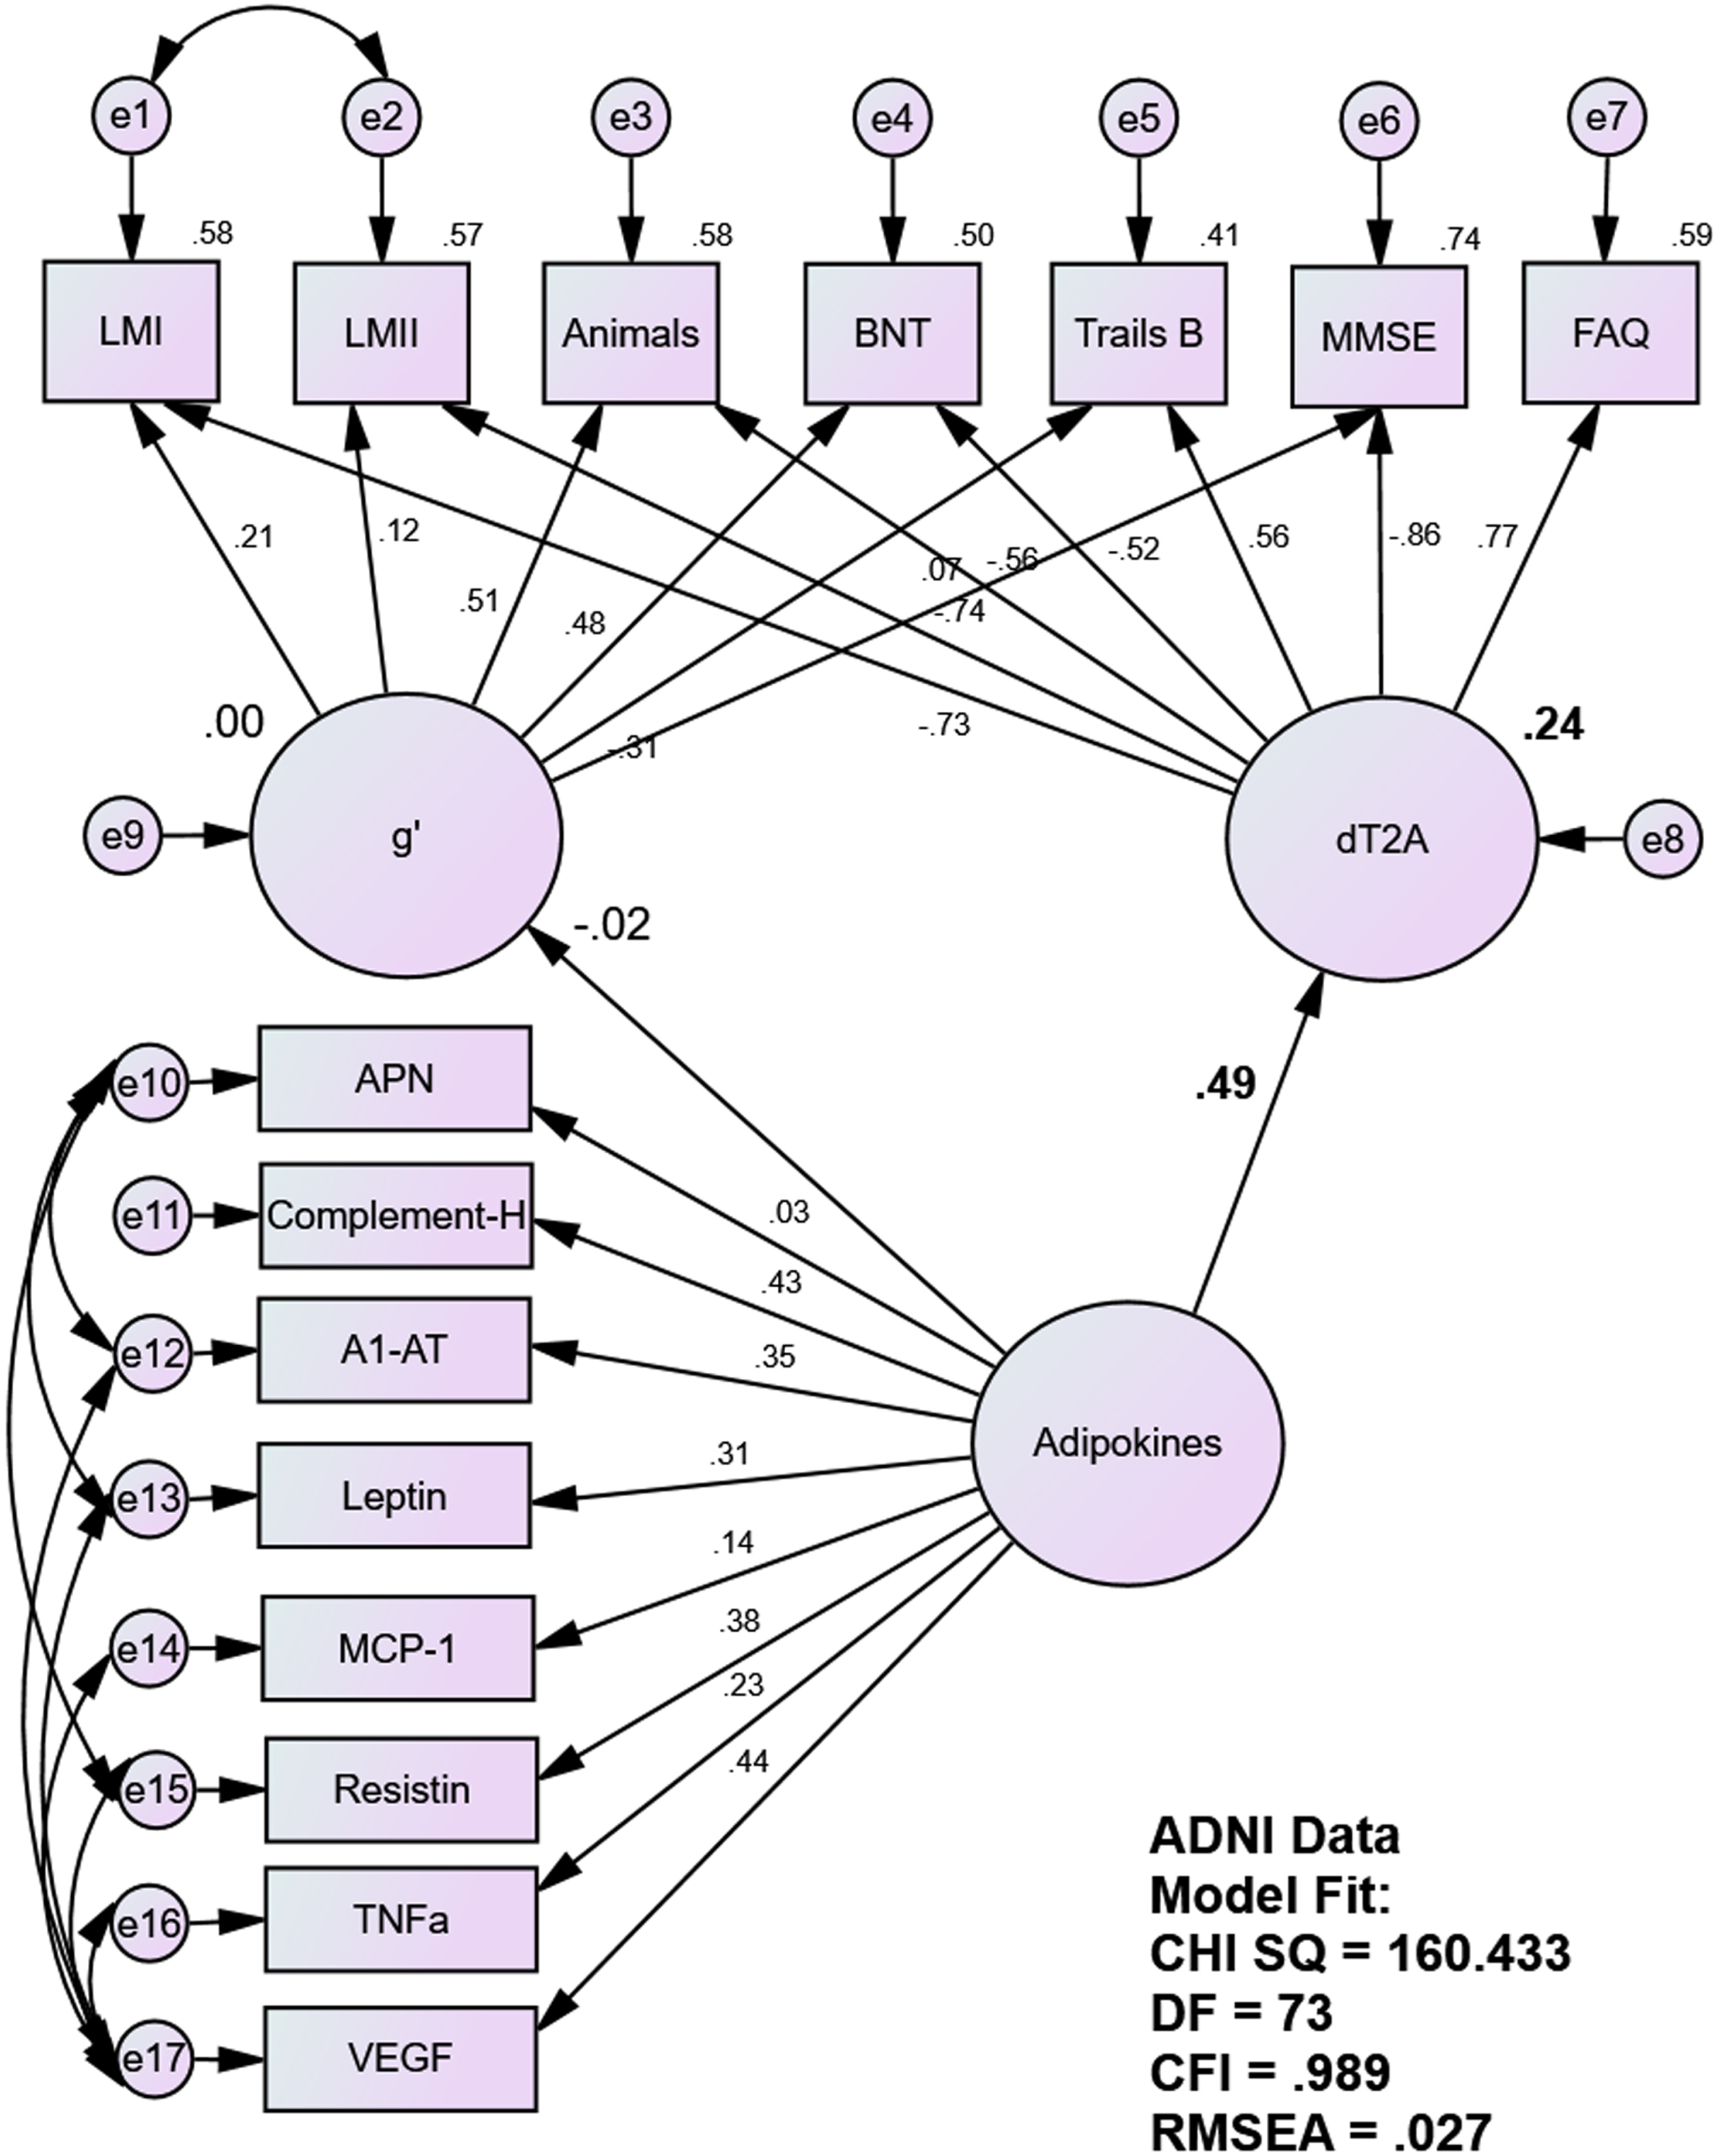
Adipokine’s Association with δ in ADNI/Plasma. A1-AT, alpha 1 anti-trypsin; ADNI, Alzheimer’s Neuroimaging Initiative; Animals, Animal Naming; APN, adiponectin; BNT, Boston Naming Test; CHI QS, Chi Square; CFI, Comparative Fit Index; FAQ, Functional Activities Questionnaire; IL-1ra, interleukin-1 receptor agonist; LMI, Wechsler Logical Memory immediate recall; LMII, Wechsler Logical Memory delayed recall; MCP-1, monocyte chemoattractant protein-1; MMSE, Mini-Mental State Exam; RMSEA, Root Mean Square Evaluative Assessment; TNFa, tumor necrosis factor alpha; Trails B, Trail-Making Test part B; VEGF, vascular endothelial growth factor.
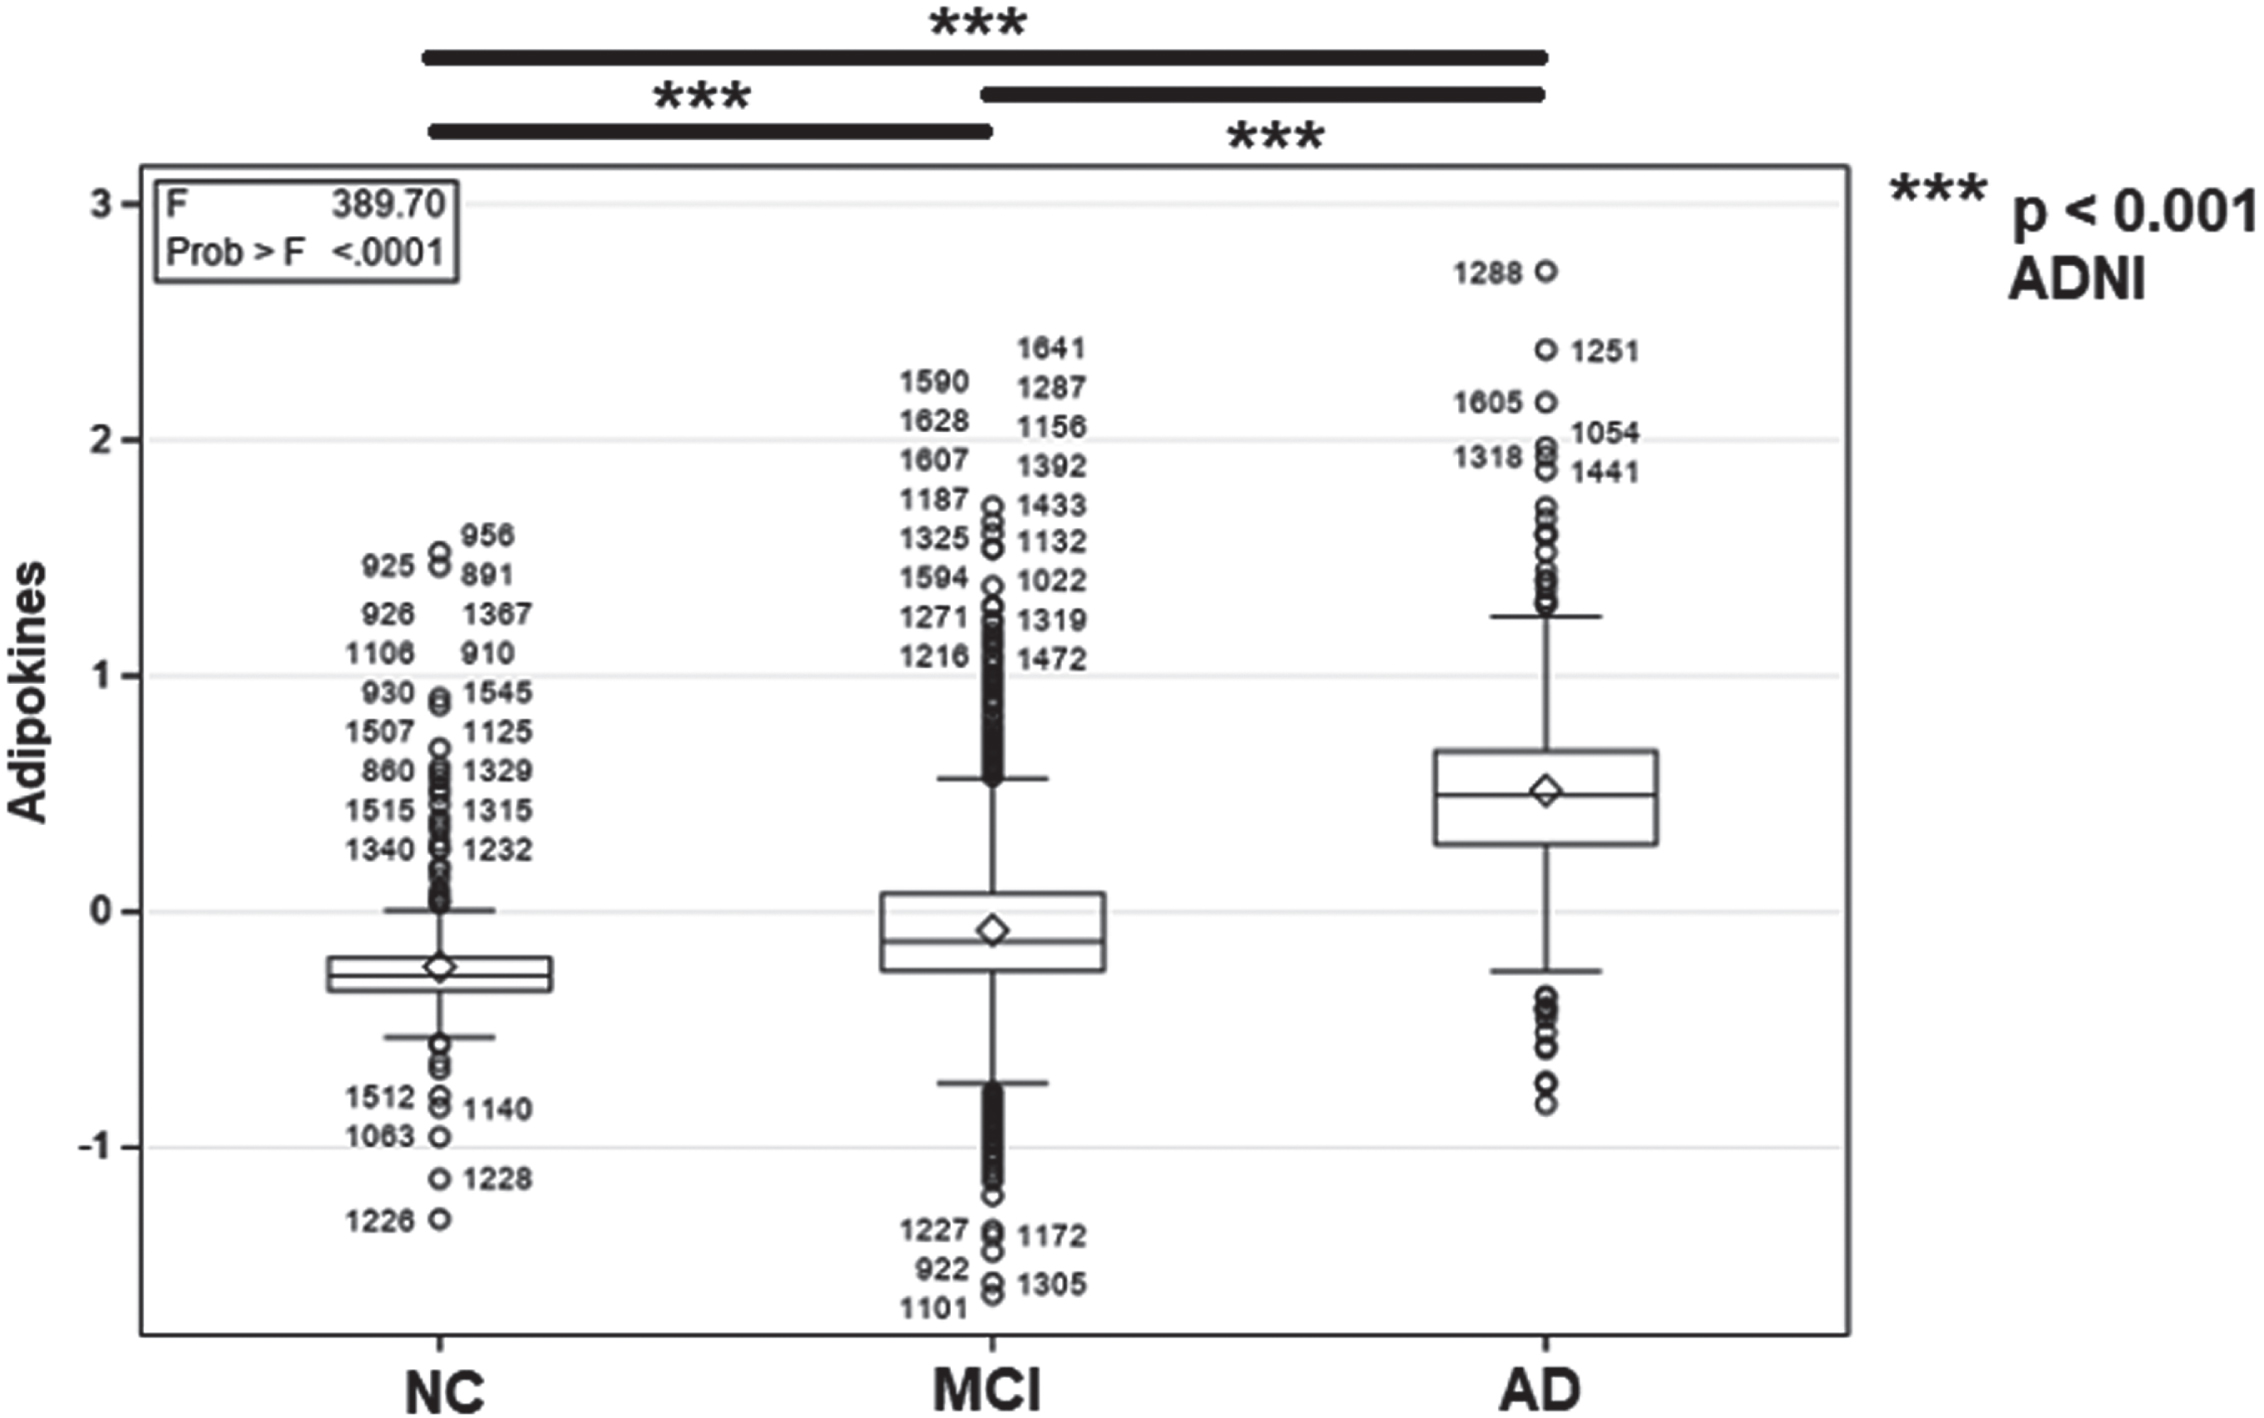
Tables 6 7 present the results of ROC analyses in TARCC/serum and ADNI/plasma, respectively. The Adipokines composite rose significantly across diagnoses in both samples/biofluids, and distinguished AD and MCI from NC and from each other (Figs. 3, 4).
Descriptive Statistics by Diagnosis (ADNI)
*ADNI uses 60 item BNT. **Scaled score.
Biomarker Means in Serum (TARCC NHW) (unstandardized)
*mg/ml; ** μg/ml; ***pg/ml; ****ng/ml.
Biomarker Means in Plasma (ADNI) (unstandardized)
*mg/ml; ** μg/ml; ***pg/ml; ****ng/ml.
ROC Analyses (TARCC NHW)
ROC analyses (ADNI)

Cross-Group Differences in Serum Adipokine Scores (TARCC NHW)*. *Standardized values. AD, Alzheimer’s disease; MCI, mild cognitive impairment; NC, normal controls, TARCC, Texas Alzheimer’s Research and Care Consortium.
Cross-Group Differences in Plasma Adipokine Scores (ADNI)*. *Standardized values. AD, Alzheimer’s Disease; ADNI, Alzheimer’s Disease Neuroimaging Initiative; MCI, mild cognitive impairment; NC, normal controls.
In TARCC/serum, the Adipokines construct achieved high AUC for AD’s discrimination from NC (AUC = 0.98) and MCI (AUC = 0.90) (Fig. 5A–C). Adipokines was less accurate in distinguishing NC from MCI, but still achieved AUC = 0.81, sensitivity = 0.64, specificity = 0.87). Similar results were achieved in ADNI /plasma (Fig. 6A–C).
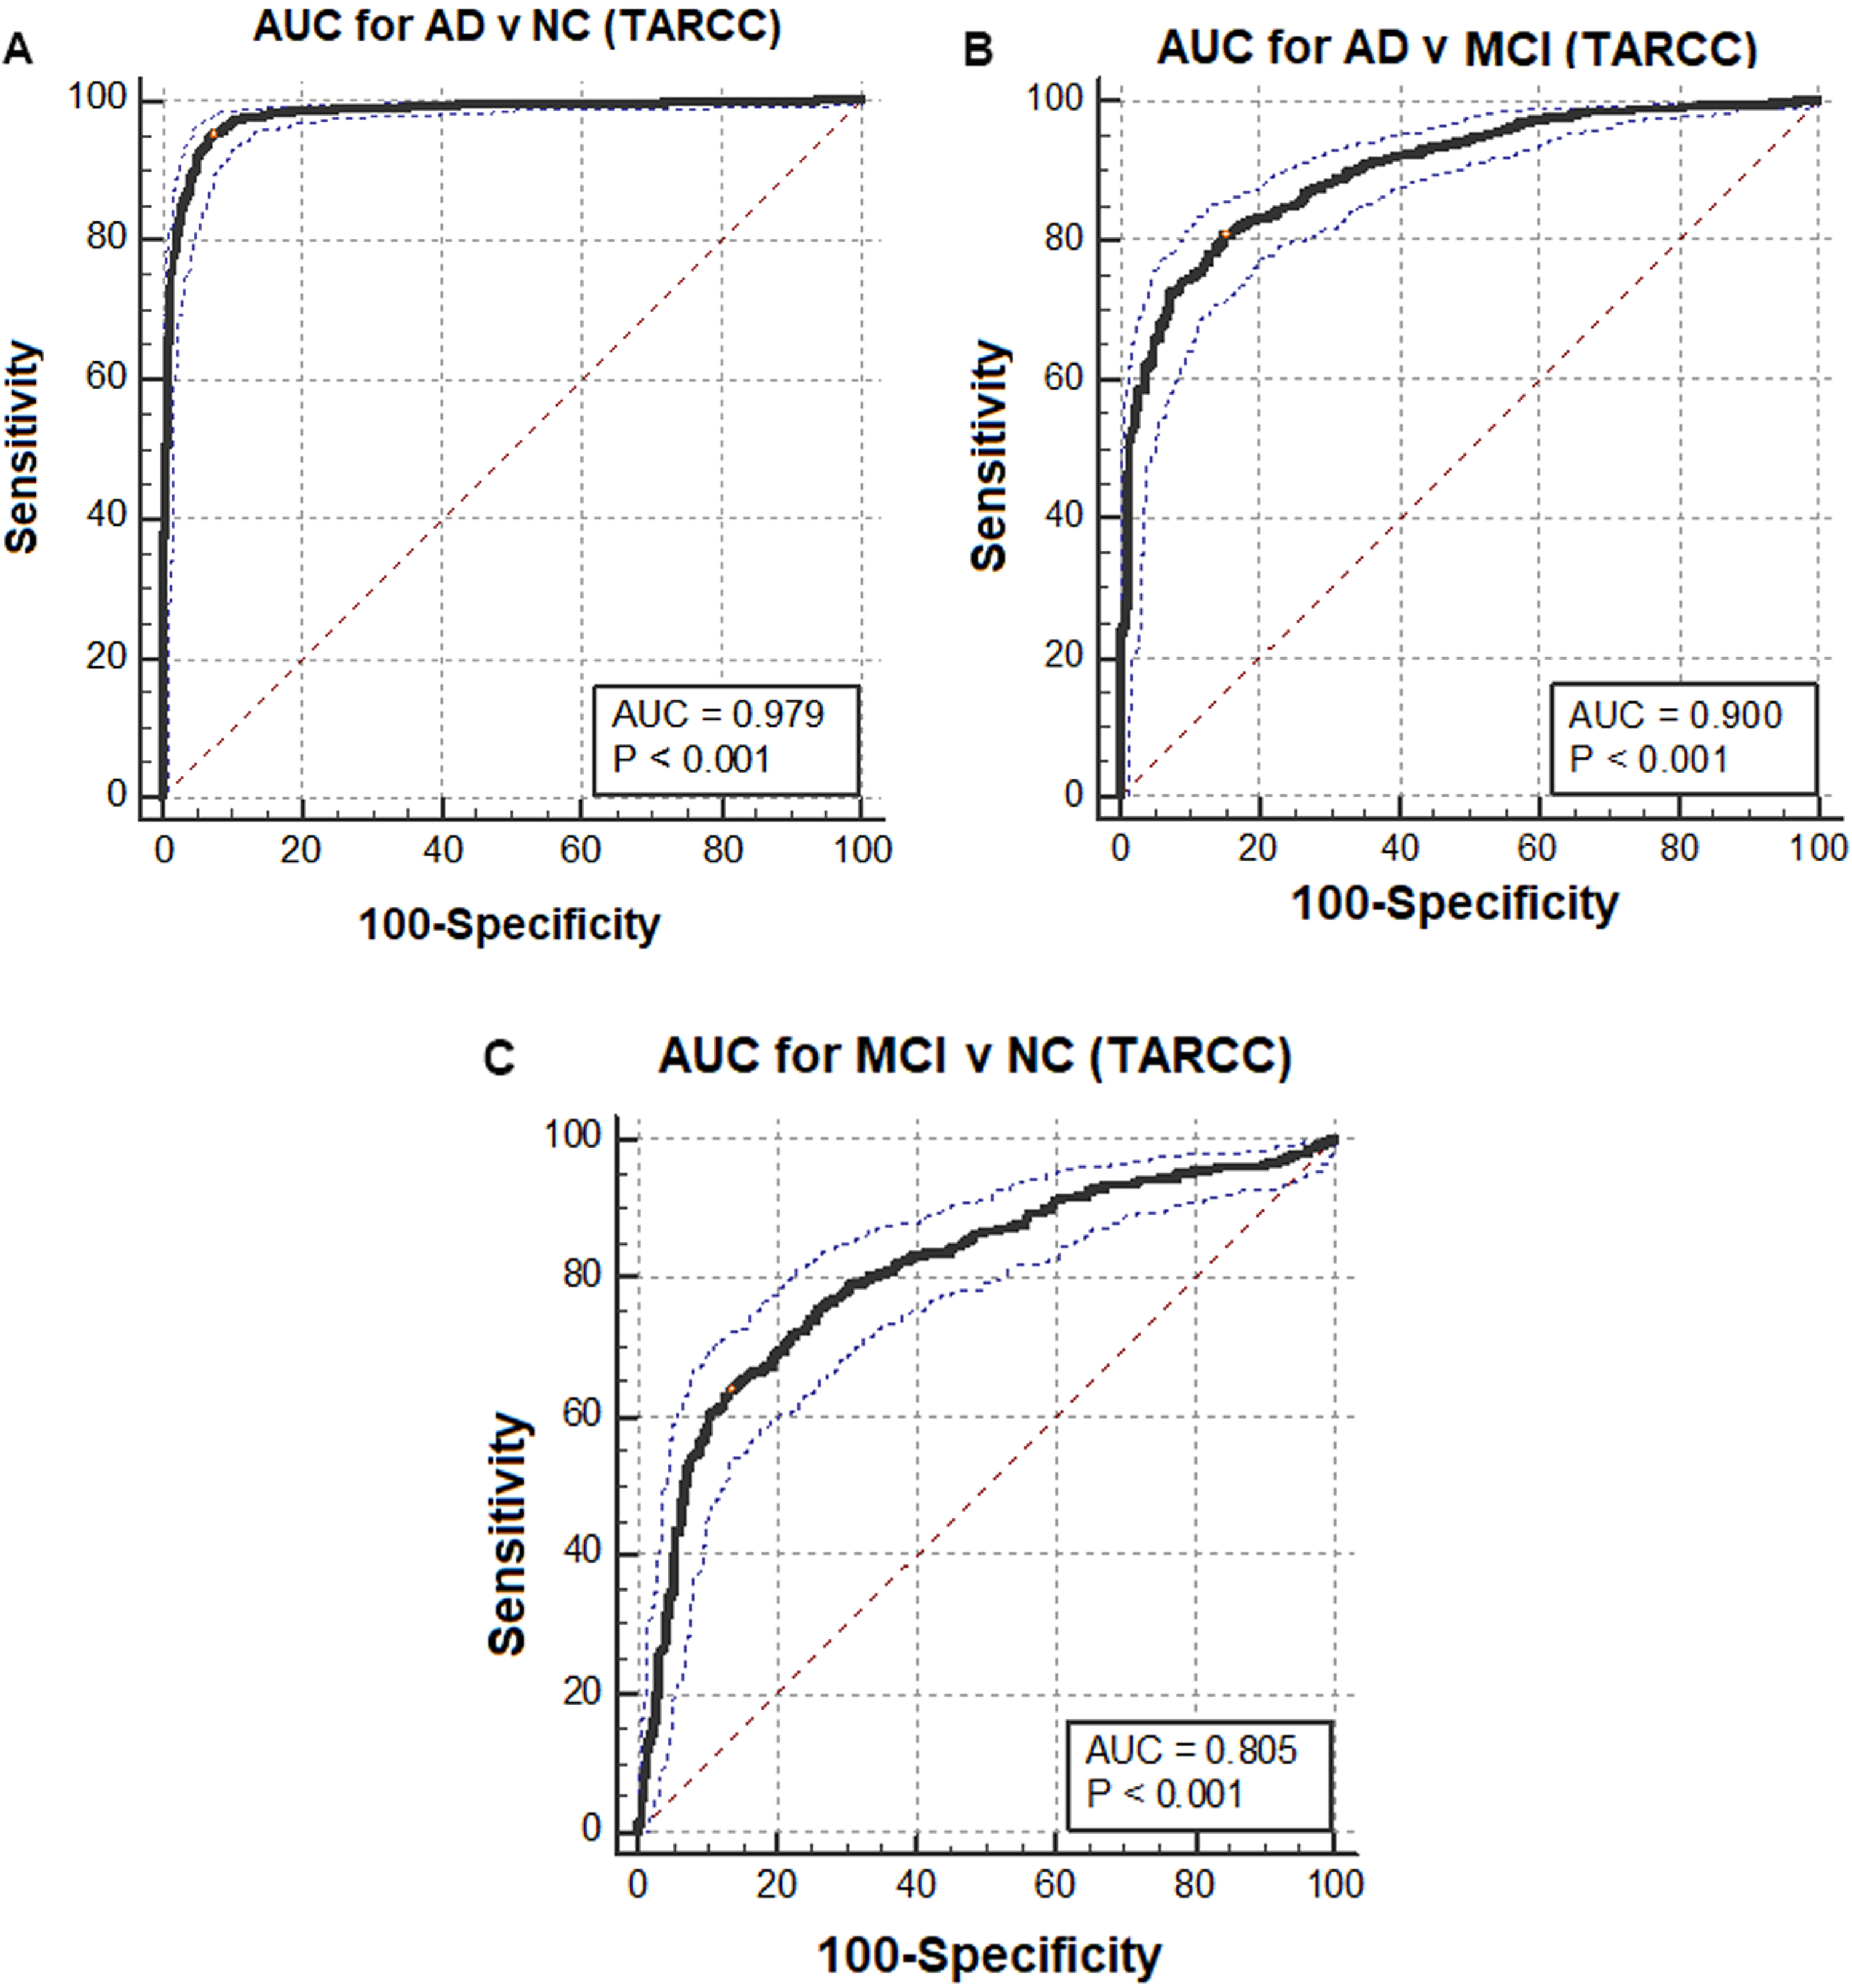
AUCs for Clinical Diagnoses by Adipokines (TARCC NHW /serum). AD, Alzheimer’s disease; ADNI, Alzheimer’s Disease Neuroimaging Initiative; AUC, area under the curve; MCI, mild cognitive impairment; NC, normal controls.
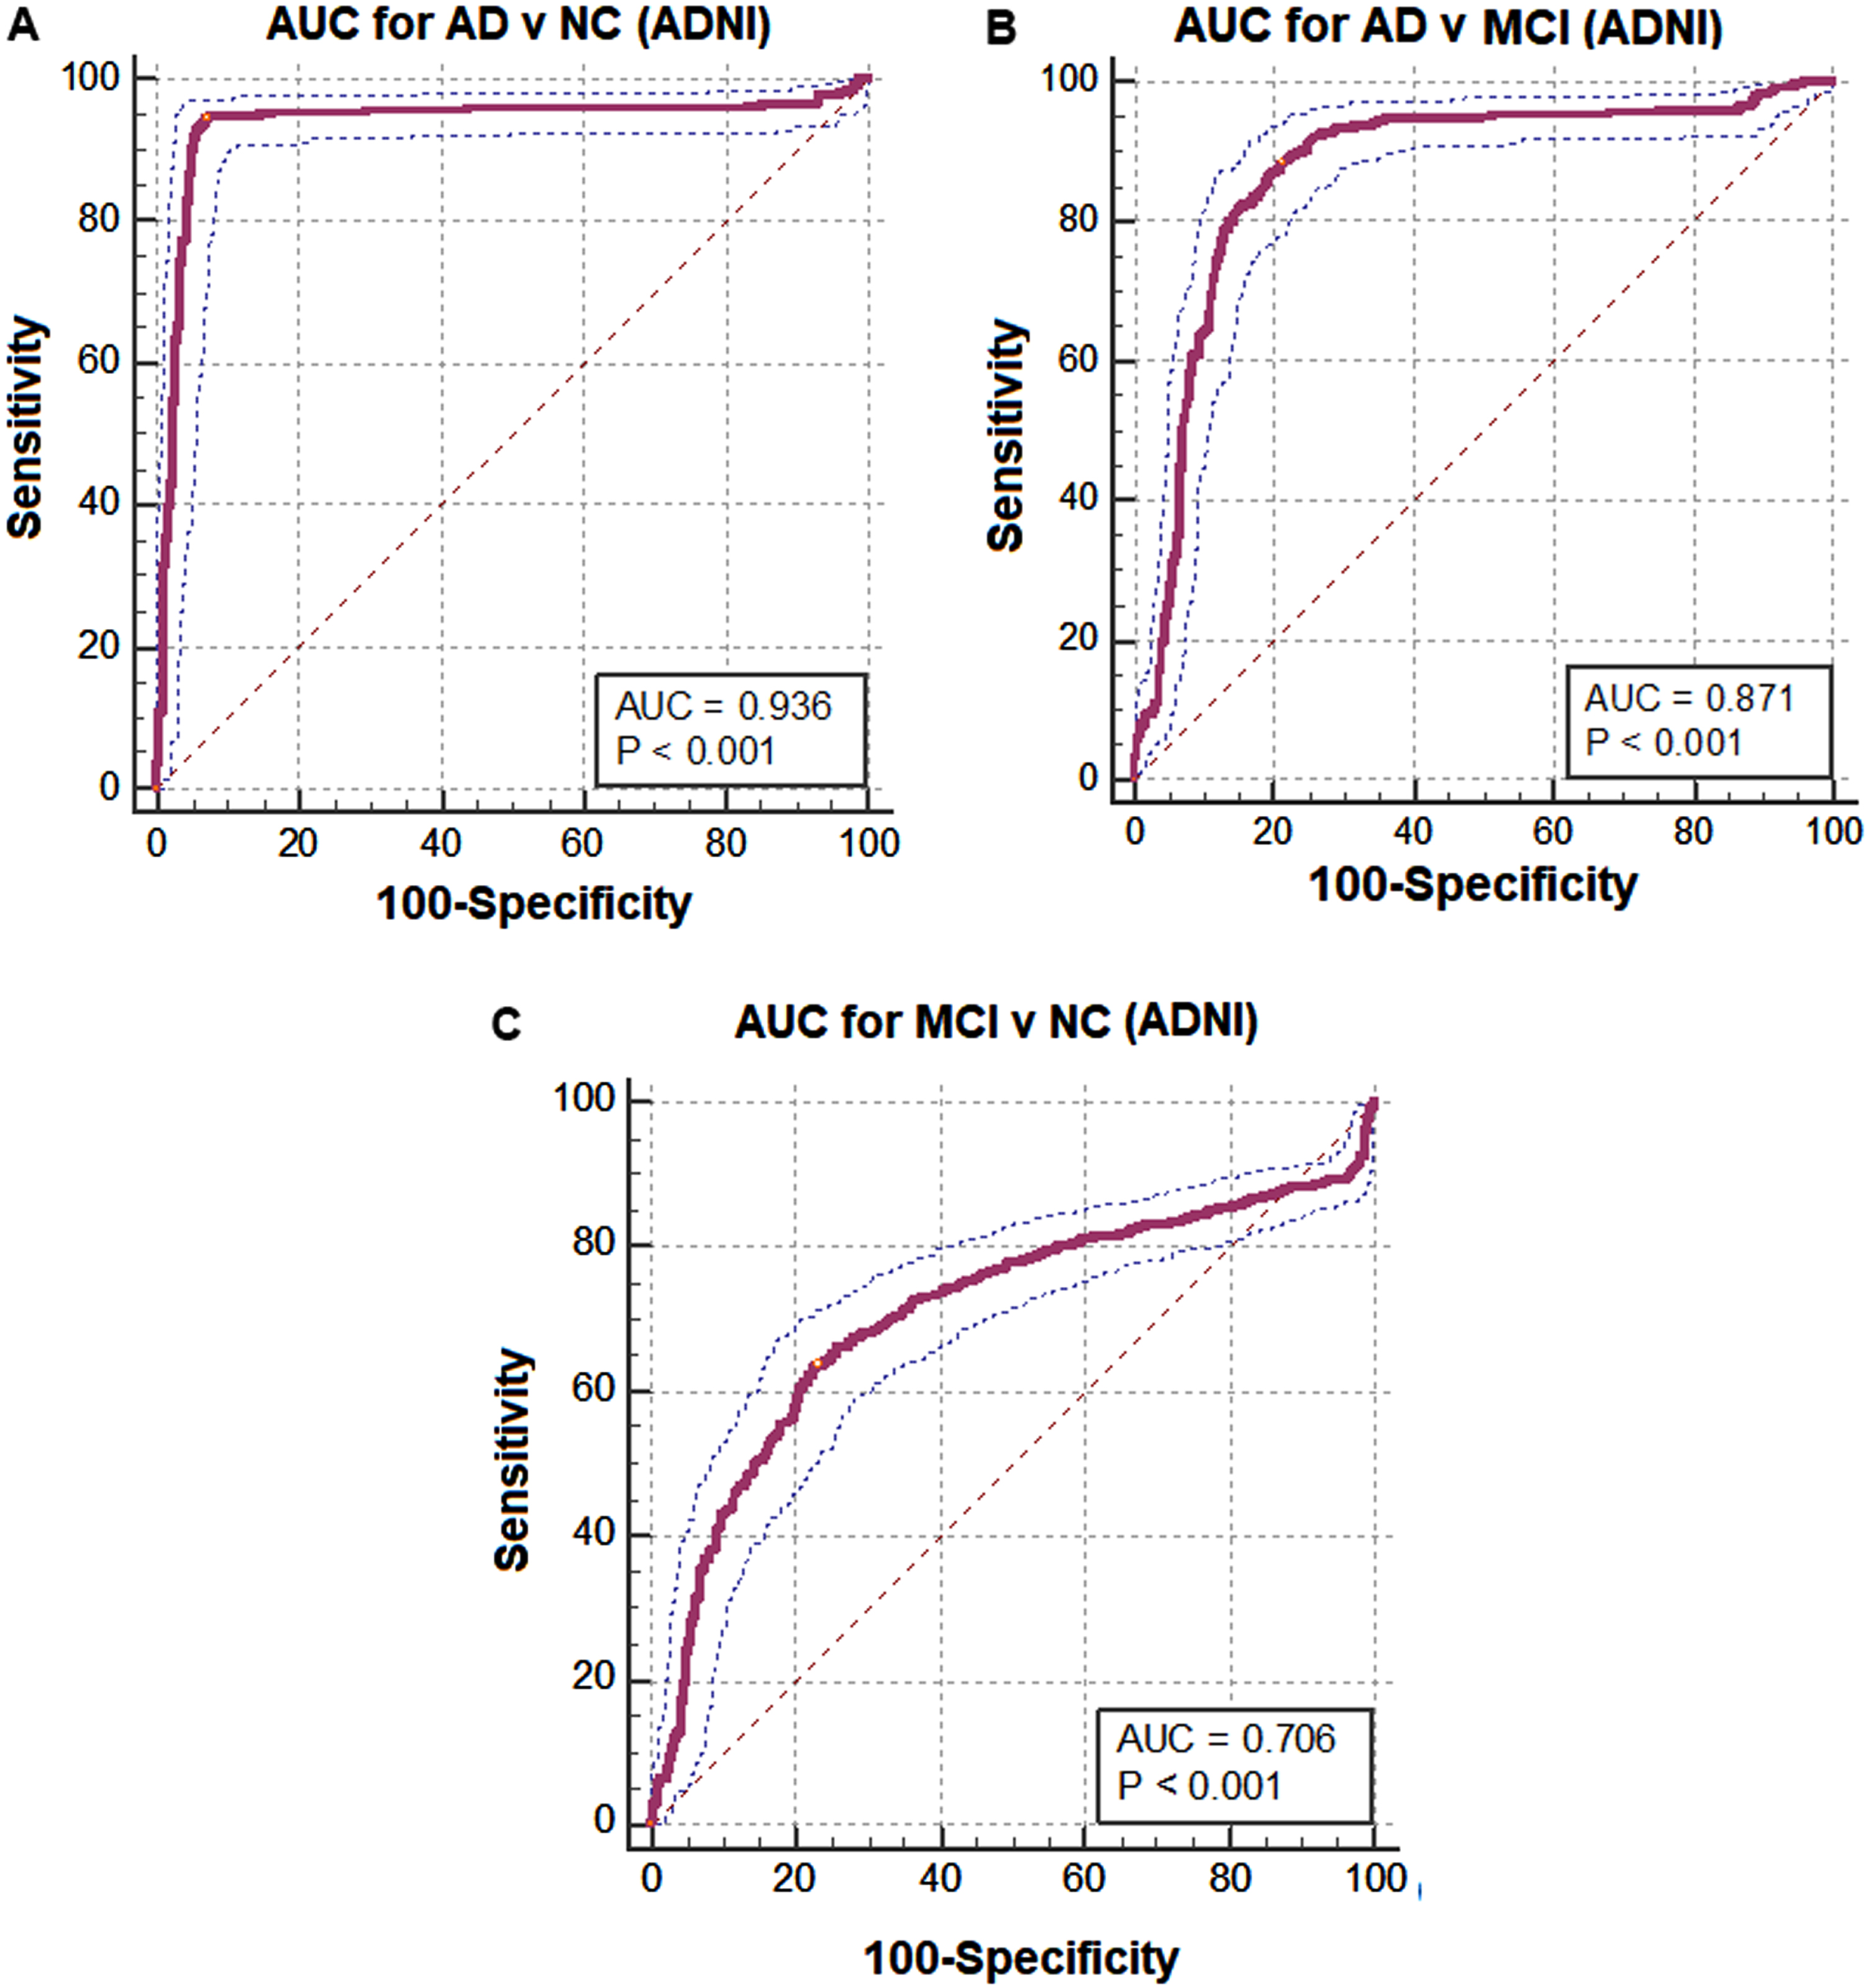
AUCs for Clinical Diagnoses by Adipokines (ADNI /plasma). AD, Alzheimer’s disease; ADNI, Alzheimer’s Disease Neuroimaging Initiative; AUC, area under the curve; MCI, mild cognitive impairment; NC, normal controls.
DISCUSSION
This is our third replication of biomarker findings across these cohorts and biofluids and our second demonstration of latent biomarker constructs as predictors of dementia severity [19, 20]. The advantages of performing this replication by latent factor analyses in SEM are numerous. As latent constructs, Adipokines and dT2A are continuously distributed and relatively free of non-systematic measurement bias. Both characteristics increase our power to detect effects, while the latter also improves our ability to replicate effects across cohorts and biofluids.
Each of the proteins we have considered have been associated with adiposity [21]. Most have been associated with cognitive impairment and clinical AD [8, 41–44]. Observed serum A1-AT, APN, Il-1ra, MCP-1, resistin, TNF-a, and VEGF levels have been specifically associated with δ [5–7, 45]. However, as indicators of a latent variable, these nine proteins share variance which is related to dementia-severity, as measured by dT2A. This suggests that they are acting in concert to achieve their effects, rather than as independent agents of cognitive change. Thus, the latent Adipokines construct may encode the actions of an integrated process or network. The INFLAMMATION construct we recently replicated across these same cohorts by an identical approach [20] was constructed from a set of proteins we had previously associated with δ as independent predictors in regression models [23] but were later found to be linked by their networked genetic associations with IL-10 [46]. It is not clear how the current ad hoc panel of adipokines might be linked, aside from their prior associations with adipose tissue. Regardless, their strong association with dementia severity via a latent construct implies a coordinated effect on cognitive function generally, and on intelligence in particular.
However, over 600 putative “adipokines” have been identified, most of which are not available in TARCC [21]. It is an empirical question whether they all load on a single omnibus “Adipokine” factor or might be arrayed across several competing factors representing subsets of the “adpokinome”. If so, then it also becomes an empirical question how such factors relate to each other, to dementia severity, and/or to other clinical conditions impacting the brain and/or other organs.
Figures 3 4 suggest that the mean Adipokine score rises with dementia severity, whether measured in serum or in plasma. They do not necessarily suggest that any individual adipokine concentrations rise. The proteins’ observed concentrations vary widely across cohorts (because of the case-mix and demographic differences revealed in Table 1), and across biofluids (Tables 2 3). Moreover, they vary in the strength and valence of their individual loadings on the Adipokine construct, depending on the sample and biofluid. Some adipokines load inversely on the Adipokine construct and their levels may fall as the Adipokine construct rises.
Moreover, the Adipokine construct explains but a fraction of the variance of any individual observed biomarker. It is an empirical question whether a biomarker’s residual variance, having been adjusted for Adipokines, is independently associated with dementia severity (i.e., dT2A), with residual variance in δ-adjusted cognitive performance, or possibly even with the clinical effects of Adipokines in other organ systems, if any. Such questions might be approached in SEM through Multiple Mediator Multiple Causes (MIMIC) models [47].
Regardless, the relationships shared by these eight proteins appear stable across cohorts and biofluids. This conclusion is supported by their significant associations with dT2A across cohorts and biofluids, and by their similar ROC findings. Here again, our results should be interpreted cautiously. Plasma APN has been shown to be higher in women with CNS amyloidosis in ADNI [48], while serum APN has been associated with δ in TARCC [5]. However, it remains to be determined how either the Adipokines or the INFLAMMATION construct relate either to each other or to AD-specific neuroimaging or cerebrospinal fluid biomarkers. Nevertheless, these questions are approachable cross-sectionally and longitudinally in ADNI and will be so in TARCC as it is collecting similar biomarkers at present.
A recent meta-analysis has revealed that bariatric surgery has significant effects on the circulating levels of multiple adipokines [49]. APN levels increased, while leptin and PAI-1 levels decreased. Resistin levels were unchanged. This might be consistent with a salutary effect on the Adipokines construct, which is inversely indicated by APN versus Leptin (and PAI-1; DRR unpublished), weakly associated with resistin in ADNI, and insignificantly indicated by resistin (in TARCC).
Regardless, it is interesting that the effects of age, the apolipoprotein E ɛ4 allele, and depressive symptoms are themselves mediated by yet other blood-based biomarkers [6, 45]. Their aggregate ten-fold 5-year prospective MCI conversion risk in TARCC can be completely attenuated by only five serum proteins [10]. This suggests that a large fraction of the variance in dementia severity can be explained by easily acquired blood-based protein biomarkers measured in serum or plasma and offers hope for diagnosis by their assessment and treatment by their modulation.
Because so many adipokines have been identified [21], it is anticipated that the Adipokine classifier may be modified over time to include other blood-based adipokine biomarkers not now available in TARCC and/or ADNI. If so, then the new classifier(s), being indicated by additional proteins, will have to be revalidated as above.
In summary, by SEM we replicate once again the latent interactions of multiple blood-based protein biomarkers across cohorts and biofluids. We can now explain the majority of variance in dementia severity by blood-based protein biomarkers measured in serum or plasma. The mechanisms by which these proteins exert these effects are still unclear. Moreover, as they are acting via a latent construct, their interrelationships may be as important to dementia severity as their observed concentrations, and possibly even more important.
Footnotes
ACKNOWLEDGMENTS
Some data used in preparation of this article were obtained from the Alzheimer’s Disease Neuroimaging Initiative (ADNI) database (http://adni.loni.usc.edu). ADNI had no role in study design, data collection and analysis, decision to publish, or preparation of the manuscript. However, ADNI investigators contributed to the design and implementation of ADNI and/or provided data. A complete listing of ADNI investigators can be found at: ![]() .
.
Some data used in preparation of this article were collected through funding provided to the Texas Alzheimer’s Research and Care Consortium by the Darrell K Royal Texas Alzheimer’s Initiative, directed by the Texas Council on Alzheimer’s Disease and Related Disorders. The funders had no role in study design, data collection and analysis, decision to publish, or preparation of the manuscript.
Texas Alzheimer’s Research and Care Consortium List of Investigators:
Investigators from the Texas Alzheimer’s Research and Care Consortium: Investigators from the Texas Alzheimer’s Research and Care Consortium: Baylor College of Medicine: Valory Pavlik PhD, Paul Massman PhD, Eveleen Darby MA/MS, Monica Rodriguear MA, Aisha Khaleeq Ansari MD; Texas Tech University Health Sciences Center: John C. DeToledo MD, Hemachandra Reddy PhD, Henrick Wilms MD, PhD, Kim Johnson PhD, Victoria Perez; University of North Texas Health Science Center: Thomas Fairchild PhD, Janice Knebl DO, Sid E. O’Bryant PhD, James R. Hall PhD, Leigh Johnson PhD, Robert C. Barber PhD, Douglas Mains DrPH, Lisa Alvarez; University of Texas Southwestern Medical Center: Munro Cullum PhD, Roger Rosenberg MD, Benjamin Williams MD, PhD, Mary Quiceno MD, Joan Reisch PhD, Linda S. Hynan PhD, Ryan Huebinger PhD, Janet Smith, Trung Nguyen MD, PhD; University of Texas Health Science Center –San Antonio: Donald Royall MD, Raymond Palmer PhD, Marsha Polk; Texas A&M University Health Science Center: Alan Stevens PhD, Marcia Ory PhD/MPH; University of Texas at Austin/Dell Medical School: David Paydarfar MD, John Bertelson MD, Martin Woon PhD, Gayle Ayres DO; Alyssa Aguirre LCSW; University of North Carolina: Kirk C. Wilhelmsen MD, PhD, Jeffrey L. Tilson PhD.
FUNDING
The authors received no specific funding for this work. Dr. Royall’s effort is supported by the Julia and Vann Buren Parr endowment for his research in Alzheimer’s disease.
CONFLICT OF INTEREST
Drs. Royall and Palmer have disclosed their co-invention of δ, its homologs and orthologs, and of their Adipokine construct to the University of Texas Health Science Center at San Antonio, which in turn holds a patent relating to the use of a partially overlapping set of δ-related blood-based biomarkers as predictors of Mild Cognitive Impairment (MCI) in non-Hispanic whites (U.S. Patent 13/943,654: “A Serum Biomarker Screen for the Diagnosis of Clinical and Pre-clinical Alzheimer’s Disease in Non-Hispanic Populations”). There are no other patents, products in development or marketed products to declare.
Donald Royall is an Editorial Board Member of this journal but was not involved in the peer-review process nor had access to any information regarding its peer-review.
DATA AVAILABILITY
This is a secondary analysis of deidentified data. TARCC and ADNI data are available to qualified investigators. Requests for ADNI data should be made to http://adni.loni.usc.edu. Requests for TARCC data should be made through ![]() .
.