
Abstract
Background:
Amylin, a pancreatic amyloid peptide involved in energy homeostasis, is increasingly studied in the context of Alzheimer’s disease (AD) etiology. To date, conflicting pathogenic and neuroprotective roles for this peptide and its analogs for AD pathogenesis have been described.
Objective:
Whether the benefits of amylin are associated with peripheral improvement of metabolic tone/function or directly through the activation of central amylin receptors is also unknown and downstream signaling mechanisms of amylin receptors are major objectives of this study.
Methods:
To address these questions more directly we delivered the amylin analog pramlintide systemically (IP), at previously identified therapeutic doses, while centrally (ICV) inhibiting the receptor using an amylin receptor antagonist (AC187), at doses known to impact CNS function.
Results:
Here we show that pramlintide improved cognitive function independently of CNS receptor activation and provide transcriptomic data that highlights potential mechanisms. Furthermore, we show than inhibition of the amylin receptor increased amyloid-beta pathology in female APP/PS1 mice, an effect than was mitigated by peripheral delivery of pramlintide. Through transcriptomic analysis of pramlintide therapy in AD-modeled mice we found sexual dimorphic modulation of neuroprotective mechanisms: oxidative stress protection in females and membrane stability and reduced neuronal excitability markers in males.
Conclusion:
These data suggest an uncoupling of functional and pathology-related events and highlighting a more complex receptor system and pharmacological relationship that must be carefully studied to clarify the role of amylin in CNS function and AD.
INTRODUCTION
Alzheimer’s disease (AD) is a progressive neurodegenerative disease that is clinically characterized by progressive changes in executive cognitive functions resulting from increases in amyloid and tau pathology and neuronal loss [1]. Both genetic and environmental risk factors are linked to late onset AD, a prominent one being type II diabetes mellitus (T2DM).
Approximately 70% of patients who develop type T2DM experience cognitive decline and their risk for developing dementia is 2-fold higher than metabolically healthy controls [2–6]. In addition to cognitive decline, both diseases also display central nervous system (CNS) hypometabolism, increased oxidative stress (OS) levels, neuroinflammation, and share amyloid protein accumulation [3, 7–16]. As such, elucidating the role of metabolic hormone dysregulation in the context of T2DM and AD is essential to understanding associations and the potential causal relationships between these two diseases.
The metabolic hormone, amylin, is an amyloid protein produced by pancreatic β-cells and co-released with insulin. Amylin has historically been studied as gluco-regulatory peptide and, similar to insulin, becomes dysregulated during T2DM [17, 18]. Amylin has a dualistic role in metabolic augmentation. In the periphery, post-prandial amylin release improves glucose utilization by inhibiting glucagon section and slowing gastric emptying. Amylin also readily crosses the blood-brain barrier (BBB) [3, 4] to signal independently in regions of the CNS such as the area postrema, to drive mechanisms of satiation [5–7]. Amylin signaling in the CNS also potentiates other metabolic hormone signaling within the hypothalamus including leptin and pro-opiomelanocortin (POMC) to regulate long-term energy storage, expenditure, and body weight [8].
More recently, amylin and amylin analogs like pramlintide (PRAM) have been linked to several CNS processes and diseases, most notably with cognition and AD pathogenesis [9–23]. These findings are supported by the fact that amylin receptor (AMYR) components are expressed throughout the CNS, more specifically, in areas relevant to cognition and AD pathogenesis [6, 24–33]. Our group, as well as others, have shown that plasma amylin levels positively correlate with cognition and negatively correlate with AD pathologies [10, 34]. Furthermore, pharmacological studies utilizing animal models further support a functional role of amylin signaling in AD [15, 35–38]. Several mechanisms including the ability of this peptide to regulate OS [11], inflammation [17], and amyloid-β (Aβ) processing [11, 18] have been suggested as the physiological mediators of functional improvements in AD animal models. However, these findings have been contradicted by other reports suggesting that AMYR antagonism by receptor inhibitors or receptor sub-component depletion, rather than agonism using amylin or pramlintide, provides therapeutic benefits in AD [35, 39–42]. This highlights a crucial need for a more complete mechanistic understanding of amylin receptor dynamics in the CNS.
We and others have previously demonstrated that peripheral administration of pramlintide confers therapeutic benefit in rodent models of AD; however, it is unclear if this benefit arises from pramlintide’s effects in peripheral function (i.e., metabolic tone), direct binding to CNS receptors, or both. As such, this study sought to determine whether the therapeutic effects of peripheral pramlintide administration is mediated centrally by blocking the receptor within the brain. Additionally, given the disparity in the literature, here we also sought to determine whether pharmacological antagonism of the AMYR in the CNS would result in benefits or pathogenesis in the absence and presence of pramlintide.
MATERIALS AND METHODS
Animals
APP/PS1 double knock-in transgenic mice (B6.Cg-Tg APPswe,PSEN1dE985Dbo/J, Jackson Laboratories) of both sexes and were bred and housed in accordance with the Kent State University Institutional Animal Care and Use Committee (IACUC) protocol approval number: 433-GS-16-23. Mice were group housed under a 12-h light-dark cycle. Weight (grams) was measured weekly to monitor health and effects of our treatments. Study treatments began at 5.5 months of age, a timepoint that precedes major plaque deposition and cognitive deficits in this model and concluded at 7.5 months of age. A wild-type littermate control group of a similar age was used to determine magnitude of effect of our pharmacological treatments in APP/PS1 mice.
This study has been approved by Kent State University’s Institutional Animal Care and Use Committee (IACUC).
Treatments
APP/PS1 mice (Tg) were randomly assigned to four treatment groups: 1) a control group (Tg-Sal) receiving saline subcutaneously and artificial CSF (aCSF) via intraventricular cannulation (ICV), 2) a group in which the amylin receptor antagonist AC187 was centrally delivered ICV along with saline delivered subcutaneously (Tg-Sal+AC187), 3) a group that received PRAM subcutaneously as previously described [28], with ICV delivery of aCSF (Tg-PRAM), and, lastly, 4) a group that received AC187 centrally and PRAM delivered subcutaneously (Tg-PRAM+AC187).
PRAM was delivered using a subcutaneous osmotic pump (Alzet, model 1004) delivering a concentration of 2.27 mg/ml pramlintide acetate (AnaSpec) dissolved in saline at a rate of 0.11μl/h. This resulted in a daily dose of 6μg/day. AC187 (Abcam) was dissolved in aCSF at a concentration of 2.63 mg/ml and also delivered at a rate of 0.11μl/h. This resulted in a daily dose of 6.94μg/day. These doses were chosen based on previous data demonstrating effectiveness within the CNS [10, 43]. Control groups received aCSF and saline at the same rate and volume as the drugs being delivered. Experimental timeline is represented in Fig. 1.
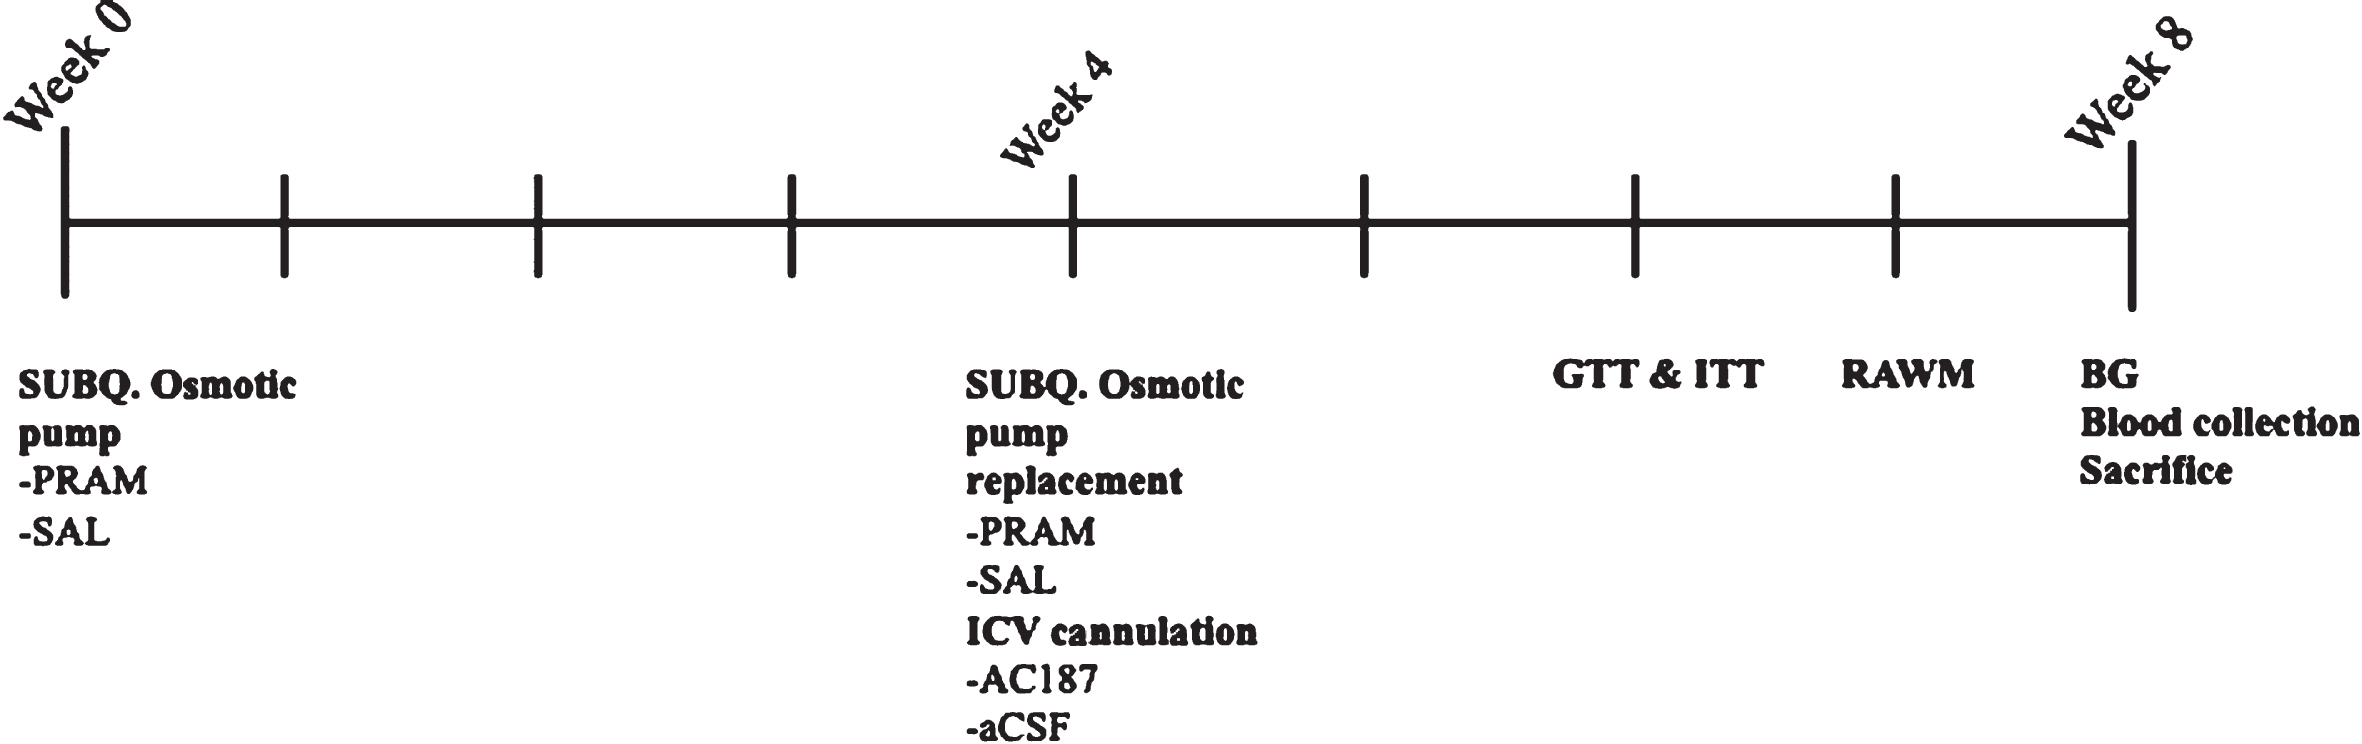
Experimental timeline. Experimental timeline over 8 weeks. Week 0 is start of treatment with 28-day Alzet subcutaneous osmotic pump placement with either saline or pramlintide acetate. At week 4 original subcutaneous osmotic pump was removed and replaced with a second 28-day pump. Mice were additionally fitted with an ICV cannula into the right lateral ventricle attached to catheter tubing that was connected to a second subcutaneous osmotic that delivered aCSF or AC187. During week 6 glucose tolerance testing (GTT) and insulin tolerance testing (ITT) were performed three days apart. Week 7 Radial Arm Water Maze was performed. Week 8, fasted blood glucose levels (BG) and cardiac blood was collected at the time of sacrifice and brain tissue collection.
Surgeries
All mice in the study underwent general anesthesia (4% isoflurane) and placement of subcutaneous 28-day release osmotic pump. Osmotic pumps were replaced once during the duration of the study at day 26 to prevent gaps in treatment as described in [28]. During pump replacement, all animals were also fitted with an ICV cannula separate osmotic pump system containing either aCSF or AC187 (Brain Infusion Kit 3, Alzet). Briefly, animals were placed in a standard stereotaxic apparatus and the cannula was implanted into the right lateral ventricle, using coordinates: λ ≤ 0.05mm, AP -0.05 mm, ML -0.11 mm, and DV -0.25 mm relative to bregma. The cannula was then secured with dental cement (A-M Systems) and Vetbond (Alzet). All mice were monitored daily post-operation for the remainder of the study. Correct cannula placement and functionality was tested immediately prior to sacrifice by injecting fastgreen dye solution into the line and determining coloration of the ventricle at the brain collection stage.
Behavioral testing
Radial Arm Water Maze (RAWM)
Spatial memory was tested using RAWM, a task shown to detect cognitive changes in the AD mouse model used in this study [44]. Briefly, mice were subjected to a 120 cm pool containing six hallways with an escape platform located in the middle of one of the arms. Mice performed fifteen 60-s trials per day over two days. On day 1, trials were alternated between hidden/visible platform to facilitate procedural learning. On day 2, all trials were carried out using a hidden platform. All mice were randomly assigned a goal arm, where the platform remained in a fixed location throughout all 30 trials for each particular animal. Start location was randomly assigned per animal per trial and did not include the goal arm. Distal landmarks were strategically placed on walls of the room and served as spatial cues. Escape latency (seconds) as well as number of errors committed were quantified as decedent variables. Errors were defined as: 1) an entry into an arm that did not contain the platform or 2) staying in any one arm for more than 15 seconds as described in [44]. The last 3 trials (trials 13-15) of day 1 and day 2 were all hidden trials and were designated as probe trials. This allowed for a direct comparison of Day 1 to Day 2 errors. This relationship was converted into a ‘learn score’ (day 2 probe trial errors/day 1 probe trial errors) to measure the improvement in probe trials between day 1 and day 2. Mice (n = 3) who circled or floated and did not reach the platform during the 60 sec trial for more than half of the trials on Day 1 were excluded from analysis. Two mice drowned during testing and all trials were excluded.
Light/Dark Box
Anxiety phenotypes was measured with the Light/Dark Box paradigm. After acquisition to a dark room, mice were placed in the corner of brightly lit box with access to a dark side of the box for a trial of 5 min. Latency to first cross to the darker side, as well as number of crosses and calculated time in light was used to determine anxiety among groups. Mice were excluded from analysis if they did not cross to the dark side of the chamber.
Metabolic measurements
A number of metabolic metrics were monitored throughout the duration of the study. All metabolic metrics were collected after 4-5 h of fasting on the day of sacrifice.
Blood glucose
Terminal blood glucose was measured using a glucometer (Contour Next) from the tail vein prior to anesthetization.
Serum insulin
Terminal blood collection was only collected for a subset of mice at the endpoint of the study. Approximately 300μl of blood was collected using a lancet via the mandibular vein in tubes containing several protein inhibitors (dipeptidyl peptidase IV inhibitors (DPPIV) 1 : 100 and Protease Inhibitor Cocktail (PIC) 1 : 100) to prevent the degradation of proteins of interest. Blood was allowed to clot for ∼30 min at room temperature and then spun down at 2,000 x g for 10 min at 4°C. Serum was then removed and stored at 20°C until later use. Insulin levels were detected using an Ultrasensitive Mouse Insulin ELISA kit (Alpco) according to manufactures protocol, using 5μL of serum in duplicate.
Glucose and insulin tolerance testing (GTT & ITT)
Tests were conducted during the dark cycle (20 : 00–22 : 00) in order to test metabolism when rodent are in their active phase [45]. GTT and ITT was performed at 7 months of age, one week prior to behavioral testing.
GTT
Body weights and a baseline blood glucose measurement were taken prior to a standard glucose bolus (t0). A standard dose of 50 mg D-glucose in sterile 0.89% saline was delivered intraperitoneally (IP) to all animals based on an average mouse body weight of 25 g [46, 47]. Blood glucose was monitored at 0, 15, 30, 45, 60, and 90-min post IP injection as described above. Baseline corrected area under the curve was calculated to represent blood glucose over time in order to depict the animals’ ability to process a glucose incursion.
ITT
Insulin (Sigma-Aldrich) was administered at a dose of 0.50 U/kg via IP injection and blood glucose levels were monitored at 0, 20, 40, 60, and 80 min post injection. A weight dependent dose of insulin was chosen rather than a standard dose based on a standard 25 g mouse to minimize insulin shock [46, 49]. Mice whose blood glucose dropped below 45 mg/dL were immediately injected with 0.250 ml of 20% glucose to prevent the induction of hypoglycemic seizures and were excluded from further analysis. Corrected area under the curve was calculated per group.
Tissue collection
All animals were deeply anesthetized and quickly decapitated. One hemisphere was dissected and snap frozen for soluble Aβ42 or a smaller cohort for real-time RT PCR measures. The other hemisphere was dissected and immediately homogenized in a 1X cell lysis buffer (Cell Signaling) containing 1 : 200 DTT (ThermoFisher), 1 : 100 PMSF (Cell Signaling), 1 : 50 phosphatase inhibitor cocktail (Millipore-Sigma) and 1 : 200 protease inhibitor cocktail set III (Millipore-Sigma). Tissue was then spun down and supernatant was collected for Western blot protein analysis. Additional hippocampi were removed from an additional cohort of animals and processed for RNA sequencing.
Western blotting
Western blot analysis was carried out as previously described in [50]. Briefly, sodium dodecyl sulfate-polyacrylamide gel electrophoresis (SDS-PAGE) using 8–12% tris-tricine or tris-glycine gels were utilized to separate proteins from hippocampus and hypothalamus of mice from all treatment groups (15–30μg of protein). Separated proteins were then transferred to PVDF membranes and probed using primary antibodies to detect protein changes in 1) metabolic proteins and receptors known to interact with amylin (POMC, LepR), 2) amylin receptor components (RAMPS, CalcR), 3) signaling molecules associated with AMYR activation or amylin signaling interactions (glycogen synthase kinase-3β (GSK-3β), STAT3), and 4) Aβ processing (CTF-α and CTF-β, cleaved notch [γ-secretase], Arc) (Table 1). After primary antibody incubation, all membranes were incubated with corresponding secondary antibodies diluted in 1X TBS-T for 1 h at room temperature and developed using HRP Substrate ECL (Millipore-Sigma). Protein expression was visualized and captured using an imaging system (syngene) and image optical densities (OD) quantified using NIH Image J software. β-actin or GAPDH were used as loading controls.
Primary and secondary antibodies used in hippocampal and cortex tissue
Amyloid-β measurements
Dissected hippocampus and cortex was serially fractionated to isolate three separate forms of Aβ: 1) an aqueous soluble fraction, homogenized in 1X PBS, 2) a membrane-bound fraction, homogenized and separated using SDS, and 3) an insoluble fraction, collected by sonicating the final insoluble pellet in formic acid (FA) as described in [51, 52]. Briefly, hippocampal and temporal cortex tissue were homogenized in PBS with protease inhibitor cocktail at 200 mg/ml and then spun down at 20,800 x g for 30 min. This supernatant was collected and used to determine PBS-soluble Aβ content. The pellet was sonicated for 5 pulses at 0.5 s at 100 W in 2% SDS and again spun down as described above. The collected supernatant was then used to determine SDS-soluble Aβ levels. Lastly, the remaining pellet was re-suspended in 70% formic acid in 25 mM Tris, incubated for 3 h at room temperature on an orbital shaker and spun down at 16,000 x g for 20 min. The collected supernatant was used to determine insoluble Aβ content.
Total Aβ42 was measured in each of the three Aβ fractions using human ELISA (Invitrogen) via manufacturer’s protocol. Sample dilution optimization for each fraction resulted in all PBS-soluble samples being diluted 1 : 10, SDS-soluble samples 1 : 200, and FA-soluble fractions at 1 : 50 ratios in each respective buffer. All samples were run in duplicate and read at 450 nm using a microplate reader. Samples were excluded if they did not register an output within the standard curve. Total Aβ42 was expressed as pg per μg of total protein. Total protein was quantified from the sample via BCA assay (Pierce). Group means per fraction were calculated and statistical outliers were removed.
Real time RT-PCR
RNA was extracted from whole hippocampi or hypothalamus using the RNeasy mini kit (Qiagen, Germany) following the manufacturer’s protocol in a smaller subset of mice. Concentrations and purity of isolated RNA were measured via Nanodrop. 1 μg of RNA was converted to cDNA using the High-Capacity cDNA Reverse Transcriptase Kit (ThermoFisher). Gene expression was measured using quantitative PCR. All samples were run in duplicate using 10 ng cDNA per reaction via primers from TaqMan gene expression assays (Life Technologies, CA): mouse RAMP1 (Mm00489796_m1), RAMP3 (Mm00840142_m1), CalcR (Mm00432282_m1), LepR (Mm00440181_m1), POMC (Mm07294099_m1), and Arc (Mm00479619_g1). All genes of interest were normalized to Rn18 S (Mm03928990_g1). Fold change (RQ) was calculated relative to APP/PS1 control group.
RNA sequencing
Hippocampi from an additional cohort of mice that included non-treated APP/PS1, wild-type littermates, and APP/PS1 mice treated with PRAM subcutaneously (n = 3/sex/group) were collected and sent out for RNA sequencing to determine effects of PRAM on the transcriptome. All animals received the identical peripheral osmotic pump treatments without ICV cannulations. 1μg of RNA was sent to the Case Western Reserve Genomics Core for RNA-sequencing. RNA quality was analyzed using QuBit and only samples that yielded a RIN score of≥8.5 were used to make RNA libraries and later used for sequencing. Transcriptomes were sequenced using Illumina NextSeq with 75 bp single-end reads at a sequencing depth of ∼40 million reads on average per sample. FASTQ files containing raw transcripts were mapped to the mouse genome using HISAT2 [53], and gene expression counts were collected using Stringtie in transcripts per million (TPM) [54], using AIDD pipeline [55]. Raw counts were analyzed with DeSeq2 [56] using a false discovery rate (FDR) correction cut-off of p value padj = 0.1, a criterion chosen to capture a broader set of differentially expressed genes (DEGs) within our comparison of interest (APP/PS1 versus APP/PS1 + PRAM). All comparisons were carried out separated by sex to address sex differences in treatment. We further narrowed down the list of candidate DEGs by setting padj value to a stricter 0.05 cut-off, together with a fold change (FC) cut-off of 1.5, a FC suggested to be biologically relevant [57, 58].
Gene expression analysis
To visualize the difference in expression of specific genes, the TPMs from each mouse from the top 25 DEGS based on the cut-off p-value between PRAM control treated transgenic mice were plotted for hierarchical clustering analysis using Heatmapper.com. Hierarchical clustering of samples using a heatmap represents the clustering of 18 (n = 6/sex) mice used in this study (WT: n = 3, AD: n = 3; AD+PRAM: n = 3) based on their differential gene TPM expression (z-values) of the top 25 DEGs altered by PRAM compared to APP/PS1 controls. The color scale shows transcripts that are upregulated (yellow) or downregulated (blue) relative to the mean expression of all samples.
Functional gene analysis/topology
The interactions of the DEGs, with p value of 0.1, the density of the network nodes is based on string confidence score > 0.7, were selected as significant, and DEGs with a connection number < 2 were eliminated within STRING [59]. The Protein-Protein Interaction (PPI) network was visualized using GeneMANIA in Cytoscape (https://cytoscape.org/; version 3.6.8). Nodes with degree, closeness, and intermediation scores higher than the mean, calculated by the Cytoscape with CHAT and Centiscape plug-in, were considered hub nodes [60, 61]. The interactome analysis was carried out separately for male and female mice. The parameters for the input data in both cases were the following: the results of DEGs with an adjusted p-value of 0.1 and 0.05 were taken, for each comparison in both sexes, with the predetermined confidence score of 0.7. Grey nodes are the interacting neighbor genes with DEGs included in analysis by GeneMANIA in Cytoscape. Edges with high confidence scores are represented as thicker in width. For the analysis of the clusters, we use an inflation value of 2.0, to reduce the size of the clusters. The hubs of the networks were determined by Gentiscape and CHATapp in Cytoscape.
To better identify and verify the molecular functions and biological processes of the identified proteins, we define the potential biological significance of the interactions an GO term enrichment was performed, using GO-TermFinder (https://go.princeton.edu/cgi-bin/GOTermFinder), Metascape, a gene analysis and annotation resource (https://metascape.org/gp/index.html) and is displayed in REViGO (http://revigo.irb.hr/) for the elimination of redundant terms, only significant hits with a p-value ≤0.01 [62]. For the GO analysis of the Hub genes, the WEB-based Gene SeT AnaLysis Toolkit (http://www.webgestalt.org/; 2017 revision) was used for the functional enrichment analysis, which covers seven biological contexts, including GO and the rate [63]. FDR was set to < 0.05 to perform the GO analysis of the DEGs [64].
Statistical analysis
All behavioral and metabolic endpoint studies were blinded to the experimenter. Sex differences were addressed by powering the study to be able to detect differences in both males and female mice independently. However, to maximize our ability to detect differences a student’s t-test was first performed to evaluate if a sex difference was present. If there were no statistical differences between males and females (regardless of treatment group), data were pooled and analyzed accordingly. Upon verification of normality, statistical outliers were determined within SPSS analysis and removed where necessary. Group differences were then detected by parametric analysis using Welch or Brown-Forsythe One-way analysis of variance (ANOVA). These ANOVA tests were chosen because of uneven n numbers between treatment groups and/or unequal variance in some cases. Tukey or LSD post-hoc tests were use when the data passed the homogeneity of variance assumption. If this assumption was not met, Games-Howell post-hoc analysis was used to report differences between groups.
RESULTS
Treatment effects on peripheral metabolic endpoints
Our treatments have been shown to have dose-dependent effects on metabolic endpoints (i.e., glucose and insulin) that can impact cognition and signaling measurements studied [65]. Therefore, to address whether the reported effects of PRAM could be associated with alterations in metabolic changes or rather were independent of such changes we determined whether our treatments impacted weight, changes in fasting insulin and glucose levels, as well as differences in insulin and glucose sensitivity. To this end, while expected, significant sex differences were revealed for body weight (t = 8.91, p < 0.01), fasted serum insulin (t = 2.43, p = 0.02) and fasted blood glucose (t = 3.40, p < 0.01), ANOVA analysis did not reveal any treatment differences on body weight, fasting insulin or blood glucose levels or GTT or ITT (Supplementary Figure 1A-E). Overall, there were ten mice (predominately female mice) whose blood glucose levels dropped too low during ITT, thus were taken out of analysis completely. Within the serum insulin cohort, two ranges were outside of the ELISA standard curve (M Tg-Sal and F Tg-PRAM) and there were two statistical outliers (M Tg-Sal and M Tg-PRAM+AC187).
Treatment effects on cognitive function
One of the main questions of this study was to address whether the cognitive benefits associated with peripheral delivery of amylin (PRAM) in AD mouse models involved CNS AMYR activation or, rather, its effects were mediated through peptide ability to modulate other peripheral or central metabolic signaling markers associated with cognition/AD-related endpoints; these include insulin or leptin. Overall differences in training were not detected for genotype or treatment groups. We were able to identify genotype differences in young APP/PS1 mice (7.5 months) compared to WT controls (t = 2.402, p = 0.02), confirming a genotypic deficit in cognitive performance (Supplementary Figure 2). Moreover, differences were detected for probe trial blocks across treatment groups. To normalize differences to baseline (Day 1 probe) a learning score was created (Day 2 probe/Day 1 probe). Using this score, we were able to identify genotype differences in APP/PS1 mice (7.5 months) compared to WT controls (t = 2.402, p = 0.02). Using this learning score, treatment group differences within APP/PS1 mice were also evident by one way-ANOVA (F = 3.56, p = 0.03). Due to unequal variances, the more conservative Games-Howell post-hoc analysis was performed and did not reveal significant differences between APP/PS1 controls and PRAM treated mice. However, a statistically significant difference was noted between PRAM and saline treated animals centrally infused with AC187 antagonist (p = 0.05). The latter performed similarly to the APP/PS1 control mice (Fig. 2), albeit with less variability. Additionally, although Tg mice who received PRAM and central AC187 antagonist performed similarly to those that received PRAM alone and better than APP/PS1 saline controls and central AC187-only treated groups, these differences did not reach statistical significance. Of note, two statistical outliers were noted (one in the Tg-Sal and one in the Tg-PRAM groups).
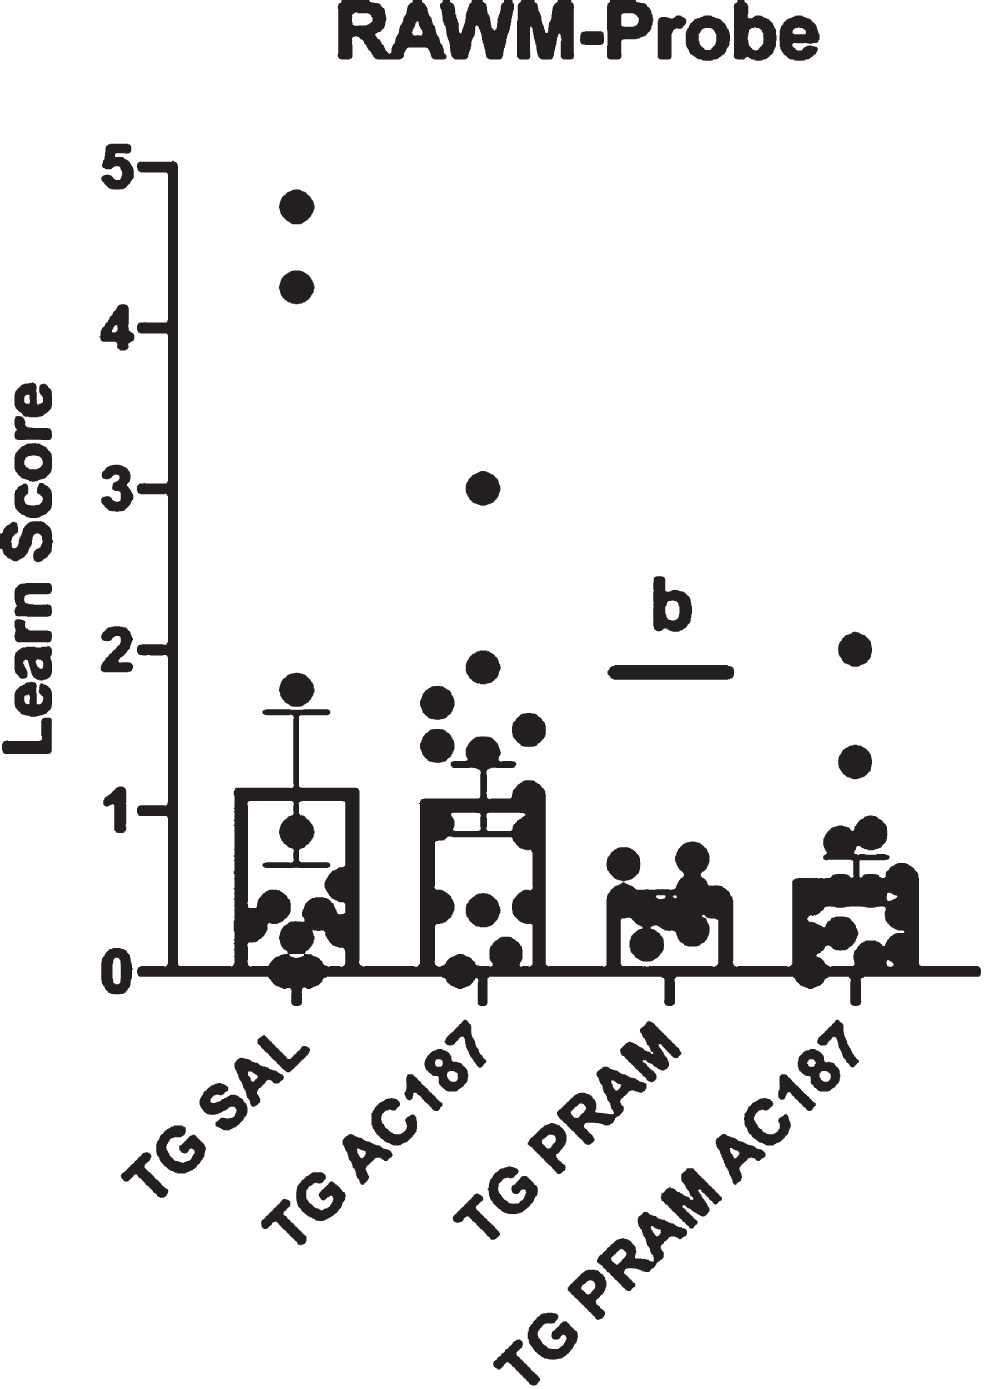
Spatial behavior. Day 2/Day 1 committed errors during probe trials was calculated to create a learn score for Tg-Sal (n = 12), Tg-Sal+AC187 (n = 14), Tg-PRAM (n = 9) and Tg-PRAM+AC187 (n = 14) mice. Significance is represented as bp < 0.05 compared to Tg-Sal+AC187.
We did not detect any differences amongst drug delivery on anxiety measurements within the Light/Dark Box paradigm suggesting differences in RAWM were not due to anxiety or hyperactive phenotypes (Supplementary Figure 2). Two mice who did not cross threshold under cutoff and were removed from analysis and two statistical outliers were noted.
Treatment effects on amyloid-beta pathology
In order to determine if CNS AMYR is involved in mediating PRAM reductions in Aβ pathology, we determined levels of soluble Aβ42 species in the cortex and hippocampi of all our treatment groups. Male versus female comparisons revealed sex-differences in cortical PBS (t = 2.252, p = 0.03), SDS (t = 1.807, p = 0.07), and formic acid (t = 3.163, p = 0.03) fractions, and hippocampal PBS (t = 2.258, p = 0.03), SDS (t = 3.891, p < 0.01) and formic acid (t = 2.352, p = 0.03) fractions. Therefore, sexes were analyzed separately.
A one-way ANOVA revealed no treatment differences in Aβ42 across treatments in male mice in either hippocampus or cortex (Supplementary Figure 3). In females, there were no differences in SDS-soluble fractions in hippocampus or cortex (data not shown). However, PBS and FA soluble fractions were differentially altered by treatments across structures. To this end, in the hippocampus PBS-soluble Aβ42 was significantly altered by treatment (F = 4.6, p = 0.04). Post-hoc analysis revealed a strong but non significant reduction in PBS Aβ42 in PRAM treated mice compared to saline treated controls (p = 0.09), and saline treated animals under central AC187 antagonism (Tg-Sal+AC187) (p = 0.07) (Fig. 3A). In cortex, PBS Aβ42 did not show significant differences, however, FA soluble Aβ42 was significantly altered across treatment groups (F = 6.70, p = 0.03). Post-hoc analysis revealed that central inhibition of AMYR (Tg-Sal+AC187) significantly increased Aβ42 FA soluble levels compared to controls (Tg+SAL) (p < 0.01), PRAM treated (p < 0.01), and PRAM+AC187 treated animals (p = 0.02) (Fig. 3D). In this analysis, three outliers were noted and removed (HIPP PBS: Tg-Sal+AC187 (n = 1); FA: Tg-Sal+AC187 (n = 1); HIPP FA: Tg-PRAM (n = 1)) for females and three for males (CTX FA: Tg-PRAM (n = 1) and HIPP FA: Tg-Sal+AC187 (n = 2)).
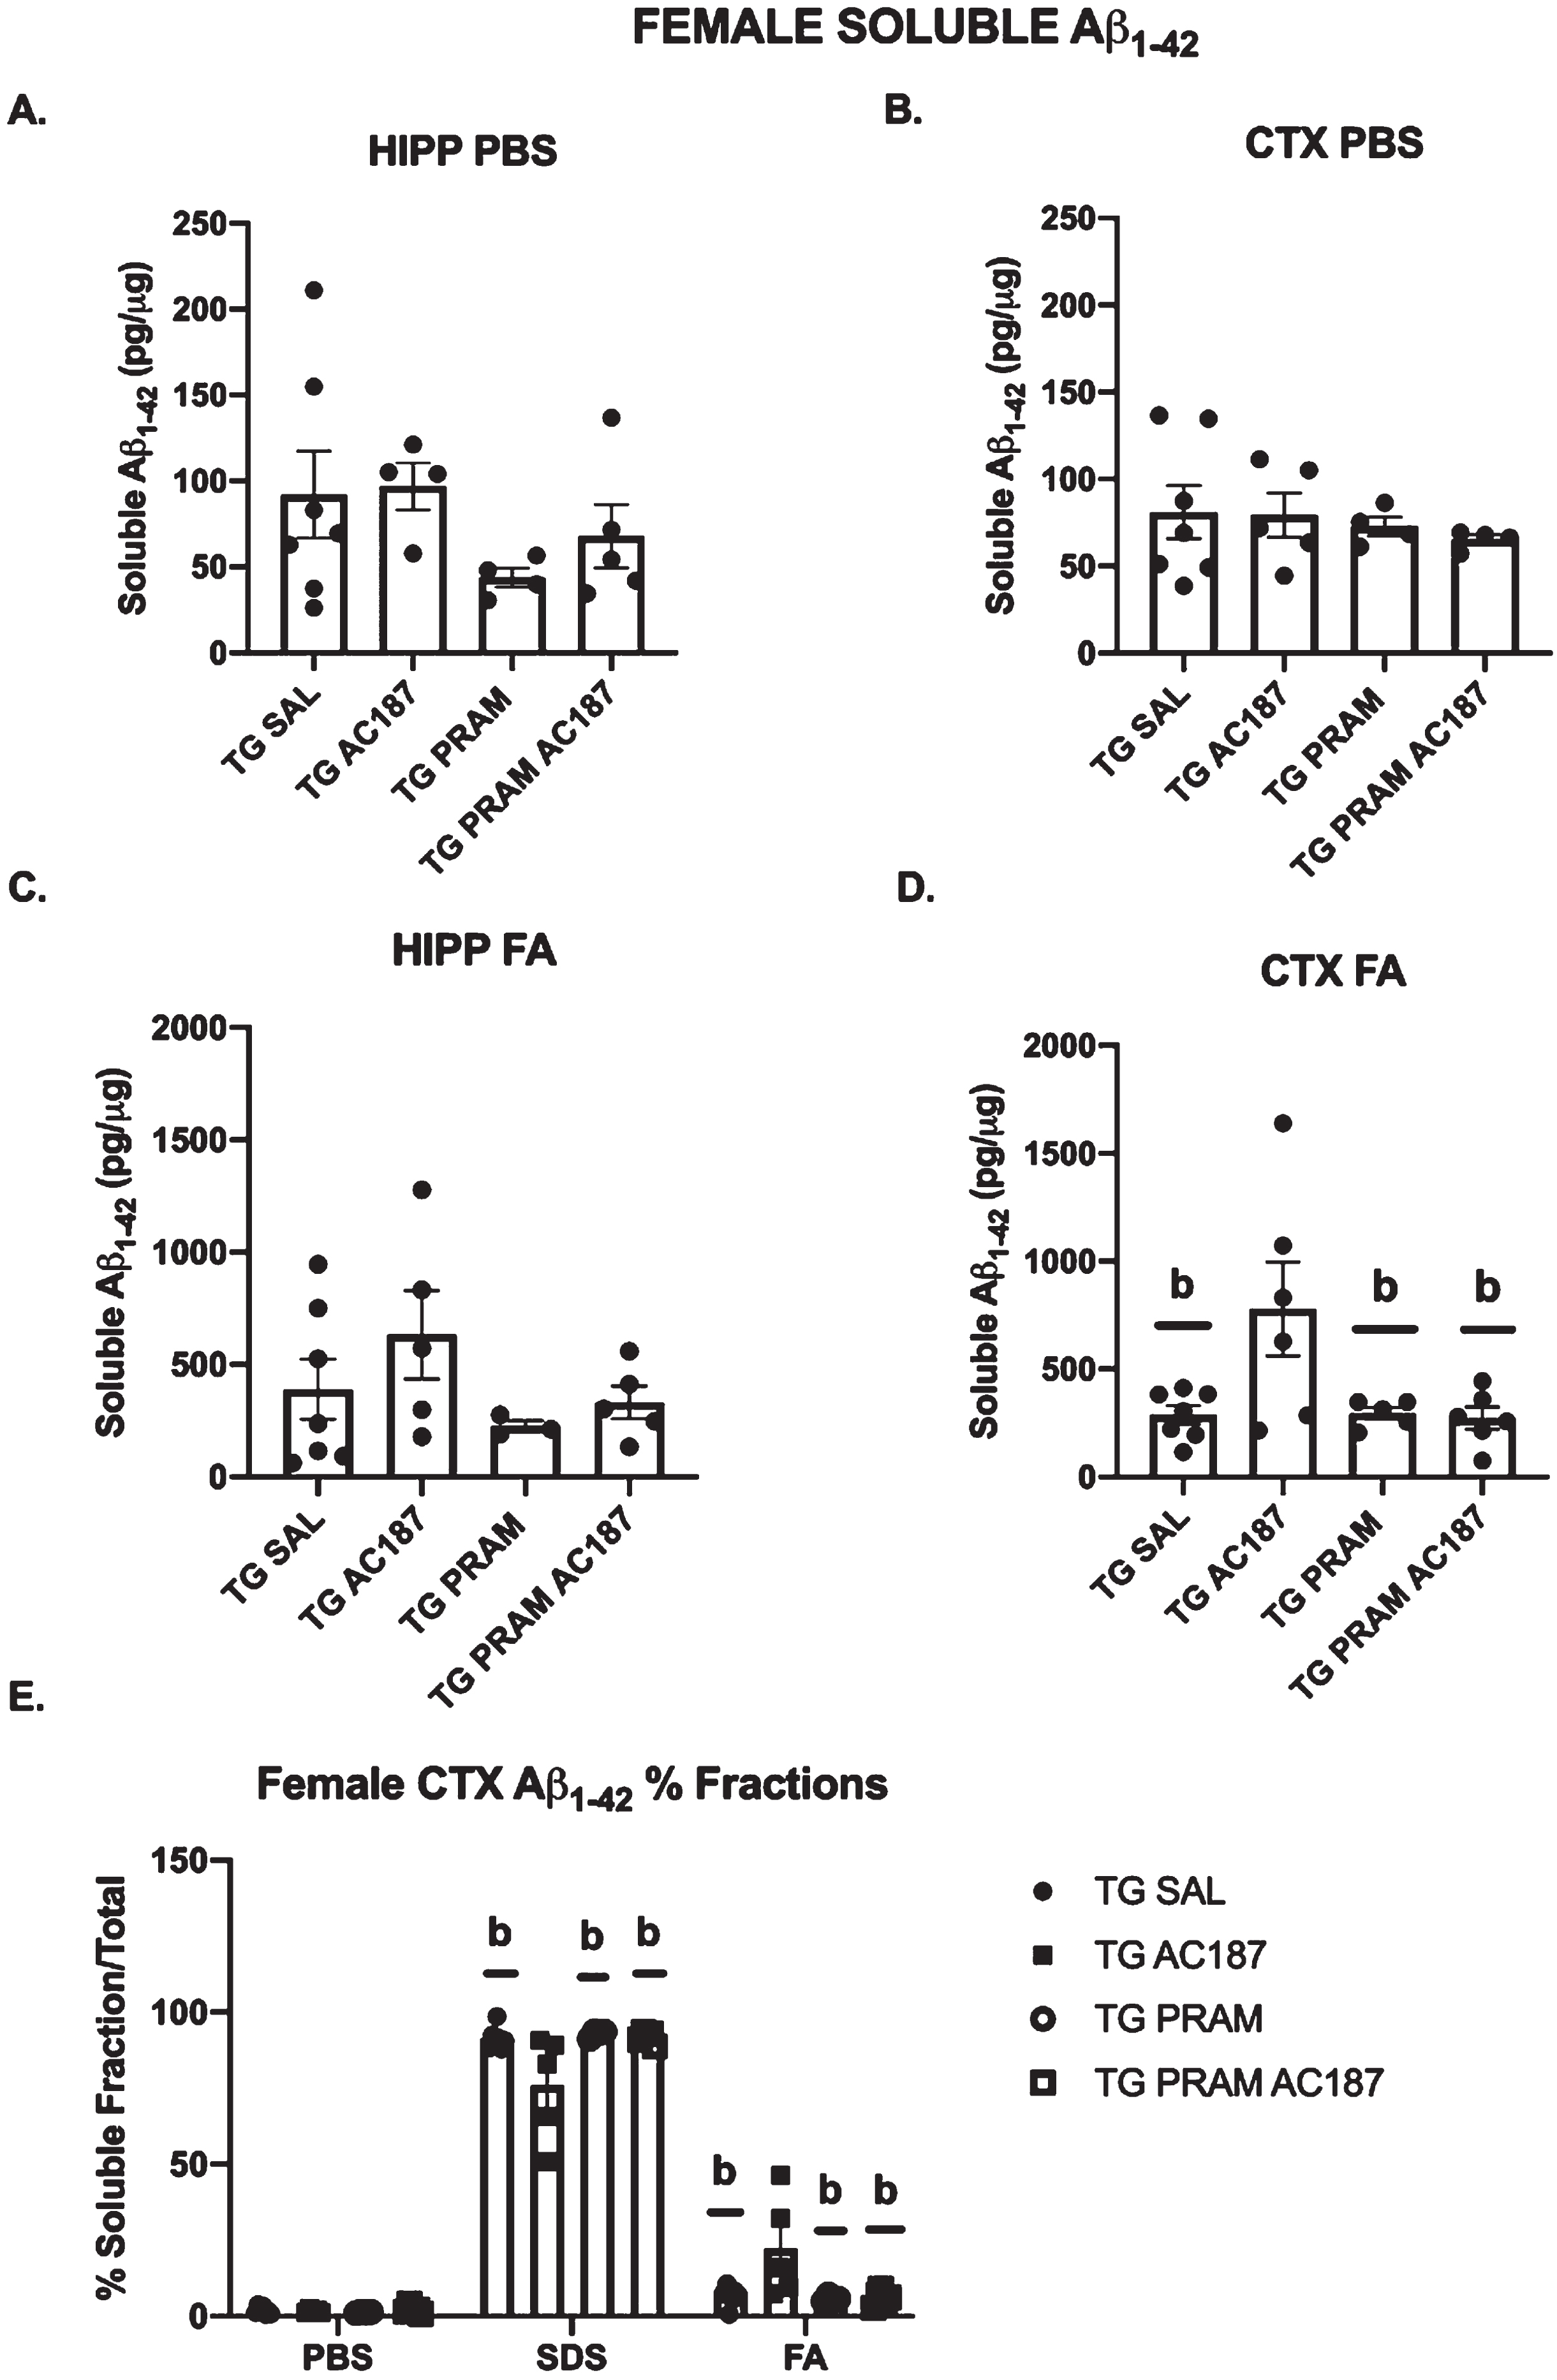
Soluble human Aβ42 ELISAs. A) Hippocampus female PBS-soluble Aβ42 in Tg-Sal (n = 7), Tg-Sal+AC187 (n = 4), Tg-PRAM (n = 4), and Tg-PRAM+AC187 (n = 5) mice. B) Cortex female PBS soluble Aβ42 in Tg-Sal (n = 7), Tg-Sal+AC187 (n = 5), Tg-PRAM (n = 4), and Tg-PRAM+AC187 (n = 4) mice . C) Hippocampus female FA- soluble Aβ42 in Tg-Sal (n = 7), Tg-Sal+AC187 (n = 5), Tg-PRAM (n = 3), and Tg-PRAM+AC187 (n = 5) mice . D) Cortex female FA- soluble Aβ42 in Tg-Sal (n = 7), Tg-Sal+AC187 (n = 6), Tg-PRAM (n = 5), and Tg-PRAM+AC187 (n = 7) mice. E) Female Cortex % fraction over total Aβ42 for PBS, SDS, and FA fractions. All data represented as mean±SEM for Tg-Sal, Tg-Sal+AC187, Tg-PRAM, and Tg-PRAM+AC187 mice. Significance is represented as bp < 0.05 compared to Tg-Sal+AC187.
To better gauge if there were pattern shifts in Aβ subtypes across groups, we also evaluated percent fraction of Aβ42 compared to overall total Aβ42 species (Aβ42/total Aβ42). Interestingly, in females, cortical SDS Aβ1 - 42 revealed a strong treatment effect (F = 4.423, p = 0.02) (Fig. 3E, Supplementary Figure 4). Post-hoc analysis reveals that central AMYR inhibition by AC187 (Tg-Sal+AC187) significantly lowered the percent SDS- soluble Aβ42 compared to APP/PS1 controls (p = 0.04) as well as PRAM treated animals (p = 0.05). A strong trend toward significance was noted when compared to PRAM+AC187 treated mice (p = 0.06). Importantly, these reductions in SDS-soluble levels shifted such that FA-soluble fraction showed statistically different increases Aβ42 across groups (F = 4.729, p = 0.01). post-hoc analysis revealed that AC187 treatment significantly increased FA- soluble Aβ42 compared to control levels (p < 0.01), as well as compared to PRAM (p < 0.01) and PRAM+AC187 treated mice (p < 0.01).
Treatment effects on amyloid-β processing
In order to better the understand how AMYR activation or inhibition altered brain Aβ levels, we evaluated AβPP cleavage enzyme activity indirectly by determining cleavage products for c-terminal fragments alpha and beta (CTFα and CTFβ). We also determined levels of cleaved Notch1 as a measure of γ-secretase activity. Since the only differences in soluble Aβ - 42 were found in females, we only evaluated CTFs in female mice. One-way ANOVA revealed that neither hippocampal or cortex CTFβ or CTFα expression were significantly altered due to treatment (Supplementary Figure 5A-D). Additionally, one-way ANOVA showed no differences in hippocampal cleaved Notch1 protein expression due to treatment (F = 0.537, p = 0.64) (Supplementary Figure 5E, F).
To further explore underlying mechanism associated with the detected cognition and soluble Aβ differences, we determined transcriptional changes in activity related cytoskeleton-associated protein (Arc) expression. Arc is known to interact with AβPP-processing enzymes, namely PSEN1 a component of γ-secretase [66] and also mediate synaptic plasticity within the dendrites of neurons [67–69]. Within our study, hippocampal mRNA transcripts were significantly altered across treatment (F = 6.238, p = 0.01). Specifically, PRAM treated APP/PS1 mice showed a significant increase Arc mRNA compared to saline treated controls (p < 0.01) as well as compared AC187 antagonist ICV-treated mice (p = 0.01). Within PRAM+AC187 treated mice, Arc mRNA transcripts did not differ from any groups, suggesting a partial ability of PRAM to increase Arc in the presence of central AMYR inhibition (Fig. 4).
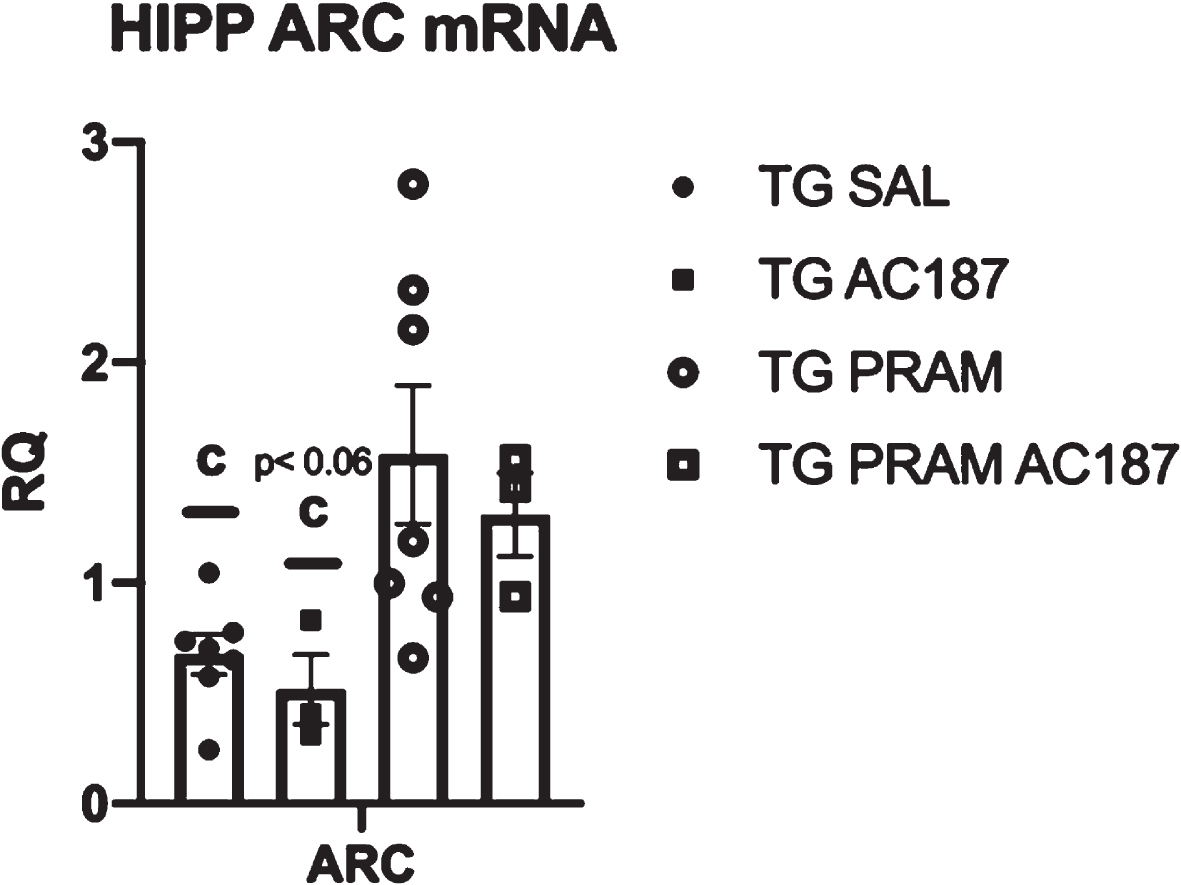
AMYR regulation of Arc transcription. Quantitative PCR of hippocampus Arc mRNA transcripts in Tg-Sal (n = 6), Tg-Sal+AC187 (n = 3), Tg-PRAM (n = 7), and Tg-PRAM+AC187 (n = 3) mice . Significance is represented as cp < 0.05 compared to Tg-Sal, Pram.
Treatment effects on AMYR and hippocampal metabolic peptide signaling
To address whether changes in cognition and AD pathology were associated with treatment-dependent alterations in hippocampal AMYR levels, we evaluated AMYR components CalcR, RAMP1, and RAMP3 in all treatment groups. One-way ANOVA analyses revealed no differences in RAMP1, RAMP3, or CalcR protein expression in the hippocampus due to treatment (Supplementary Figure 6), suggesting that the changes were not due to upregulation or down regulation of the amylin receptor.
Since amylin is known to mediate changes in expression, transcription, and or sensitivity of other metabolic peptides such as leptin, insulin, and POMC (all linked to cognition and or AD pathogenesis within the hippocampus), we also determined potential changes in these hormone components. Our analysis showed significant treatment differences in hippocampal POMC protein expression (F = 3.27, p = 0.05). post-hoc analysis revealed a significant increase in POMC protein expression in animals treated with PRAM under central AC187 antagonism (Tg-PRAM+AC187) compared to saline-treated animal controls (p = 0.01) and to Tg-Sal+AC187 treated mice (p = 0.01) (Fig. 5A, B). To evaluate if these changes POMC protein expression were due to transcriptional alterations, we also measured POMC transcripts. POMC mRNA expression was also changed by treatment (F = 4.863, p = 0.05). Post hoc analysis revealed that mice treated with AC187 alone (Tg-Sal+AC187) had significantly decreased POMC mRNA compared to Tg-Sal, aCSF controls (p = 0.04). Due to number availability, we did not see the same post-hoc comparisons in mRNA expression as in protein expression although the trends are visually similar (Supplementary Figure 7D).
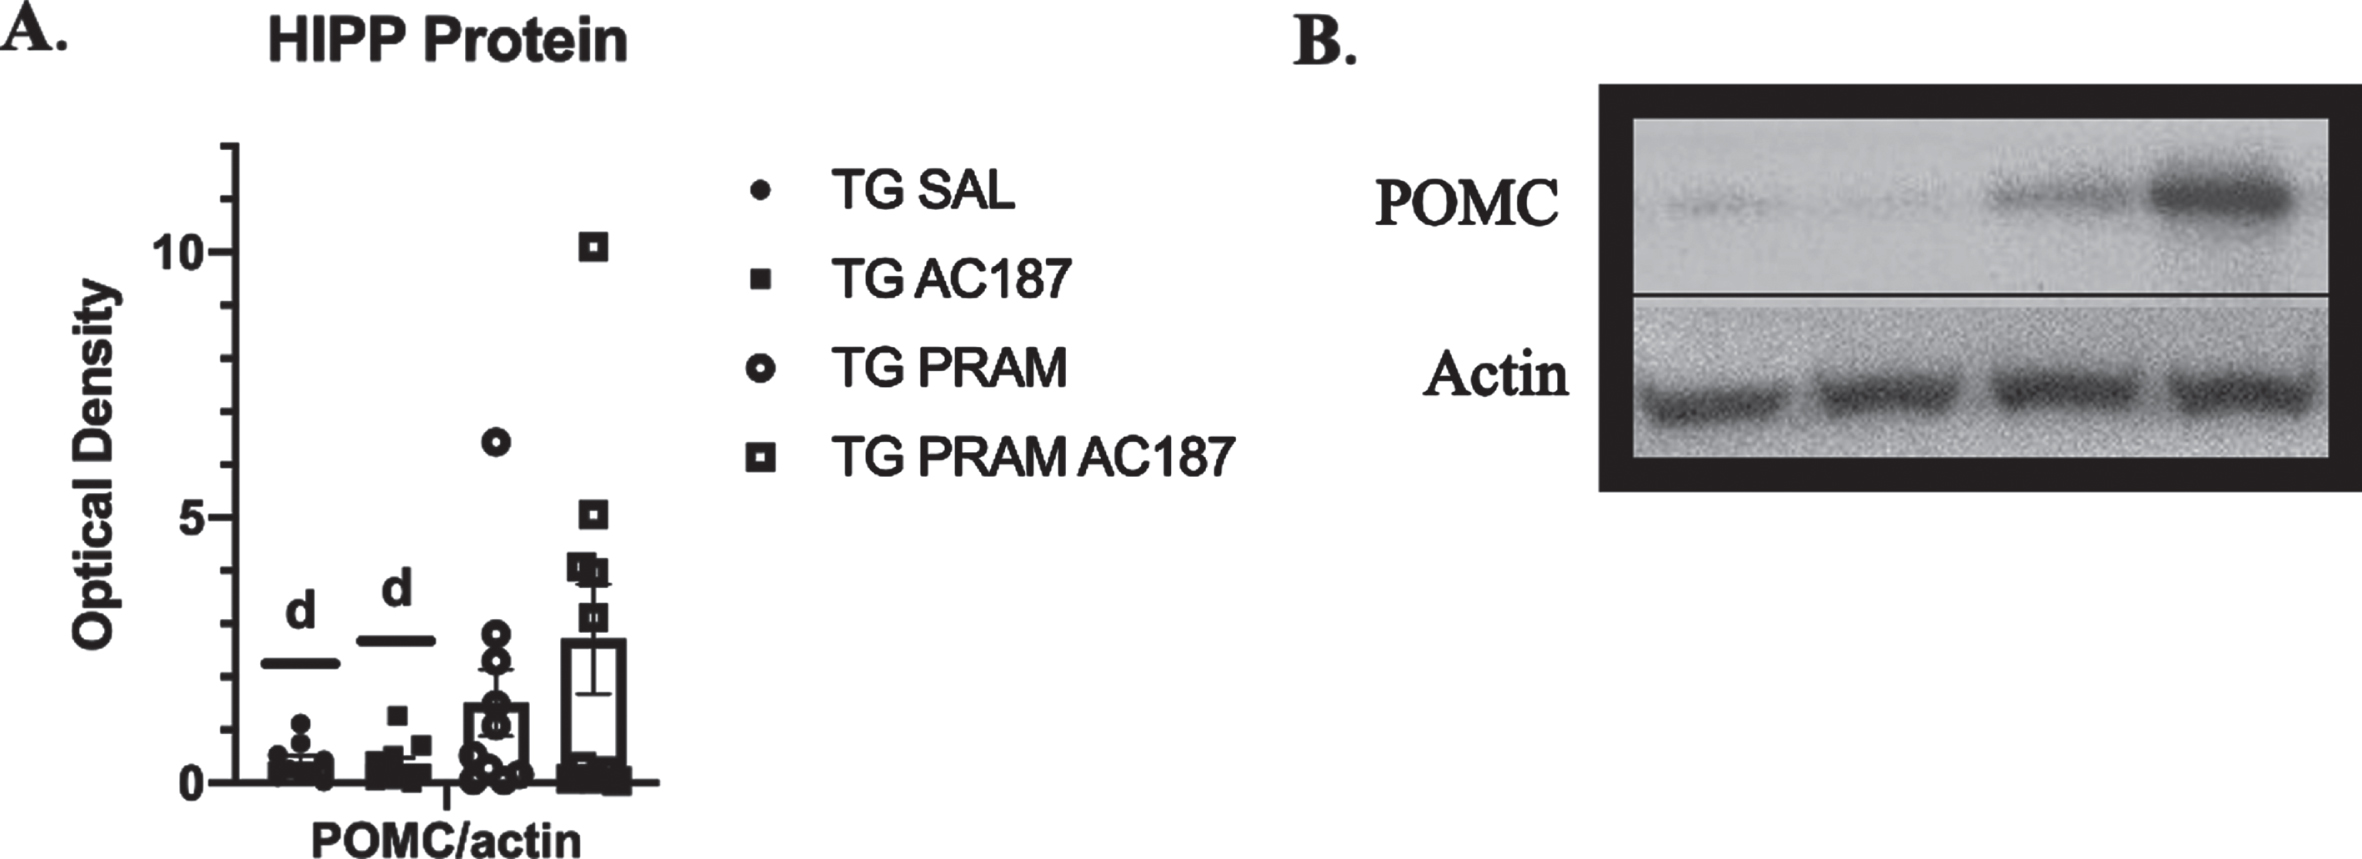
Hippocampal POMC protein expression. A) Western blot quantification of hippocampus POMC protein expression in Tg-Sal (n = 9), Tg-Sal+AC187 (n = 10), Tg-PRAM (n = 10), and Tg-PRAM+AC187 (n = 10) mice. Significance is represented as ap < 0.05 compared to Tg-Sal, bp < 0.05 compared to Tg-Sal+AC187, cp < 0.05 compared to Tg-Sal, dp < 0.05 compared to Tg-PRAM+AC187. B) Representative image of POMC compared to actin. Significance is represented as dp < 0.05 compared to Tg-PRAM+AC187.
Next, in order to determine if changes in POMC expression were due to potential upstream AMYR meditation of leptin or insulin signaling, we measured signal transducer and activator of transcription 3 (STAT3) activation downstream of leptin receptor (LepR), as well as GSK3β) activation downstream of insulin signaling. Overall, ANOVA revealed no changes of hippocampal long or short isoforms leptin receptor (LepRb and LepRa, respectively) protein expression due to treatment. Additionally, there were no differences in phosphorylation site Y705 for STAT3 or total STAT3 protein expression associated with treatment nor on inhibitory phosphorylation site Ser9 for GSK3β (Supplementary Figure 7A, B).
To further determine if changes in hippocampal POMC expression could be associated with extra-hippocampal changes, we determined hypothalamic LepR mRNA changes, known to be altered by amylin and to regulate POMC production in this region. Hypothalamic LepR mRNA transcription was significantly different across groups (F = 5.950, p < 0.01). post-hoc analysis revealed that both groups of animals treated centrally with the AMYR inhibitor AC187 (Tg-Sal+AC187; p = 0.03 and Tg-PRAM+AC187; p = 0.02) showed significantly decreased LepR mRNA transcripts compared to SAL treated controls (Supplementary Figure 7C).
PRAM treatment impact on hippocampal APP/PS1 transcriptome
Given the paucity of significant differences, to expand our ability to pursue future novel mechanisms of action for amylin neuroprotection, we performed RNA sequencing on hippocampal tissue of APP/PS1 (PRAM and SAL-treated) and WT mice. Differential gene expression (DEG) analysis in treated and non-treated APP/PS1 animals revealed a few interesting genes in male mice (Table 2) and in female mice (Table 3). Interestingly, there were no overlapping genes across the two sexes.
Male DEGs (AD+PRAM versus AD) padj < 0.05 + FC 1.5
Female DEGs (AD+PRAM versus AD) padj < 0.05 + FC 1.5
In females, PRAM treatment resulted in the upregulation mitochondrial related genes such as Rdh5 involved in oxidoreductase activity [70] and Gdap1 (Ganglioside Induced Differentiation Associated Protein 1) involved in mitochondrial dynamics [71]. Similarly, PRAM also normalized levels of Mpv17l (Mitochondrial Membrane Protein-Like), involved in ROS metabolism and mtDNA damage [72] as well as Srxn1 (Sulfiredoxin 1) involved in Nrf2 (nuclear factor E2-related factor 2) signaling [73] and OS resistance [74]. Together suggesting that PRAM treatment benefits may stem from upregulation of genes associated with OS protection. This was coupled by downregulated genes such as Pagr1a (PAXIP1-associated glutamate-rich protein 1A), Fam168a (Family with sequence similarity 168 Member A), Rnf8 (Ring Finger Protein 8), and Cldnd1 (Claudin domain-containing protein 1), all primarily associated with regulation of apoptosis and cell repair [75–77].
Of note, in males, different classes of genes were differentially expressed. In males, PRAM treatment decreased Kcnn3 (Potassium Calcium-Activated Channel Subfamily N Member 3) transcription, a gene largely associated with neuronal excitability, suggesting the mediation of hyperexcitability in APP/PS1. Additionally, PRAM increased expression of genes Golga7a (Golgin subfamily A member 7B), Scube1 (Signal Peptide, CUB domain and EGF-like domain containing 1), and Scd4 (Stearoyl-CoA desaturase 4) which are all associated with membrane stability, a critical function in neuronal function [78] and an aspect reported to be disrupted in AD pathology and associated with OS production [79–81].
Within the male hierarchical heatmap, which was plotted to cross reference TPMs across WT, APP/PS1, and APP/PS1 + PRAM treated mice, of the top 25 DEGs, 12 genes (48%) were “restored” to WT levels by PRAM treatment. Additionally, 13 genes (52%) were differentially upregulated by PRAM compared to WT or AD genotype (Fig. 6A). Within the female hierarchical heatmap, 14 genes (56%), were “restored” by PRAM treatment to WT expression, while 11 genes (44%), were upregulated by treatment compared to WT or untreated APP/PS1 mice (Fig. 6B).
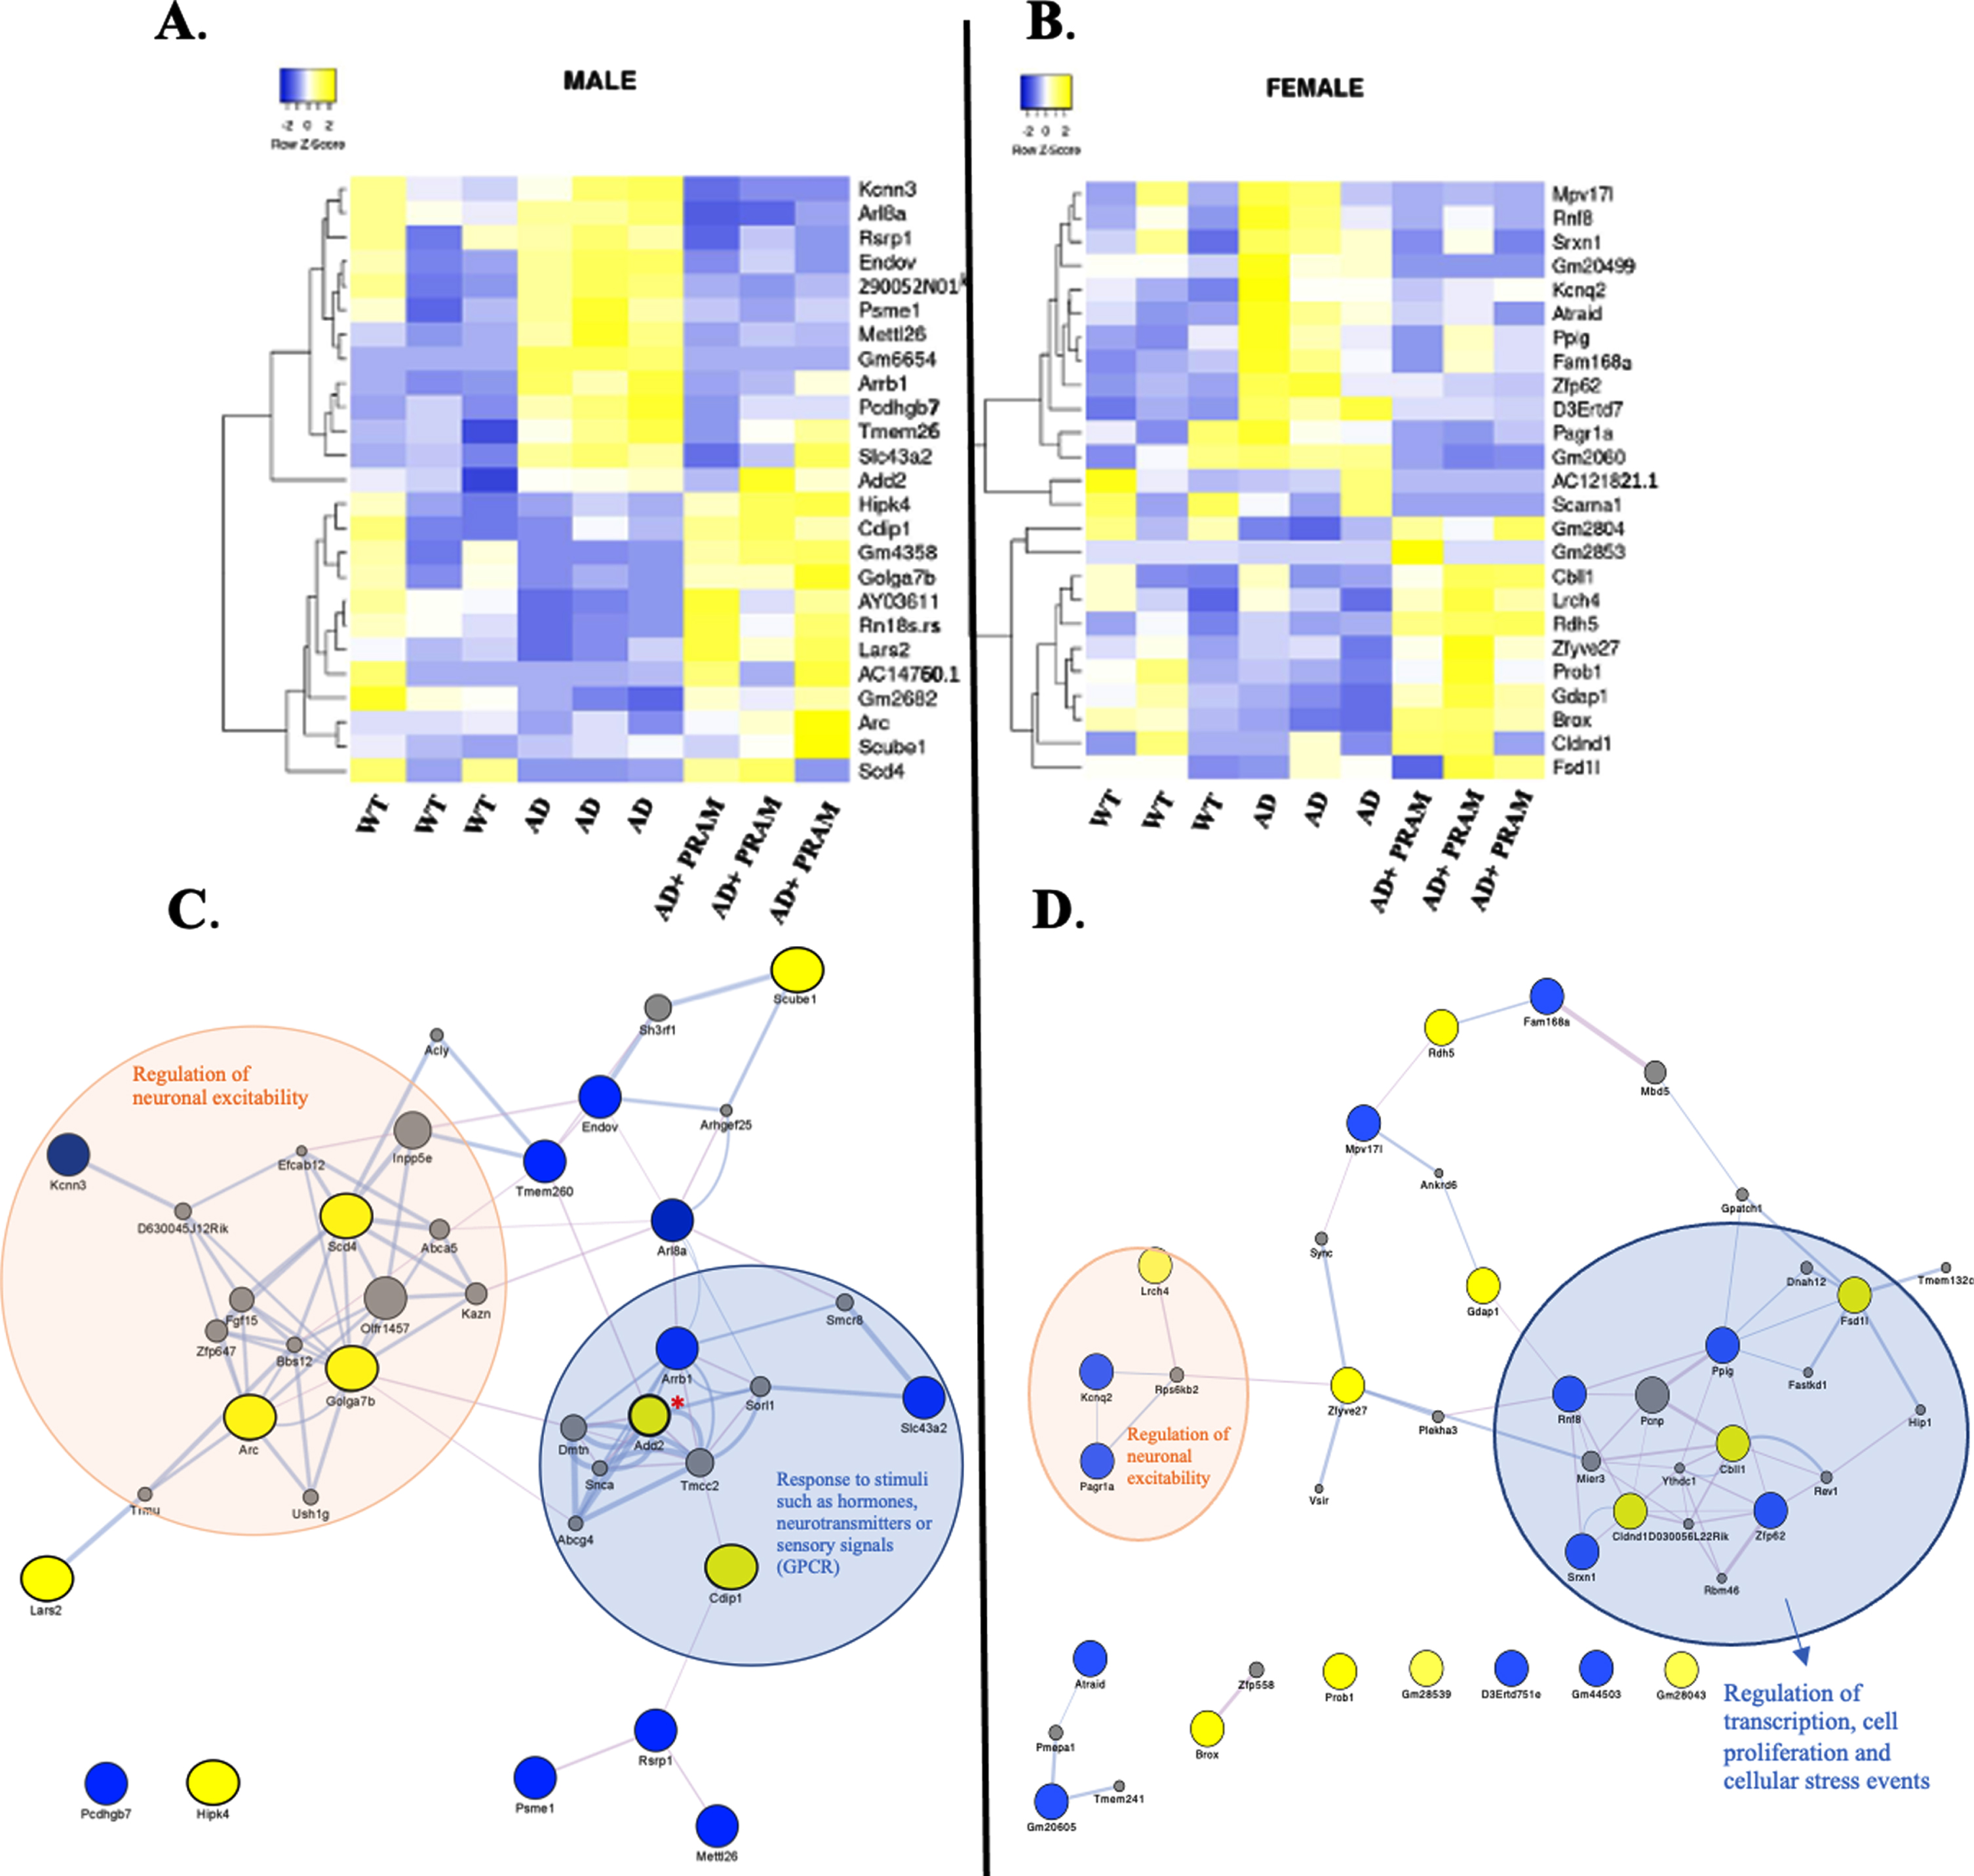
DEG analysis due to PRAM treatment in APP/PS1 mice. A (Male), B (Female) The top 25 genes most significantly differential expressed genes in APP/PS1 + PRAM treated mice compared to APP/PS1 were subjected to hierarchical clustering within a heatmap where TPMs from WT, APP/PS1 and APP/PS1 + PRAM mice were cross referenced to determine if PRAM treatment was able to normalize the expression of any genes aberrantly affected by genotype back to the expression levels of WT mice. Color scale represents genes that were upregulated (yellow) and downregulated (blue) relative to base mean expression of all mice. C) Male Cytoscape Topology Analysis: Male AD+PRAM DEGs with cut-off padj 0.1 + FC of > 1.5 analysis regarding functional features (Attributes, genetic interactions, psychical interactions, and shared protein domains) performed within GeneMANIA app of Cytoscape. DEGs represented as yellow (upregulated) or blue (downregulated) nodes, grey nodes represent gene interactions added by analysis. The hub gene, Add2, is denoted with a red asterisk. The main biological processes that were identified in the clusters within this network are highlighted with colored ovals, with their corresponding annotation. D) Female Cytoscape Topology Analysis: Female AD+PRAM DEGs with cut-off padj 0.1 + FC of > 1.5 analysis regarding functional features (Attributes, genetic interactions, psychical interactions, and shared protein domains) performed within GeneMANIA app of Cytoscape. DEGs represented as yellow (upregulated) or blue (downregulated) nodes, grey nodes represent gene interactions added by analysis. The hub gene, Cbll1, is denoted with a red asterisk. The main biological processes that were identified in the clusters within this network are highlighted with colored ovals, with their corresponding annotation.
Lastly, to better understand the biological relevance of DEGs found in our analysis, we sought to evaluate the protein-protein interactions of these genes through network analysis utilizing CytoScape. Our analysis generated a network for the males of 38 nodes and 99 edges and female network containing 43 nodes with 63 edges.
In our cohort of males (Fig. 6C), the annotations indicate that there are key clusters of genes that are related to biological processes associated with the regulation of G-protein-coupled receptors (GPCRs) and with neuronal excitability. For example, the predicted central network gene is Add2 (β-adducin), which encodes the protein Adducin 2, plays important roles in the signaling pathways of cAMP-dependent PKA activation. This supports the canonical signaling cascade associated with AMYR activation. Interestingly, the network topology in female mice was different from that of male mice (Fig. 6D). In females, the most represented DEG cluster was associated with biological processes related to protein transcription and cell proliferation, through apoptosis and DNA repair regulation mechanisms. The backbone of this network is the Cbll1 gene that encodes a ubiquitin-protein E3 ligase, which fulfills essential roles in ubiquitination for endocytosis, protein degradation, and mediation of RNA processing functions.
DISCUSSION
Here we set out to determine whether the neuroprotective effects of PRAM in the APP/PS1 AD model were mediated through CNS AMYR activation or rather through its ability to regulate peripheral metabolic tone. We also set out to determine potential mechanisms than could explain how PRAM treatment may mediate improvements in function and reductions in AD pathology as previously published [9, 18]. Lastly, we set out to resolve the conflicting data identifying amylin signaling both as neurotoxic or neuroprotective, by addressing whether central antagonism of the amylin receptor using a potent and well-established AMYR inhibitor (AC187) would impact function and pathology in the presence and absence of amylin receptor agonism using PRAM.
Here we confirm than PRAM improves spatial memory as previously published [9, 18] in younger APP/PS1 mice. Amylin receptor antagonism has also been reported to improve function in AD models [19–21]. Here we report that central administration of AC187 at neuroactive doses does not have such benefits in APP/PS1 mice. Notably, in this study central administration of AC187 in APP/PS1 mice reduced variability in performance compared to none treated APP/PS1 mice and showed a significant impairment when compared to PRAM treated APP/PS1 mice. Route of administration, dose, animal model used, and length of treatment and inhibitor type are all variables than can lead to divergence in results. To this end, benefits reported by AMYR blockade have been typically associated with AC253 delivery not AC187.
Notably, central AC187 inhibition in animals receiving systemic PRAM (Tg-PRAM+AC187) did not negatively impact performance suggesting that effects of PRAM on cognition may not be entirely mediated through central activation of its receptor. Interestingly, however, peripheral insulin and glucose metabolic endpoints did not reveal treatment differences. This was somewhat surprising given the known role of PRAM in regulating insulin sensitivity [82–84]. However, these findings were also not unexpected given than these animals had no metabolic impairment at this age. Furthermore, previous studies using the same dose and route of administration have shown no differences in weight [9, 18]. One aspect that we did not address is the link between amylin and intestinal regulation. Given the role of the microbiome on cognition and AD pathogenesis, future work, should explore whether the non-centrally mediated effects of amylin on function involved alterations in the gut microbiome.
Aβ pathology changes associated with amylin treatment in this study are generally in line with previous work [9, 18], albeit weaker given the younger age at which the animals were treated and thus only evident in females, which show a stronger phenotype. Of significance, antagonism of CNS AMYR with AC187 exacerbated pathology in female mice. Interestingly, when examining the fraction dynamics more closely, we detected a shift of soluble Aβ1 - 42 from the SDS-soluble fragment to the FA-soluble fragment in this Tg-Sal+AC187 treated group. It has been suggested that the SDS fraction represents lipid-bound, i.e., membrane/vesicle bound Aβ [85–87]. Therefore, these data suggest than AMYR antagonism may accelerate fibrilization or inhibit vesiculation of this protein. Some aspects to be addressed more directly should include determining the role of amylin in regulating trafficking of Aβ intracellularly or even the ability to alter AβPP availability at the plasma membrane. However, an exciting finding was that the effects of AC187 on pathology were completely reversed in the presence of peripherally administered PRAM suggesting that systemic administration of pramlantide overrode the effects of central AMYR inhibition. Previous work has demonstrated the ability of amylin to increase efflux of Aβ from the CNS into the periphery which could explain lower amyloid levels in both PRAM and PRAM+AC187 groups [16]. However, another tempting explanation to be pursued is that PRAM and AC187 may be competing for the receptor at the doses administered yielding the reported effects on Aβ levels as it does in area postrema [88].
Overall, our attempt to delve deeper into the dissection of AMYR agonism and antagonism on Aβ processing yielded surprisingly little and contradicted previous reports [9, 11]. This may be partially due to the fact that animals in previous studies were older (with established pathology) and were treated for longer periods of time. However, one aspect that also merits further study and that could explain the observed shifts of Aβ from SDS to FA fractions could be changes in intracellular γ-secretase activity. To this end, Mousa et al. (2020) [89] reported that PRAM altered γ-secretase activity and translocation to lipid rafts which resulted in changes in Aβ pathology. Although we did not see altered γ-secretase activity via Notch1 intracellular cleavage site, PRAM could mediate the transport of AβPP itself or the secretases to the plasma membrane. To begin to address this possibility, we determined levels of the immediate early gene Arc which is known to mediate vesicle transport of γ-secretase to the plasma membrane [66]. Additionally, Arc has been suggested to mediate synaptic plasticity [67, 69], thus making this gene a promising target of largely unknown downstream mechanisms of action. Here we report that systemic PRAM treatment increases Arc transcription and this effect is partially blocked by AC187 administration, suggesting that CNS AMYR partially regulates this process. The lack of full blockade by AC187, again, may be illustrating receptor competition between PRAM and AC187 or, even a differential binding preference of the two drugs onto different AMYR subtypes (i.e., AMYR1 versus AMYR3). In vitro pharmacokinetic studies will become crucial to dissect such aspects. However, given the role of Arc in the regulation of plasticity, this may be a potential mechanism through which PRAM improves cognitive function.
One of the key questions than we set out to answer was whether PRAM could be mediating its beneficial effects through its ability to regulate other metabolic signaling peptide than are known to interact with amylin and then are linked to cognition. Previous work has linked neuropeptides like leptin [90–96], insulin [97–100], and more recently POMC [101, 102] in aspects of hippocampal synaptic plasticity and Aβ and tau pathology. Given the ability of amylin to regulate these peptides [31, 103–107], at least at a hypothalamic level, we hypothesized that amylin could be mediating its effects through the interaction with these peptide signals. Of note we identified that central AC187 inhibition in the presence and absence of PRAM decreased LepR mRNA transcripts in the hypothalamus (not in the hippocampus). Lower hypothalamic LepR mRNA transcription has been shown in amylin knockout mice [108] thus at least these findings validate the effectiveness of AC187 delivery within this region. Surprisingly, however, we found no effects of AMYR agonism or central antagonist on hippocampal LepR expression or downstream signaling. On the other hand, we did identify that PRAM treatment increases POMC expression in the hippocampus (not in the hypothalamus). Recently, a POMC-related/melanocortin 4 receptor (MC4 R) microcircuit activation has been reported to be beneficial in APP/PS1 mice [101, 102]. Our data suggest that amylin signaling may be the key link that initiates this POMC/MC4 R microcircuit. However, while our data show that PRAM drives POMC expression in the hippocampus, it is unlikely that these signaling cascades are directly initiated within the hippocampus or even central given that AC187 was not able to block PRAMs effects on POMC hippocampal expression. Route of administration, differential receptor or receptor subtype expression within regions will all need to be further explored.
Lastly, to attempt to provide deeper mechanistic insight and future therapeutic avenues of exploration, we preformed bulk RNA sequencing in a separate cohort of APP/PS1 mice treated with SAL or PRAM. Although chronic systemic PRAM treatment did not produce many DEGs compared to AD control mice in males or females, not entirely surprising given the chronic nature of the treatment, we were able to pick up statistically and biologically relevant genes that our PRAM treatment regimen affected with a tight stringency of FDR padj < 0.05 coupled with a FC of at least 1.5. Importantly, these gene changes show a sexually dimorphic pattern where by in females but not males, chronic PRAM administration primarily drive genes associated with oxidative stress resistance thus we may be witnessing a rescued, stress-free environment as shown previously in other studies [11]. These results are nicely coupled with downregulated genes involved in DNA damage response [75–77] and apoptosis [109]. On the other hand, in males, we identified that PRAM treatment normalized genes to WT levels that were associated with membrane stability, GPCR signaling, neuronal excitability, intracellular transport, and synaptic plasticity. Whether these genes are truly sexually dimorphic or simply represent a different stage of disease (less advance in males) and effects of PRAM at these stage(s) will need to be further addressed in future studies using animals of different ages. Also of relevance, two main clusters emerged from this analysis, one associated with the regulation of neuronal excitability, known to be disrupted in aged mice and associated with memory deficits, cognitive defects, and neuroplasticity [110] and another associated with membrane stability and endosomal trafficking. Notably, our analysis included Arc, confirming RT PCR results and intimately linked to memory formation and AD pathophysiology [68, 112]. Arc together with Golga7b and Scd4, upregulated in the male network, all serve roles in membrane stability and neuronal plasticity [113–115]. Together this work opens several potential avenues of exploration into amylin receptor activation within the brain.
Conclusion
Overall, the current work generally supports previous studies in this mouse model [11] and more importantly, AMYR agonism as a beneficial pharmacological therapy in AD mouse models. In our hands, central AMYR antagonism had no benefits on cognition and, in fact, resulted in increases in soluble Aβ1 - 42. Interestingly in the hippocampus, the effects of AMYR antagonism were partially or fully blocked when central inhibition was coupled with peripheral PRAM treatment. This suggests much more complex pharmacokinetics and pharmacodynamics, as well as cognition and amyloid-independent mechanisms that need to be further explored in vivo and in vitro. Our exploration of mechanisms underlying PRAMs effects on cognition and pathology yielded two exciting novel findings that will need to be pursued in future studies. These include hippocampal POMC regulation and PRAMs ability to increase Arc levels. Importantly, and in line with a beneficial role of AMYR agonism on AD pathogenesis, our RNAseq results point to sexually dimorphic effects of PRAM that involve cellular stress resistance and repair in females and control of membrane stability and neuronal excitability in males.
Footnotes
ACKNOWLEDGMENTS
We thank the Case Western Reserve Genomics Core for performing the RNA sequencing.
FUNDING
This work was funded by the National Institution of Aging (1R15AG05092-01A1, R21AG064479-01). H.P. was partially supported by a Brain Health Research Institute Pilot Award from Kent State University.
CONFLICT OF INTEREST
G.C.S. is an Editorial Board Member of this journal but was not involved in the peer review process nor has access to any information regarding its peer-review. All other authors have no conflicts of interest to report.
DATA AVAILABILITY
The RNA Seq datasets (raw counts and metadata) for this study can be found in the Zenodo (https://doi.org/10.5281/zenodo.5539464) [![]() ].
].