
Abstract
Background:
β-site amyloid precursor protein cleaving enzyme 1 (BACE1) is a key enzyme in the formation of amyloid-β (Aβ) protein. Increasing evidence suggests that BACE1 concentration is a potential biomarker for Alzheimer’s disease (AD).
Objective:
To evaluate the correlations between plasma BACE1 concentration, cognition, and hippocampal volume at different stages of the AD continuum.
Methods:
Plasma BACE1 concentrations were measured in 32 patients with probable dementia due to AD (ADD), 48 patients with mild cognitive impairment (MCI) due to AD, and 40 cognitively unimpaired (CU) individuals. Memory function was evaluated using the auditory verbal learning test (AVLT), and voxel-based morphometry was used to analyze bilateral hippocampal volumes. Correlation and mediation analyses were performed to investigate the associations between plasma BACE1 concentration, cognition, and hippocampal atrophy.
Results:
The MCI and ADD groups exhibited elevated BACE1 concentrations compared with the CU group after adjusting for age, sex, and apolipoprotein E (APOE) genotype. Increased BACE1 concentration was found in AD continuum patients who were APOE ɛ4 carriers (p < 0.05). BACE1 concentration was negatively associated with the scores of the subitems of the AVLT and hippocampal volume (p < 0.05, false discovery rate correction) in the MCI group. Moreover, bilateral hippocampal volume mediated the relationship between BACE1 concentration and recognition in the MCI group.
Conclusion:
BACE1 expression increased in the AD continuum, and bilateral hippocampal volume mediated the effect of BACE1 concentration on memory function in patients with MCI. Research has indicated that the plasma BACE1 concentration might be a biomarker at the early stage of AD.
INTRODUCTION
Alzheimer’s disease (AD) is a common neurodegenerative disease in the elderly accounting for 60–80% of all dementia cases [1]. One of the major histopathological hallmarks of AD is the progressive accumulation of extracellular amyloid-β (Aβ) plaques. Aβ protein composed of 38–43 amino acids is derived from proteolytic processing of the Aβ protein precursor (AβPP) [2]. The amyloid hypothesis states that excessive production of Aβ peptides resulting from the cleavage of AβPP by β- and γ-secretase causes multiple pathological changes leading to synaptic and neuronal loss and brain atrophy with worsening cognition [3]. These pathophysiological alterations initiate 10–20 years before the onset of dementia [4]. Early diagnosis and intervention are essential for the success of disease-modifying or even preventive treatments. Notably, several studies have been committed to identifying biomarkers including cerebrospinal fluid (CSF) and imaging associated with the pathogenesis of AD. Compared with CSF, blood samples are noninvasive and easier to collect, and an ideal biomarker needs to be directly related to disease pathogenesis in the brain.
In vivo [5, 6] studies have shown that β-site amyloid precursor protein cleaving enzyme 1 (BACE1) is the major β-secretase in the brain, which is the rate-limiting step in Aβ production. It is required for the generation of all monomeric forms of Aβ, including Aβ42, which aggregates into bioactive conformational species and may initiate toxicity in AD [6]. During the past 20 years, the activity and concentration of BACE1 in CSF have attracted extensive attention. BACE1 activity and concentration have been extensively studied in animal models [7, 8] and humans [9 –17]. Thus, CSF activity and concentration have been proposed as biomarkers for AD. Previous studies [11 , 17] reported good diagnostic performance of BACE1 activity in CSF in identifying patients with AD and cognitively healthy individuals, and significant predictive power regarding conversion from mild cognitive impairment (MCI) to AD dementia. BACE1 concentration is associated with activity in the CSF [18] and could distinguish AD from patients with similar cognitive deficits due to depression [12]. Several studies have shown that plasma BACE1 concentration is elevated in dementia due to AD [9 , 18] and reflects Aβ deposition in the brain of a cohort of cognitively healthy individuals at risk for AD [10]. However, research on the effects of plasma BACE1 concentrations on AD remains scarce.
The medial temporal lobe is the early site of involvement in AD patients, and hippocampal atrophy could be an early imaging biomarker for AD diagnosis [19]. Previous studies have shown that the hippocampal volume may play a mediating role between biomarkers and cognitive impairment. One study showed that hippocampal volume mediates the effect of Aβ on cognition in patients with MCI [20]. Another study revealed that hippocampal volume mediates the association between Aβ42/40 and episodic memory in a cohort sample [21]. In addition, Fletcher et al. reported that the hippocampal atrophy rate mediates the association between Aβ in the CSF and memory function in early MCI [22]. Moreover, the apolipoprotein (APOE) genotype as a risk gene for AD has been associated with increased production and deposition of Aβ [23]. It remains unclear whether the hippocampus mediates the relationship between BACE1 and cognition or whether the APOE genotype influences BACE1 concentration. Altogether, the effects of plasma BACE1 concentration on clinical features such as cognition, hippocampal atrophy, and risk gene for AD need to be further explored. Therefore, the following hypotheses were proposed in this study: a) plasma BACE1 concentration is altered in MCI or dementia due to AD, b) the altered indicators are associated with cognitive impairment and hippocampal atrophy, c) the effect of plasma BACE1 concentration on cognitive function is mediated by hippocampal volume, and d) the plasma BACE1 concentrations may be affected by the APOE genotype.
METHODS
Subjects
All participants (Chinese Han origin, right-handed) aged 52–79 years were recruited from the First Affiliated Hospital of Anhui Medical University between August 2018 and March 2022. The diagnosis of MCI and probable dementia due to AD (ADD) was made according to the National Institute on Aging Alzheimer’s Association (NIA-AA) criteria [24, 25].
The inclusion criteria for MCI were as follows: Montreal Cognitive Assessment (MoCA) scores based on the following educational levels of Chinese people [26]: illiterate individuals≤13, individuals with 1–6 years of education≤19, individuals with 7 or more years of education≤24; Clinical Dementia Rating (CDR) = 0.5 [27]; Geriatric Depression Scale (GDS) score [28]≤10 points; and essentially preserved daily activities and social functions. Inclusion criteria for ADD were as follows: dementia was diagnosed according to the Diagnostic and Statistical Manual of Mental Disorders (DSM-IV) criteria [29]; CDR = 1 or 2 [27]; and dementia due to AD was diagnosed according to the core clinical criteria of probable AD dementia as defined by NIA-AA criteria. The inclusion criteria for the cognitively unimpaired (CU) group were as follows: no complaints of memory loss; MoCA scores: illiterate individuals > 13, individuals with 1–6 years of education > 19, individuals with 7 or more years of education > 24, CDR = 0.
The exclusion criteria were as follows: patients with a history of stroke or the presence of multiple or extensive infarcts or severe white matter hyperintensities; cognitive impairment with other core clinical features such as dementia with Lewy bodies, frontotemporal dementia or other neurological or psychiatric illness; use of medication that could have a substantial effect on cognition; severe liver and kidney diseases, thyroid diseases, tumors, and immune disease. The exclusion and inclusion processes for the participants are shown in Fig. 1.
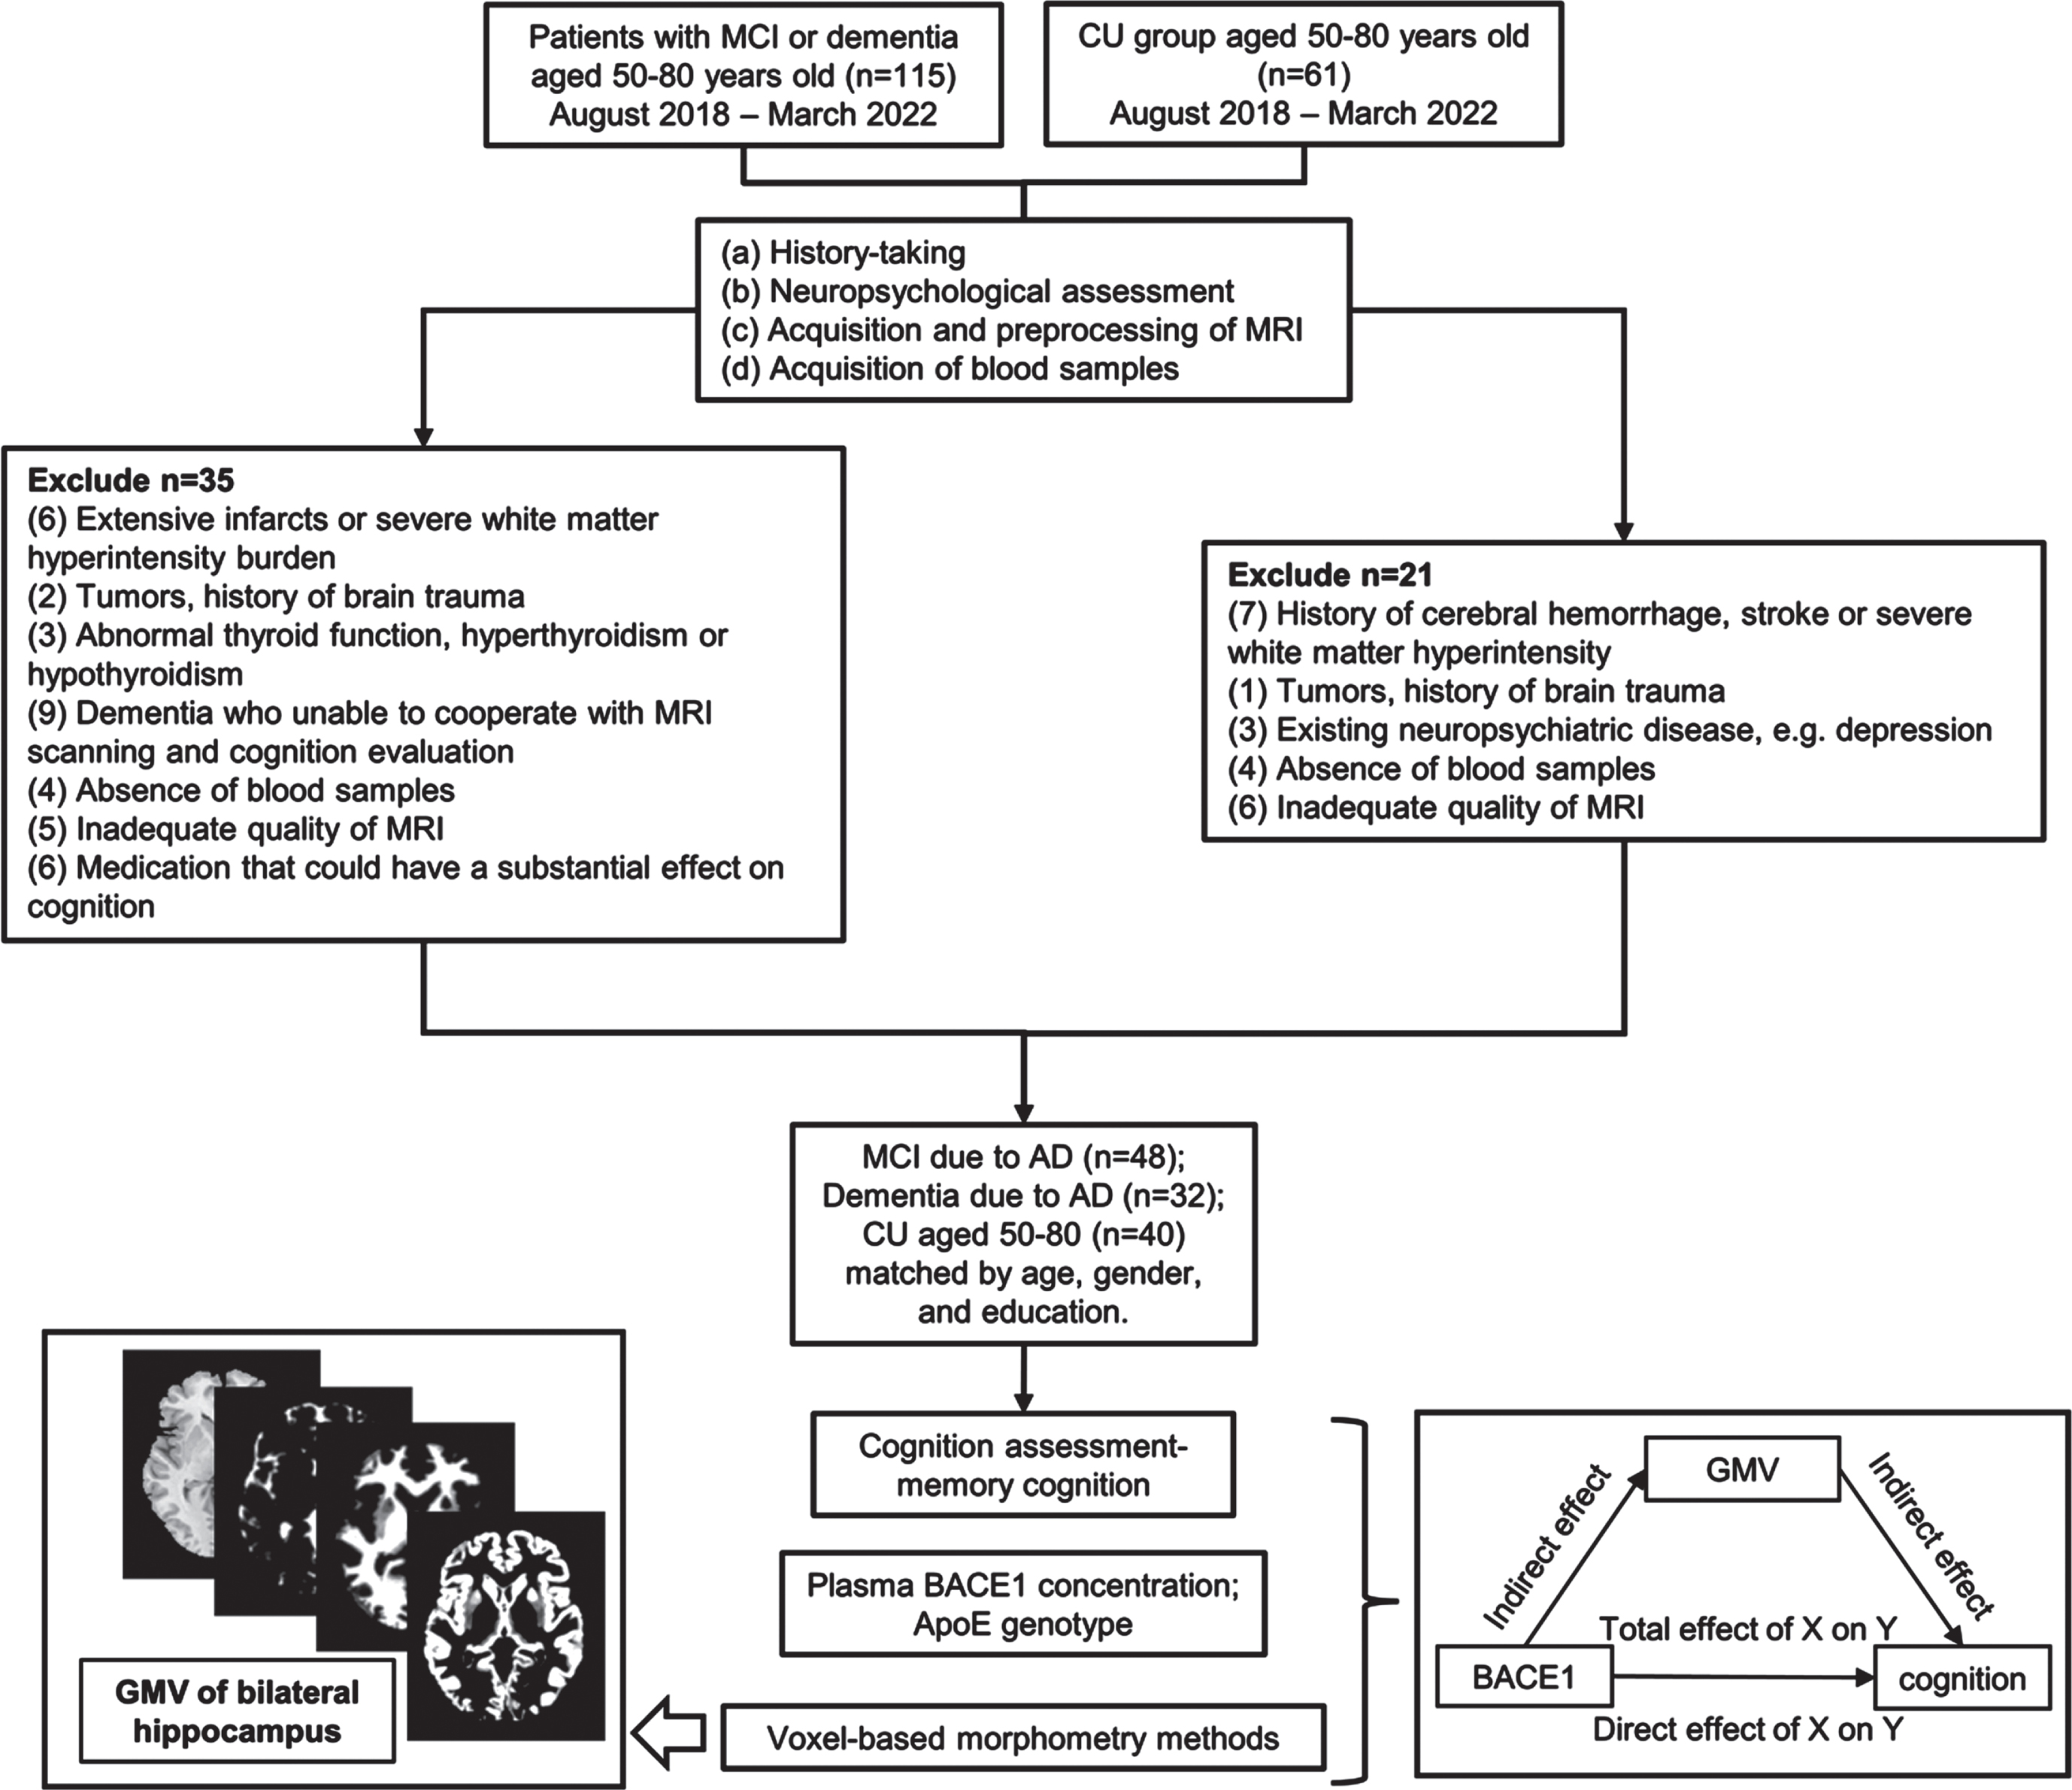
Flowchart of inclusion and exclusion criteria for participants and data processing in the study. CU, cognitively unimpaired; MCI, mild cognitive impairment; ADD, dementia due to Alzheimer’s disease; BACE1, β-site amyloid precursor protein cleaving enzyme1; GMV, gray matter volume.
This study was approved by the Institutional Ethics Committee of the First Affiliated Hospital of Anhui Medical University (ethical approval number: Quick-PJ 2022-14-28) and was conducted following the Declaration of Helsinki. Written informed consent was obtained from all participants after a full explanation of the procedure.
Demographic and clinical characteristics collection
Demographic and clinical data, including age, sex, years of education, smoking, drinking, and comorbidities, were collected by the researcher during the interview. Each subject’s weight and height were measured, and body mass index was calculated.
Neuropsychological assessment
Cognition assessment of all participants was performed by two trained neuropsychological technicians within 1 week of the magnetic resonance imaging (MRI) scan. All participants were evaluated using the Mini-Mental State Examination (MMSE) [30], MoCA [31], GDS, and Activities of Daily Living (ADL) scales [32]. Moreover, memory function was further assessed using the 12-words list of an Auditory Verbal Learning Test (AVLT) including immediate recall (AVLT-IR), short-term delayed recall (5-min delay recall, AVLT-SR), long-term delayed recall (20-min delay recall, AVLT-LR), and recognition [33]
Apolipoprotein E genotype
From the 2 mL of fasting blood drawn from all participants in EDTA tubes, 500μl of the whole blood sample was extracted and stored at –80°C for testing for the APOE genotype. APOE genotyping (rs.429358 and rs.7412) was performed according to standard procedures using a polymerase chain reaction (PCR) kit (BigDyeTM Direct Cycle Sequencing Kit, Applied BiosystemsTM, USA). Standard procedures included nucleic acid extraction, PCR amplification, PCR product purification, computer sequencing, and genotype data analysis.
Measurement of plasma BACE1 concentration
A total of 500μl of whole blood sample was extracted from EDTA tubes and centrifuged at 3500 rpm for 8 min, and the plasma samples were stored at –80°C. Plasma BACE1 concentration was assessed using human enzyme-linked immunosorbent assay (ELISA) kits according to the manufacturer’s instructions (Human BACE1 ELISA Kit, Shanghai Lianshuo Biotechnology Co., China).
MRI data acquisition
MRI scans were obtained using a 3.0-Tesla MR system (Discovery MR750 w, General Electric, Milwaukee, WI, USA) with a 24-channel head coil. Earplugs were used to reduce scanner noise, and tight but comfortable foam padding was used to minimize head motion. High-resolution 3D T1-weighted structural images were acquired by employing a brain volume (BRAVO) sequence with the following parameters: repetition time (TR) = 8.5 ms; echo time (TE) = 3.2 ms; inversion time (TI) = 450 ms; flip angle (FA) = 12°; field of view (FOV) = 256 mm×256 mm; matrix size = 256×256; slice thickness = 1 mm, without gap; 188 sagittal slices; and acquisition time = 296 s. T2 FLAIR images were acquired with the following parameters: TR = 9,000 ms, TE = 119.84 ms, FA = 160°, FOV = 225 mm2×225 mm2, matrix size = 512×512, 19 contiguous slices with thickness of 7.0 mm, and scan time = 118 s. All MRI images were visually inspected to ensure that only images without visible artifacts were included in subsequent analyses.
Voxel based morphometry (VBM) analysis
The VBM8 toolbox (http://dbm.neuro.uni-jena.de/vbm8/) was used to calculate gray matter volume (GMV). Structural MRI images were segmented into GMV, white matter volume (WMV), and CSF using a standard segmentation model. After the initial affine registration of the gray matter concentration was mapped into MNI space, the gray matter concentration images were nonlinearly warped using the diffeomorphic anatomical registration through exponentiated lie algebra (DARTEL) technique and then resampled to a voxel size of 1.5 mm×1.5 mm×1.5 mm. GMV was obtained by multiplying the gray matter concentration map by the non-linear determinants derived from the spatial normalization step. Finally, the GMV images were smoothed using a Gaussian kernel of 8 mm×8 mm×8 mm full-width at half maximum. The bilateral hippocampus was extracted from the Anatomical Automatic Labeling (AAL) atlas [34] as the regions of interest (ROI). Using data processing and analysis for brain imaging (DPABI) software (http://rfmri.org/dpabi) [35], all participants’ GMV within ROIs were extracted from smoothed GMV of the whole brain for further analysis. The total intracranial volume (TIV) was calculated by summing the total GMV, WMV, and CSF volumes.
The hippocampal volumes presented in this study were corrected to TIV using the residual method [36]. The TIV corrected measurements were expressed as ROIadi = ROIi - β(TIVi- meanTIV). ROIadi was adjusted by the TIV volume of individual i, ROIi is the original uncorrected volume of individual i, β is the slope from the linear regression of ROI on TIV, TIVi is the TIV for individual i, and meanTIV is the mean TIV across all individuals.
Statistical analyses
The Shapiro–Wilk test was performed on all measures to assess data normality. Normally distributed continuous variables are expressed as mean±standard deviation (SD), and comparisons among the three groups were analyzed by ANOVA. Non-normally distributed numerical variables were expressed as medians (P25, P75), and comparisons among the three groups were performed using the Kruskal–Wallis test. Categorical variables are expressed as n (%), and Pearson’s chi-square analysis was used for comparison among the CU, MCI, and ADD groups. General linear models were used to compare BACE1 among the three groups, and for the APOE genotype, the former was adjusted for age, sex, and APOE, and the latter was adjusted for age and sex. Hippocampal volumes were compared after controlling for age, sex, and APOE. The Bonferroni correction was used for between-group comparisons.
Partial correlation was performed between plasma BACE1 concentration and memory function by controlling for sex, age, education, and APOE genotype; after controlling for age, sex, and APOE genotype, partial correlation was performed between plasma BACE1 concentration and the bilateral hippocampus. False Discovery Rate (FDR) correction for adjusted p-values was used for correlation analysis.
Mediation analysis
To further test whether the association between BACE1 concentration and cognition was mediated by the brain, mediation analysis [37] was performed using the PROCESS macro (http://www.processmacro.org/). In the mediation model, all paths were reported as unstandardized ordinary least squares regression coefficients, namely the total effect of X on Y (c) = indirect effect of X on Y through M (a×b)+direct effect of X on Y (c’). A conceptual diagram of the mediation analysis is shown in Supplementary Figure 1. The significance analysis was based on 5000 bootstrap realizations, and a significant indirect effect was indicated when the bootstrap 95% confidence interval (CI) did not include zero. Here, only variables that demonstrated a significant correlation with others were considered independent (BACE1 concentration), dependent (cognition), or mediating (GMV of the bilateral hippocampus) variables in the mediation analysis. Age, sex, years of education, and APOE genotype were considered nuisance covariates.
RESULTS
Demographic and clinical characteristics of CU, MCI, and ADD groups
This study included 120 participants, including CU individuals (n = 40), patients with MCI due to AD (n = 48), and patients with dementia due to AD (n = 32). The demographic and clinical characteristics are shown in Table 1. There were no significant differences in age, sex, education, WMV, or TIV among the three groups (p > 0.05). Regarding the vascular risk factors, the prevalence of smoking, alcohol, hypertension, diabetes, or hyperlipidemia in the three groups was comparable (p > 0.05), while lower body mass index was observed between the ADD and other groups (ADD versus CU, ADD versus MCI, p < 0.001). In terms of cognitive function, the ADD group exhibited significantly lower MMSE scores (ADD versus CU, ADD versus MCI, p < 0.001), MoCA scores (ADD versus. CU, ADD versus MCI, p < 0.001), AVLT-IR scores (ADD versus CU, ADD versus MCI, p < 0.001), AVLT-SR (ADD versus CU, ADD versus MCI, p < 0.001), AVLT-LR (ADD versus CU, ADD versus MCI, p < 0.001), and recognition (ADD versus CU, ADD versus MCI, p < 0.001) than the CU and MCI groups. The MCI group exhibited significantly lower MMSE scores (p < 0.001), MoCA scores (p < 0.001), AVLT-IR scores (p < 0.001), AVLT-SR (p < 0.001), AVLT-LR (p < 0.001), and recognition (p = 0.01) than the CU group. As shown in Fig. 2, the GMV of the bilateral hippocampus was lower in ADD than in the MCI and CU groups (ADD versus CU, ADD versus MCI, p < 0.001), and so was MCI compared to the CU group (p < 0.01) after controlling age, sex, and APOE genotype. Moreover, the proportion of APOE ɛ4 carriers in the ADD group (50%) was higher than that in the CU (10%, χ2 = 14.178, p < 0.001) and MCI group (25%, χ2 = 5.275, p = 0.022). The distribution of the APOE genotypes in the three groups is presented in Table 1. Notably, no significant differences between the MCI group and CU group were found in the distributions of the APOE genotype (χ2 = 3.300, p = 0.069).
Demographic and clinical data for CU, MCI, and ADD groups
CU, cognitively unimpaired; MCI, mild cognitive impairment; ADD, dementia due to Alzheimer’s disease; BMI, body mass index; MMSE, Mini-Mental State Examination; MoCA, Montreal Cognitive Assessment; GMV, gray matter volume; WMV, white matter volume; CSF, cerebrospinal fluid; TIV, total intracranial volume; AVLT-IR, auditory verbal learning test immediate recall; AVLT-SR, auditory verbal learning test short term recall; AVLT-LR, auditory verbal learning test long term recall; data are given as n (%), mean±SD, Median (P25, P75), aANOVA test, bchi-square test, cKruskal-Wallis test, #compared to CU group p < 0.05, *compared to MCI group p < 0.05.
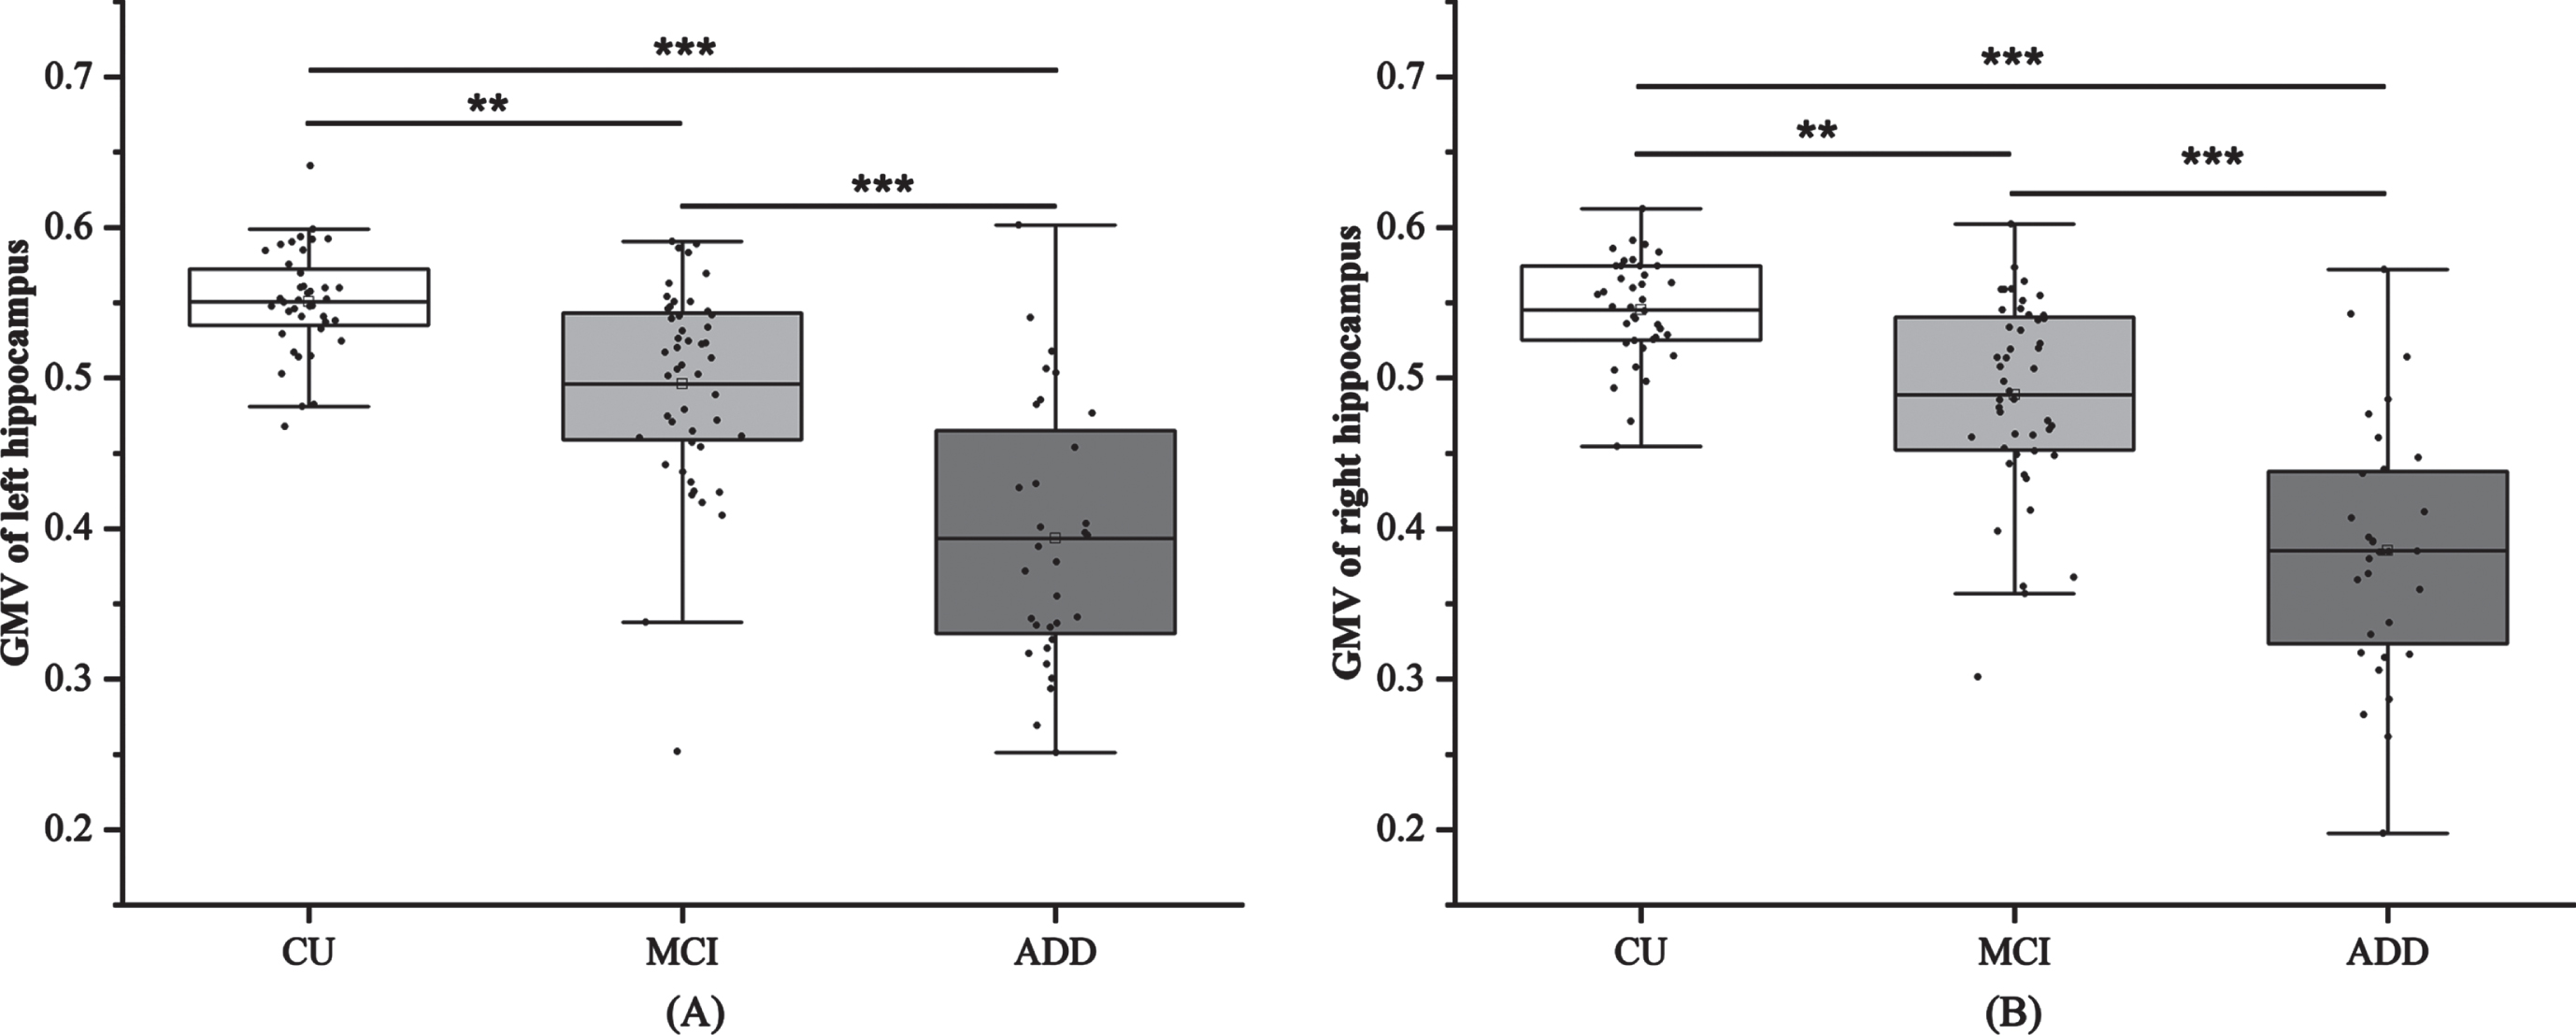
Comparison of bilateral hippocampus volume among three groups. Bonferroni correction, **p < 0.01, ***p < 0.001. CU, cognitively unimpaired; MCI, mild cognitive impairment; ADD, dementia due to Alzheimer’s disease; GMV, gray matter volume.
Comparison of plasma BACE1 concentration in subgroups
As shown in Fig. 3A, after controlling for age, sex, and APOE genotype, plasma BACE1 concentrations were significantly increased in subjects with AD dementia when compared to the MCI (p = 0.041) or CU group (p < 0.001), and a significant difference was observed between the MCI and CU group (p = 0.003). When comparing subgroups with different APOE genotypes (Fig. 3B), plasma BACE1 levels in APOE ɛ4 carriers were obviously higher than those in non-carriers in the AD continuum (MCI+ADD) (p = 0.037); however, the difference was not significant after controlling for age and sex (p > 0.05). In addition, no significant differences were found in the CU, MCI, and ADD groups (p > 0.05).
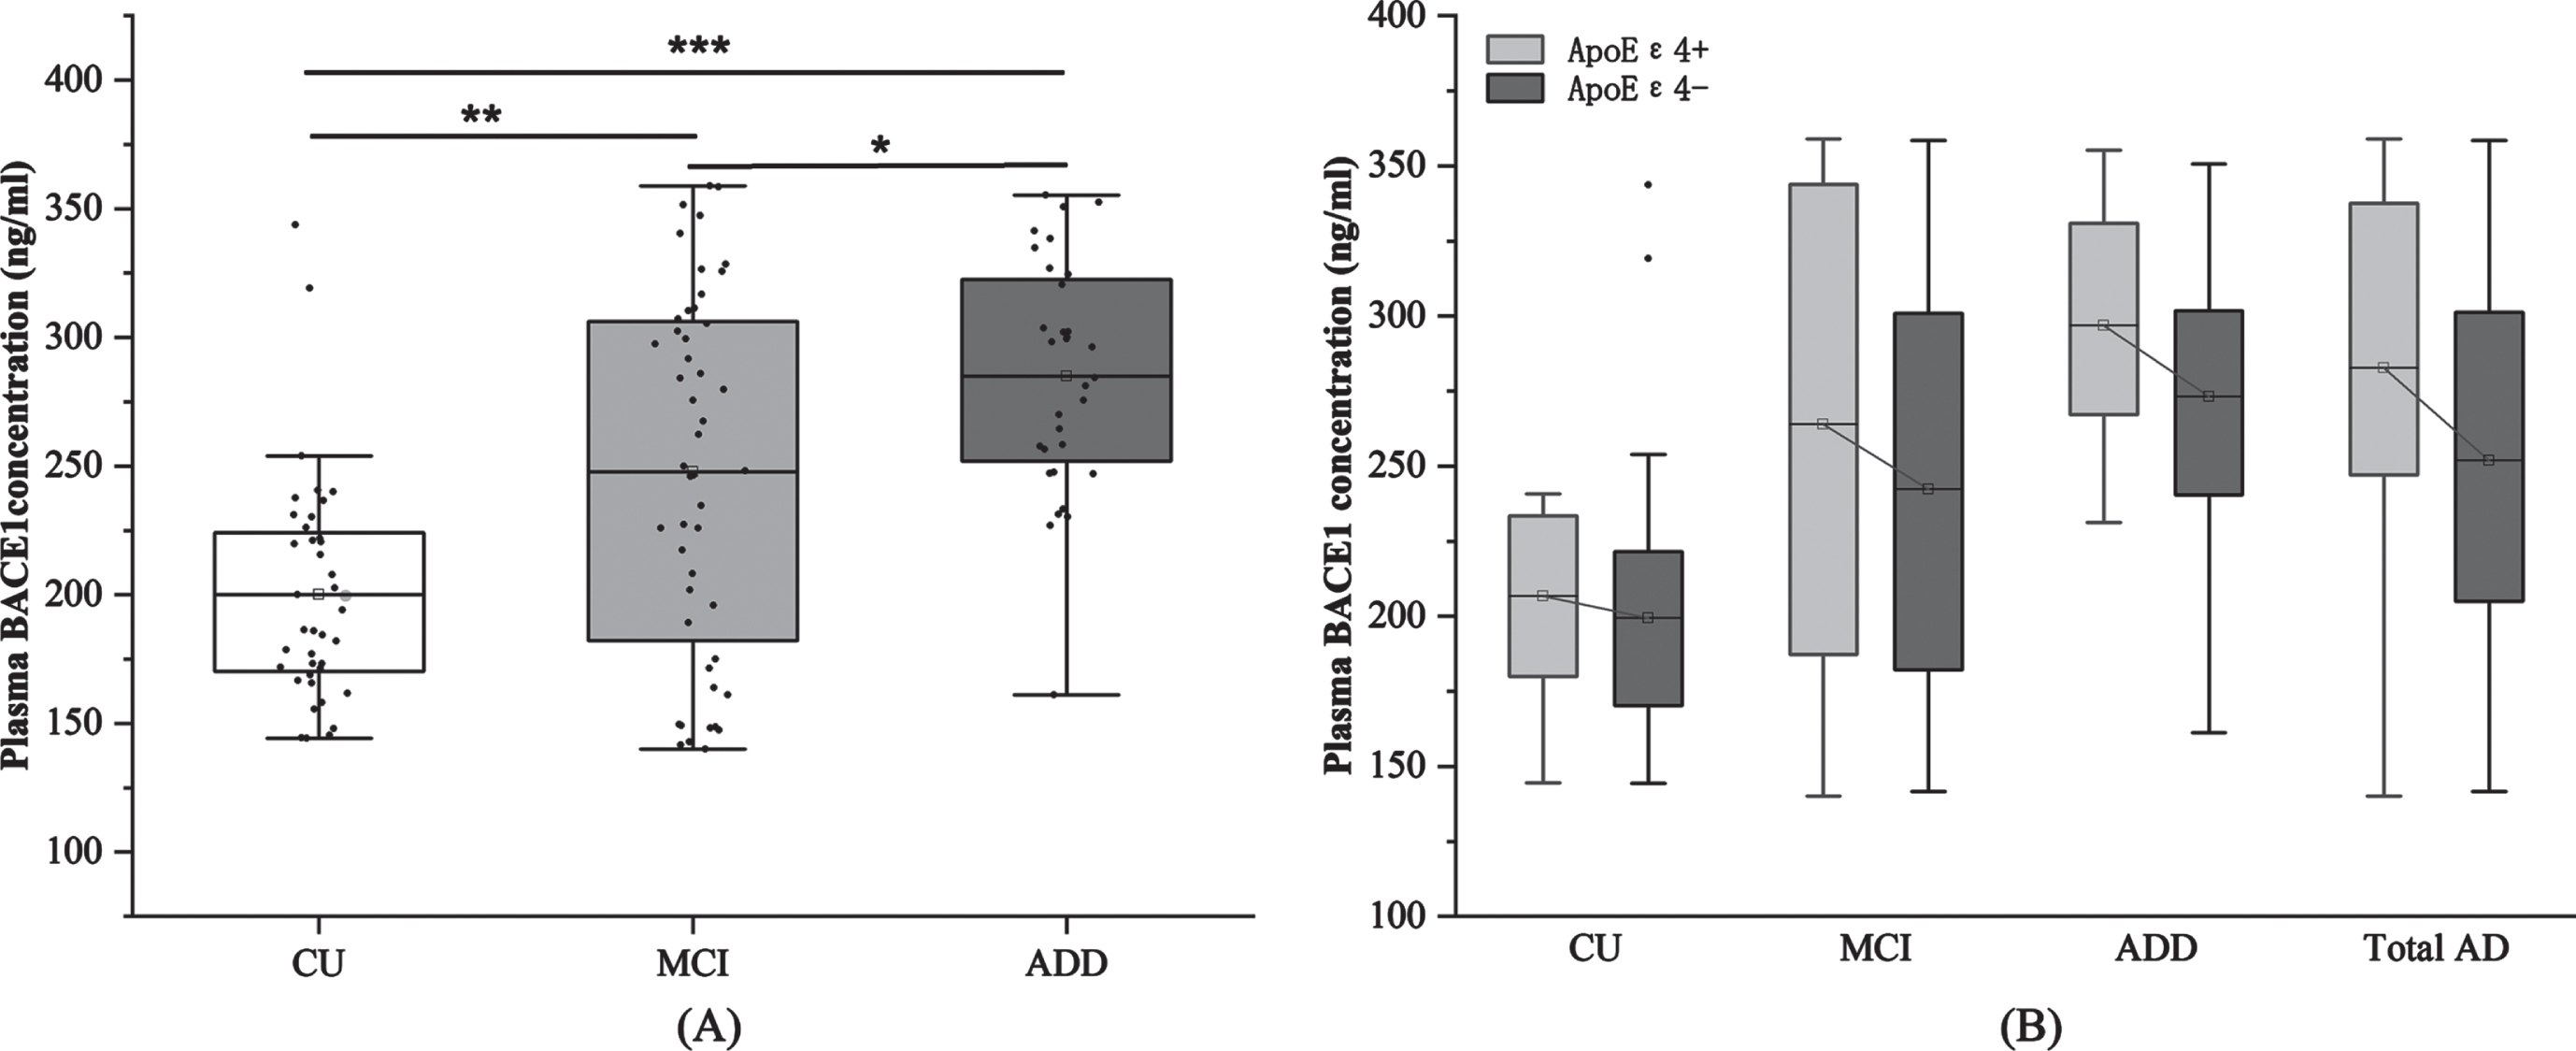
A) Comparison of BACE1 concentrations among three groups, Bonferroni correction; B) Comparison of BACE1 concentrations in APOE ɛ4 carriers and noncarriers. *p < 0.05, **p < 0.01, ***p < 0.001. CU, cognitively unimpaired; MCI, mild cognitive impairment; ADD, dementia due to Alzheimer’s disease; BACE1, β-site amyloid precursor protein cleaving enzyme 1.
Association between plasma BACE1 concentration and cognitive function
After controlling for age, sex, education, and APOE genotype, plasma BACE1 concentrations were negatively associated with AVLT-IR (pr = –0.351, p = 0.035, Fig. 4A), AVLT-SR (pr = –0.388, p = 0.034, Fig. 4B), AVLT-LR (pr = –0.331, p = 0.037, Fig. 4 C), and recognition (pr = –0.376, p = 0.034, Fig. 4D) in the MCI group (FDR correction), whereas no significant difference was found in HC or AD groups (p > 0.05). In addition, no significant difference was found when comparing the association between BACE1 and other neuropsychological scales among the three groups (p > 0.05, Supplementary Table 1).
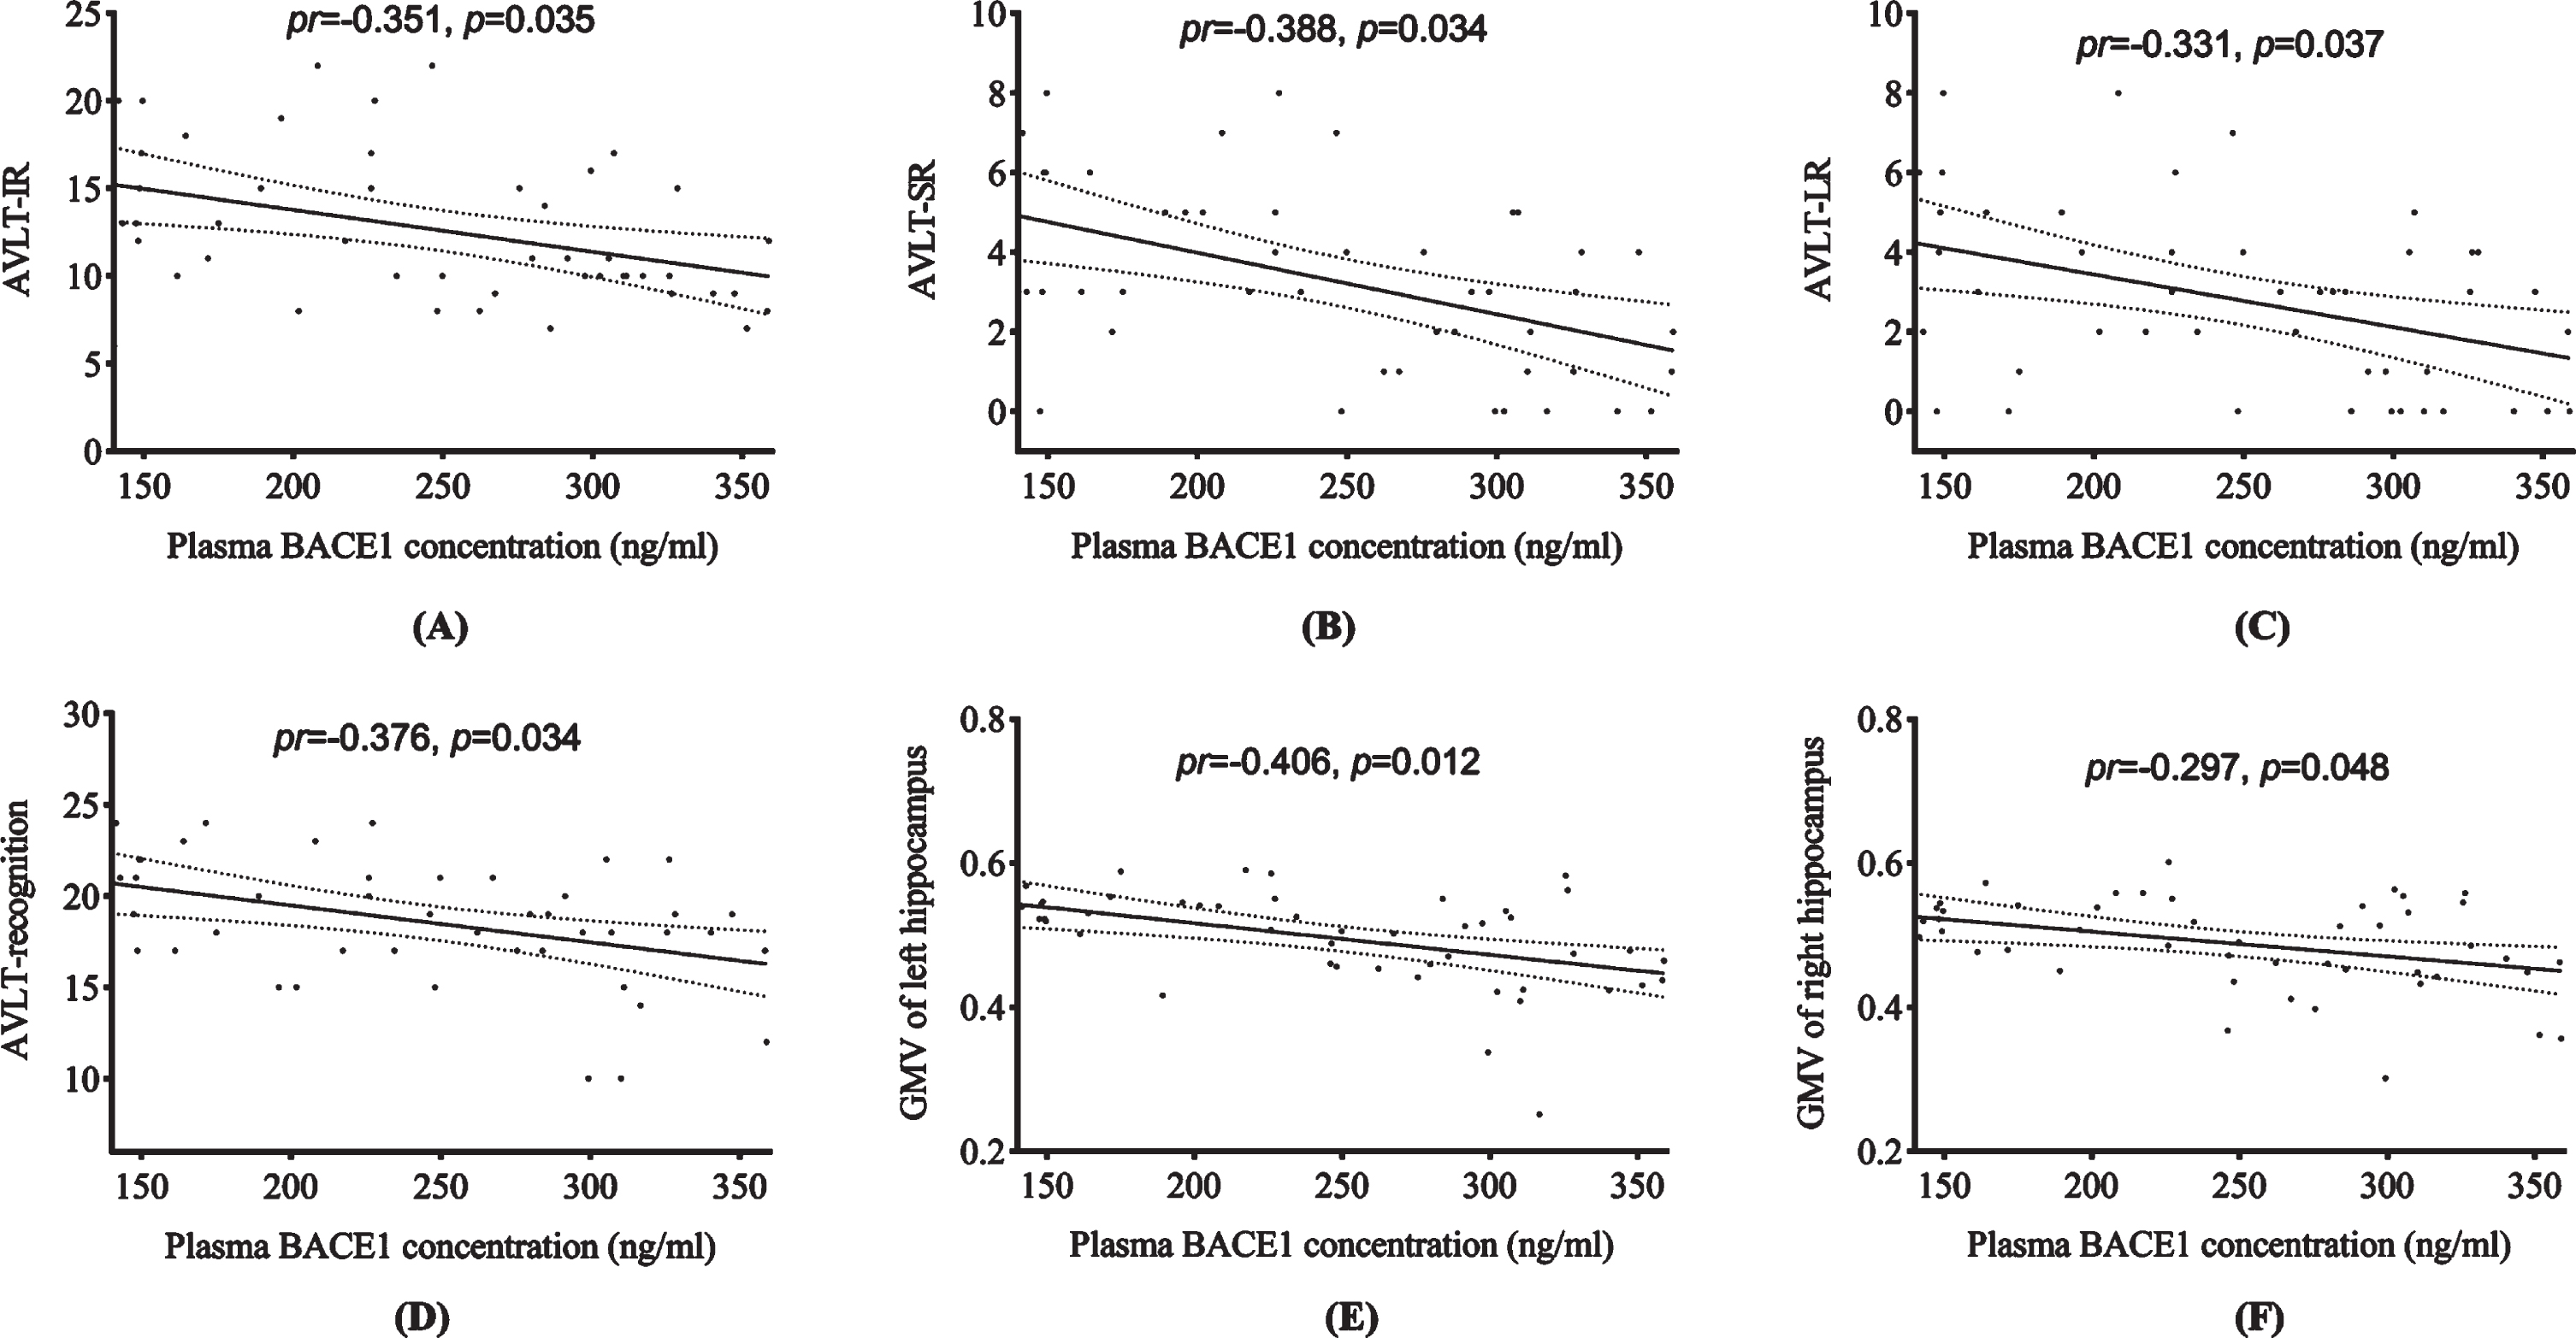
Partial correlation between plasma BACE1 concentration and cognition as well as hippocampal volume (FDR correction). AVLT-IR, auditory verbal learning test immediate recall; AVLT-SR, AVLT short-term delayed recall (5 minutes delay recall); AVLT-LR, AVLT long-term delayed recall (20 minutes delay recall); BACE1, β-site amyloid precursor protein cleaving enzyme 1.
Association between plasma BACE1 concentration and GMV in bilateral hippocampus
Plasma BACE1 concentration was negatively associated with GMV in the left hippocampus (pr = –0.406, p = 0.012, Fig. 4E) and right hippocampus (pr = –0.297, p = 0.048, Fig. 4F) in the MCI group after adjusting for age, sex, and APOE genotype (FDR correction). A positive association was found between plasma BACE1 concentration and right hippocampal volume in the AD group (pr = 0.379, p = 0.042, uncorrected p value), however, it failed to pass the FDR correction.
Association between GMV in bilateral hippocampus and memory function
After controlling for age, sex, education, and APOE genotype, GMV of the left hippocampus was positively associated with AVLT-SR (pr = 0.334, p = 0.035) and recognition (pr = 0.459, p = 0.018) in the MCI group. GMV of the right hippocampus was positively associated with AVLT-LR (pr = 0.355, p = 0.048) and recognition (pr = 0.432, p = 0.015) in the MCI group, respectively (FDR correction) (Supplementary Figure 2).
The results of the mediation analysis are presented in Fig. 5. The association between BACE1 concentration and recognition scores was partially mediated by GMV in the left hippocampus (indirect effect = –0.006, 95% CI = –0.0159 to –0.0010, Fig. 5A). The GMV of the right hippocampus mediated the association between BACE1 concentration and recognition (indirect effect = –0.0048, 95% CI = –0.0144 to –0.0004, Fig. 5B) in patients with MCI.
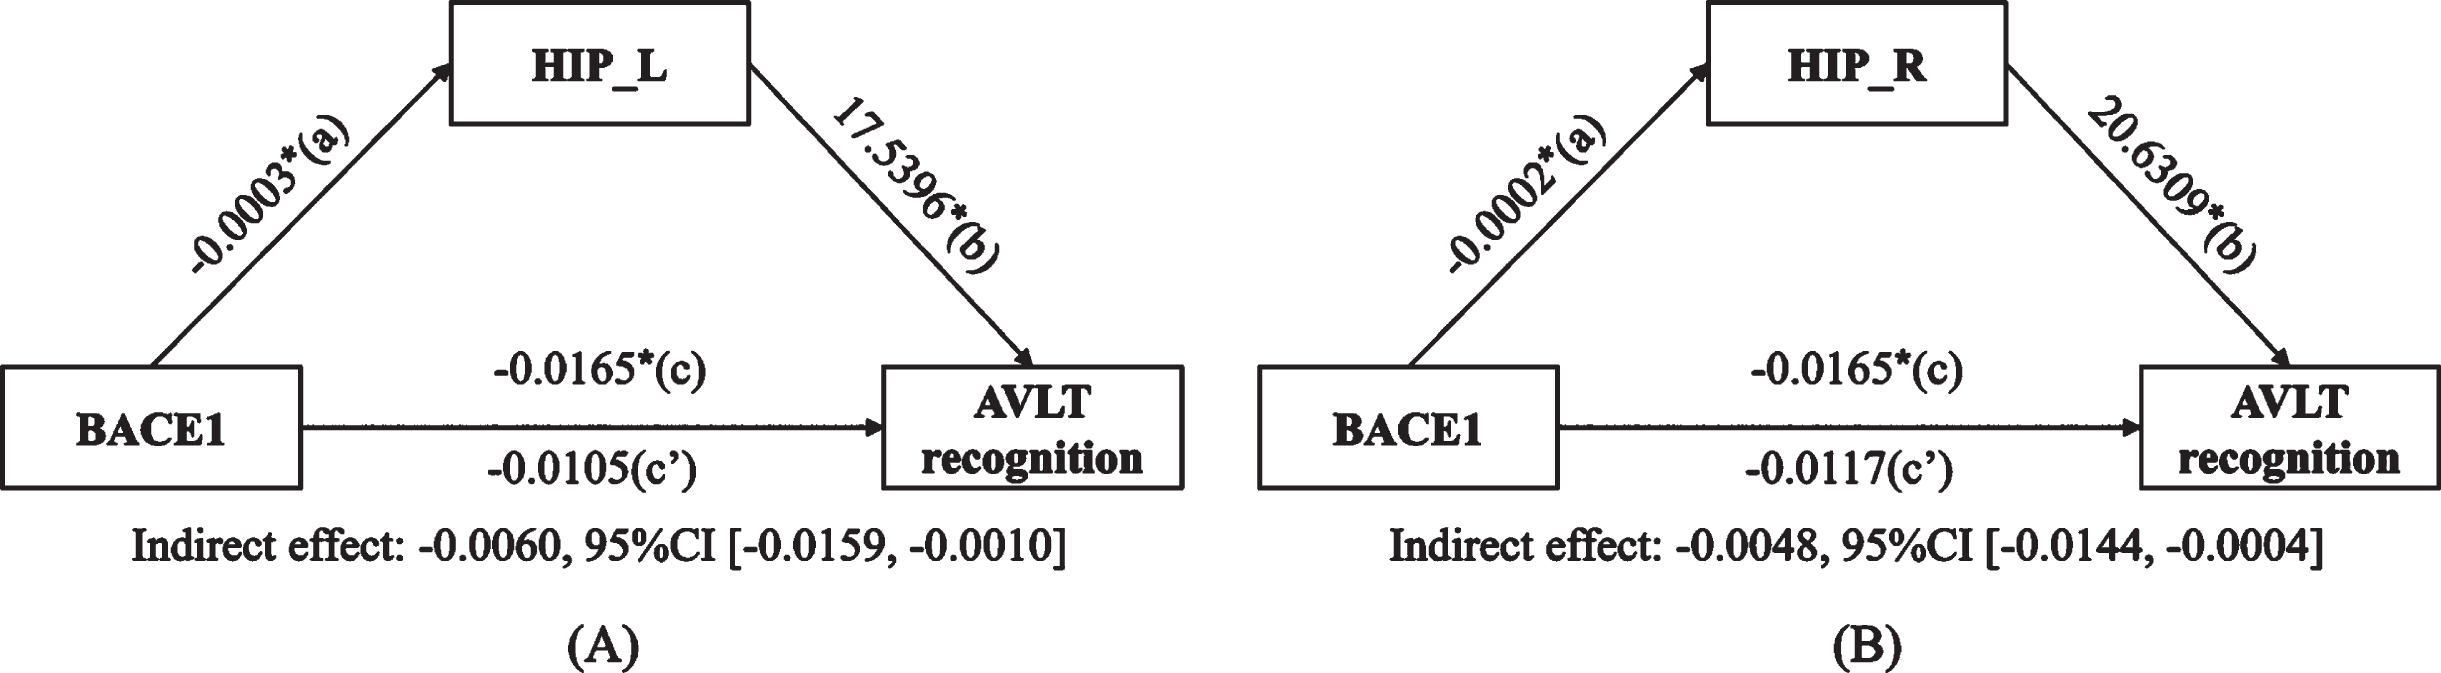
Mediation analysis among plasma BACE1, hippocampus volume, and cognition. A) Plasma BACE1 concentration (X), left hippocampus volume (M), AVLT recognition (Y). B) Plasma BACE1 concentration (X), right hippocampus volume (M), AVLT recognition (Y). (*p < 0.05). BACE1, β-site amyloid precursor protein cleaving enzyme 1; HIP_L, GMV of the left hippocampus; HIP_R, GMV of the right hippocampus; AVLT, auditory verbal learning test.
DISCUSSION
To the best of our knowledge, this study is the first to explore the relationship between plasma BACE1 concentration, episodic memory, and hippocampal atrophy at different stages of AD. First, patients with MCI and AD showed higher plasma BACE1 concentrations than those with normal cognition after adjusting for age, sex, and APOE genotype. Second, plasma BACE1 concentrations in the MCI group were negatively associated with immediate recall, delayed recall, and recognition scores of AVLT, as well as GMV of the bilateral hippocampus. Third, bilateral hippocampal volume mediated the relationship between BACE1 and recognition in the MCI group. These findings suggest that plasma BACE1 concentration may be associated with AD risk factors and cognitive symptoms in the early stage of AD.
Previous studies on pathology revealed that there was a slight increase in BACE1 expression and activity in both the post-mortem brain and CSF of AD patients, and accumulation of BACE1 was also observed in presynaptic terminals around amyloid plaques in mouse models and in the brain of AD [38 –40]. Notably, studies have shown that the expression of BACE1 is increased in the CSF, serum, or plasma in AD [9 , 41], which is consistent with our findings. In contrast, increases in plasma BACE1 concentration in dementia patients versus MCI patients and MCI versus healthy controls were reported in our study. Previous studies [13] showed that the increase in BACE1 concentration in the CSF was significant in the MCI group compared to the dementia and healthy control groups, even though the most significant decline in cognition was found in patients with dementia [42]. Meanwhile, a study found a significant increase in BACE1 plasma concentrations only in mild dementia [15]. Lower BACE1 concentrations were found in the late stage of AD, which may be due to advanced neuronal and synaptic loss [43]. A possible reason for the discrepancy with the results of these studies is that the enrolled patients had mild to moderate dementia, while severe dementia was excluded due to lack of cooperation.
We demonstrated that BACE1 concentration was negatively associated with memory function and hippocampal volume and that the hippocampus acted as a mediator between BACE1 and memory function in the MCI group. The mediating role of the hippocampus between other biomarkers and cognition has been studied; hippocampal volume mediates the relationship between Aβ and cognition in patients with MCI [20 –22]. Hippocampal atrophy is an early imaging biomarker for AD diagnosis [44] because of early intraneuronal Aβ deposition in the hippocampus [45], and is closely related to cognitive processing and memory function [46]. Similar to previous studies, which suggested that hippocampal volume is associated with BACE1 concentration [36] and activity [17], we found a negative association between plasma BACE1 concentration and hippocampal volume. AVLT is a highly sensitive measure of episodic memory decline in AD and is correlated with hippocampus volume [47], which is consistent with our results. BACE1 is responsible for the first cleavage step in the generation of Aβ peptides from AβPP [5]. We speculated that accumulation of Aβ in the brain is the main driving force for AD pathogenesis [48], and higher BACE1 concentration was related to increased Aβ deposition, especially in the hippocampus [45], which may directly result in poor memory [49]. The negative correlation between BACE1 and hippocampal volume, coupled with the current understanding of AD pathophysiology, suggests that BACE1 and its downstream pathways may affect anatomic-functional synaptic hubs in the hippocampus. A postmortem study of patients with sporadic AD showed increased expression of BACE protein and activity in the hippocampus and temporal lobe, which is associated with Aβ deposition in the brain [40]. In the INSIGHT-preAD cohort, plasma BACE1 concentration was positively associated with levels of brain Aβ accumulation, assessed by Aβ positron emission tomography measures [10]. Moreover, another study revealed that BACE1 levels and activity in the CSF were positively correlated with total tau and hyperphosphorylated tau levels, suggesting that the recorded alterations in BACE1 levels were correlated with cell death and neurodegeneration [41, 50]. Based on the results of previous studies [10 , 50], we speculated that increased plasma BACE1 concentration strongly initiates or triggers Aβ-related pathological cascades and neuronal degeneration, contributing to neuronal death and regional atrophy in the bilateral hippocampus, further affecting memory in patients with early stage of AD.
We found a correlation and mediation effects of BACE1 with cognition and GMV of the hippocampus in the MCI group, but not in the dementia group. We speculate possible reasons for this finding. First, several reports have indicated increasing BACE1 concentrations and/or activity in MCI [9, 51] and AD patients [11 , 40], which is consistent with our results that BACE1 concentration was correlated with disease severity and levels of neuronal degeneration. In contrast, studies [13 , 16] showed that BACE1 concentration and/or activity was higher in the MCI group than in the AD group. When AD develops to the late stage, there may be a large amount of neuronal and synaptic loss, resulting in decreased BACE1 production [43]. Thus, BACE1 levels may be higher in patients with MCI and may differ in various stages of AD. Second, the correlations between BACE1 concentration and cognition were more significant in the MCI group, whereas no statistical significance was found in the AD group. However, the correlation remained significant when correlations were performed in patients with MCI and AD in total, which suggested that BACE1 concentration could already start to increase in MCI and early stage of AD, which demonstrated that BACE1 may, to some extent, reflect cognitive impairment and neuronal injury in AD [18, 50]. The lack of correlation in the AD group may be due to the small sample size. Third, patients in the dementia group had lower understanding and reaction ability, which may have led to inaccurate assessment and negative results; therefore, BACE1 concentration has better diagnostic value in the MCI group. Taken together, BACE1 may better reflect neuronal and synaptic loss in the MCI group and may have a better predictive effect as a causative factor in the early stage of AD. However, little has been reported about BACE1 concentration in the plasma of patients with different stages of AD, and further research on BACE1 protein in MCI compared with different stages of AD is anticipated.
Consistent with the findings of a previous study [16], compared with noncarriers, BACE1 concentrations were higher in APOE ɛ4 carriers than in non-carriers. The APOE ɛ4 allele is a major risk factor for AD. Several studies have suggested that the APOE ɛ4 genotype is associated with AD because of its role in the development of amyloid pathology [52]. A possible mechanism between BACE1 and APOE is that APOE ɛ4 is associated with elevated levels of certain cholesterol in the blood [53], and enhanced activity of β- and γ- secretase is associated with increased cholesterol levels [54, 55], suggesting that APOE ɛ4 may affect BACE1 by influencing lipid metabolism. However, the molecular pathway by which APOE genotype affects BACE1 protein expression needs to be further explored. Notably, after adjusting for age and sex, the association was not significant in multivariable linear regression. A possible explanation for this finding might be the small sample size. Moreover, a study suggested that BACE1 levels may be influenced by BACE1 allele polymorphisms [56], and we will consider this factor in our future study. We have not yet found a statistical difference in the MCI and dementia groups, although the results revealed that BACE1 concentrations were higher in the APOE ɛ4 genotype group. A previous study [11] suggested that sexual dimorphism affected BACE1 plasma concentration, yet we did not find an effect of sex on BACE1, either in the AD or CU groups, which may be due to our small sample size.
Currently, biomarkers play increasingly informative roles in phase II or III AD clinical trials, Aβ and tau proteins in the CSF and plasma are usually considered as biomarkers in outcome measures or entry criteria [57]. Currently, the results of phase III clinical trials of anti-amyloid compounds in patients with mild-to-moderate AD dementia have been disappointing. BACE1, as a promising blood-based candidate biomarker [58] has key enzymatic activity in the production of Aβ peptides by AβPP. Although BACE1 knockout trials strongly support the theory of BACE1 inhibitors, BACE1 appears to be associated with synaptic functions. Thus, BACE1 physiological functions may limit its use as a therapeutic target for AD [59]. In addition, regardless of the substantiated rationale, all human clinical trials developing bioactive molecules targeting BACE1 and decreasing its enzymatic activity reported safety and tolerability challenges or failed to achieve significant primary efficacy endpoints [60]. Given the current disappointing AD disease-modifying therapy (DMT) trials, we considered BACE1 as a biomarker of therapeutic efficacy, for example, stratifying DMT treatment according to BACE1 concentration. Despite the frequent failures of DMT drug trials with BACE1 inhibitors in recent years, BACE1 remains a valuable biomarker, similar with amyloid and tau proteins. Furthermore, the use of BACE1 as a plasma biomarker has many benefits. As a plasma biomarker, BACE1 is cheap and easily accessible, and it can react with pathological processes related to the upstream mechanism of Aβ production. Plasma BACE1 concentration might be employed in DMT clinical trials for subject screening, selection, and stratification as well as for validating target engagement and mechanisms of action.
However, this study has several limitations. First, due to the absence of CSF and positron emission tomography imaging, the diagnosis of probable AD in our study was based on the 2011 diagnostic criteria [24] rather than the diagnostic criteria of “ATN” in 2018. Therefore, we were unable to explore the relationship between BACE1 and Aβ deposition in the brain. Second, the sample size of the patients group was relatively small, and patients with severe dementia were not included because of the lack of cooperation. Third, the expression of BACE1 may also be modulated by BACE1 allele polymorphisms [61], and we will further explore the impact of alleles on plasma BACE1 concentrations. Finally, a longitudinal study on alterations in the concentration of plasma BACE1 in patients needed to be performed, to investigate the ability to predict the conversion of MCI to AD.
Conclusion
The concentration of plasma BACE1 was significantly increased in the MCI and dementia groups, and BACE1 was closely related to cognition and hippocampal atrophy in patients with MCI, which may be used as a potential biomarker for early AD. Our study demonstrated a potential role for plasma BACE1 concentration as a useful peripheral diagnostic and mechanistic biomarker in the prodromal cognitive decline to the AD dementia continuum. This may represent a reliable indicator that improves the early detection of AD and facilitates the early initiation of DMT.
Footnotes
ACKNOWLEDGMENTS
We would like to thank all participants in this study and their supportive families. We also thank the research group in the Neurology Department of First Affiliated Hospital of Anhui Medical University.
FUNDING
This study was supported by the Key Research and Development Projects of Anhui Province (202104j07020031), the Natural Science Foundation of Anhui Province (1908085QH322), and the Basic and Clinical Cooperative Research Promotion Plan of Anhui Medical University (2020xkjT026).
CONFLICT INTEREST
The authors have no conflict of interest.
DATA AVAILABILITY STATEMENT
The data supporting the findings of this study are available on request from the corresponding author. The data are not publicly available due to privacy or ethical restrictions.