
Abstract
Background:
Associations between epigenetic aging with cognitive aging and neuropsychiatric measures are not well-understood.
Objective:
1) To assess cross-sectional correlations between second-generation DNA methylation (DNAm)-based clocks of healthspan and lifespan (i.e., GrimAge, PhenoAge, and DNAm-based estimator of telomere length [DNAmTL]) and cognitive and neuropsychiatric measures; 2) To examine longitudinal associations between change in DNAm markers and change in cognition over 2 years.
Methods:
Participants were members of VITAL-DEP (VITamin D and OmegA-3 TriaL- Depression Endpoint Prevention) study. From previously ascertained cognitive groups (i.e., cognitively normal and mild cognitive impairment), we randomly selected 45 participants, aged≥60 years, who completed in-person neuropsychiatric assessments at baseline and 2 years. The primary outcome was global cognitive score (averaging z-scores of 9 tests). Neuropsychiatric Inventory severity scores were mapped from neuropsychiatric symptoms (NPS) from psychological scales and structured diagnostic interviews. DNAm was assayed using Illumina MethylationEPIC 850K BeadChip at baseline and 2 years. We calculated baseline partial Spearman correlations between DNAm markers and cognitive and NPS measures. We constructed multivariable linear regression models to examine longitudinal relations between DNAm markers and cognition.
Results:
At baseline, we observed a suggestive negative correlation between GrimAge clock markers and global cognition but no signal between DNAm markers and NPS measures. Over 2 years: each 1-year increase in DNAmGrimAge was significantly associated with faster declines in global cognition; each 100-base pair increase in DNAmTL was significantly associated with better global cognition.
Conclusion:
We found preliminary evidence of cross-sectional and longitudinal associations between DNAm markers and global cognition.
INTRODUCTION
Aging is the strongest known risk factor for dementia [1]. Variation in epigenetic aging has been associated with age-related morbidities including dementia [2, 3]; yet less is known about the interface between epigenetic aging and cognitive aging. Understanding the epigenetic mechanisms through which biological aging processes may affect cognitive function could yield advances in prevention and treatment of dementia.
The second-generation DNA methylation (DNAm)-based epigenetic clocks of healthspan and lifespan, such as PhenoAge [4], GrimAge [5], and DNAm-based estimator of telomere length (DNAmTL) [6], outperform former DNAm clocks (e.g., Horvath’s DNAmAge clock, Hannum’s clock) in predicting numerous age-related morbidities [7]. Few epigenetic studies have examined relations of second-generation DNAm markers to cognitive function (e.g., verbal memory, executive function/attention) in older adults [8–13]; data are limited regarding whether changes in second-generation DNAm markers can be associated with longitudinal changes in cognitive function among community-dwelling older adults. Filling these knowledge gaps could advance understanding of how different paths in biological aging relate to cognitive aging and decline.
Neuropsychiatric symptoms (NPS) are highly prevalent in the ADRD (Alzheimer’s disease and related dementias) spectrum and even appear in the pre-clinical and early stages [14, 15]. Cognitive impairment accompanied by NPS versus without NPS may also relate to higher risk for worse cognitive outcomes [14]. While clinical-level behavioral symptoms or disorders have been significantly related to other aging biomarkers, such as telomeres [16, 17], less is known about the association between epigenetic aging and NPS among persons across the ADRD spectrum. Additionally, data on genome-wide differences in DNAm at specific CpG sites (i.e., leading to differences in gene expression) that may underlie variations in MCI with versus without NPS or in MCI versus CN could yield novel mechanistic insights into the development of cognitive and neuropsychiatric phenotypes.
Thus, we conducted a pilot study of biological aging and cognition by leveraging high-dimensional molecular and phenotypic data. Our study objectives were two-fold: 1) examine cross-sectional correlations between second-generation DNAm-based epigenetic markers and cognitive and neuropsychiatric measures; 2) examine longitudinal associations between changes in DNAm markers and changes in global and domain-specific cognitive functions over 2 years. Exploratorily, we assessed genome-wide differences in DNAm among persons with contrasting cognitive and neuropsychiatric phenotypes.
METHODS
Source of participants and samples
Participants were members of VITAL-DEP (VITamin D and OmegA-3 TriaL-Depression Endpoint Prevention), a late-life depression prevention ancillary study to the VITAL trial; protocol details of VITAL and VITAL-DEP are published elsewhere [18, 19]. VITAL is a completed 2x2 factorial trial of vitamin D and/or marine omega-3 fatty acids (omega-3) supplements for prevention of cardiovascular disease and cancer in 25,871 men and women, aged 50 + and 55 + years, respectively. VITAL established a Clinical Translational Science Center (CTSC) sub-cohort of 1,054 men and women, all of whom were participants in the main trial, who presented for in-person health assessments at baseline and 2-year follow-up. Among these CTSC participants, VITAL-DEP established a subset of 1,046 participants who completed comprehensive neuropsychiatric assessments at baseline and 2 years, as described elsewhere [18]. Participants provided blood samples at baseline and follow-up CTSC visits.
Previously, we ascertained cognitive status in VITAL-DEP CTSC participants at baseline and 2 years. From previously ascertained cognitive groups (i.e., cognitively normal [CN] and mild cognitive impairment [MCI]), we randomly selected 45 VITAL-DEP CTSC participants [aged≥60 years; 20 with CN status and 25 with MCI] who completed cognitive assessments and had at least 1μg of extracted genomic DNA available for DNAm assay at baseline and 2 years; the sample was balanced by 10-year age groups and sex across cognitive groups. All participants provided written informed consent, and study approvals were obtained from the institutional review board of Mass General Brigham.
Ascertainment of cognitive function status, cognitive outcomes, and neuropsychiatric symptoms
We determined MCI status using the consensus diagnostic method similar to that of the Uniform Dataset protocol [20–22], as implemented by the Alzheimer’s Disease Research Center programs. VITAL enrolled generally healthy and high-functioning men and women; thus, as in prior work [23, 24], we applied the 1.5 standard deviation (SD) below-expected mean cut-point criterion for cognitive test performance to define MCI status in this sample. CN status was determined among those who had no subjective cognitive concerns, had no objective evidence of cognitive impairment, and did not meet the consensus diagnostic criteria for MCI.
The VITAL-DEP CTSC protocol featured in-person detailed neuropsychiatric assessments at baseline and 2 years, as detailed elsewhere [18, 25]. The cognitive battery included nine tests assessing general cognition (Modified Mini-Mental State (3MS; range = 0–100) [26], immediate and delayed verbal memory [27, 28], category fluency [29], executive function and attention) [30]. The primary cognitive outcome was a global cognitive score (averaging z-scores of all tests). Secondary cognitive outcomes were general cognition (3MS score), verbal memory (averaging z-scores of 4 tests: immediate and delayed recalls of both a 10-word list and the East Boston Memory Test), and executive function/attention [averaging z-scores of trail-making tests A and B and 2 category fluency tests (naming animals and vegetables)].
We identified neuropsychiatric symptoms (NPS) at baseline by leveraging both the self-reported psychological scales [e.g., Patient Health Questionnaire (PHQ)-9 [31] for depressive symptoms; Generalized Anxiety Disorder (GAD)-7 [32] for anxiety symptoms] and item-level symptom features from the modules of the Mini International Neuropsychiatric Interview (MINI) [33]. We mapped these symptoms to the Neuropsychiatric Inventory-Questionnaire (NPI-Q) [34] and created an NPI severity score. The presence of NPS was determined using a cut-off of≥2 points on the NPI severity score.
DNA methylation assay and analysis
Genomic DNA was extracted from peripheral blood leukocytes (buffy-coat cryotubes had been stored in the vapor phase of liquid nitrogen freezers at ≤–130°C for later use) using the QIAamp® DNA Blood Mini Kit (Qiagen Inc., Valencia, CA) and PicoGreen DNA quantitation was performed using a Molecular Devices 96-well spectrophotometer. DNA methylation assays on selected samples and quality controls (QCs) were conducted using Illumina Infinium MethylationEPIC BeadArray technology (Methyl850K chip) that allows genome-wide DNA methylation analysis of 866,836 CpG sites; assay details are described elsewhere [35]. To assess QC of the DNA methylation assays, we included four blinded samples randomly placed on the plate, in duplicate for testing of QC replicates, and one in-lab genotyping control. CpG methylation values in the n = 4 pairs of QC replicates were highly correlated (r≥0.95). All samples passed the QC threshold, and biological sex (X, Y chromosome) was correctly identified. Regarding DNA methylation analysis, we used the minfi Bioconductor package in R for processing functions (performing background correction using negative control probe signal intensities, as well as normalization and correction of dye imbalance) and analyzing the Illumina 850k methylationEPIC data [36, 37]. Probes with a mean detection p-value higher than 0.05, cross-reactive probes, non-CpG probes, and probes bound to SNP (Single Nucleotide Polymorphisms) sites were excluded for downstream analysis. Beta values were normalized using Noob-normalization with the minfi package in R. We computed the second-generation DNAm-based epigenetic markers of lifespan and healthspan—DNAmPhenoAge, DNAmGrimAge, and DNAmTL—using an online age calculator developed by Horvath and colleagues (https://dnamage.genetics.ucla.edu/) [38]. DNAmPhenoAge is a DNAm-based aging biomarker that utilizes 513 CpGs to predict multifactorial phenotypic age of an individual [4]. DNAmGrimAge, a composite of 12 sub-DNAm-measures that utilizes 1,030 CpGs to predict lifespan and all-cause mortality [5]. DNAmTL uses 140 CpG sites to estimate telomere length in kilobase pairs [6]. Additionally, age-accelerated versions of these 3 clocks (i.e., AgeAccelPheno, AgeAccelGrim, DNAmTLadjAge) can be computed by regressing epigenetic age on chronological age.
Statistical analyses
Descriptive characteristics were shown in the total sample and by cognitive groups. For comparisons, we used Wilcoxon rank sum tests for continuous variables and Fisher exact tests for proportions. We computed Spearman rank correlations between second-generation DNAm markers and chronological age. We computed Spearman partial correlations between DNAm markers and global and domain-specific cognitive scores at baseline; estimates were adjusted by age, sex, estimated blood cell types [i.e., naïve CD8 + T cells, exhausted cytotoxic CD8 + T cells (defined as CD8 positive CD28 negative CD45 R negative), CD4 + T cells, plasma blasts, natural killer cells, monocytes, and granulocytes] [39, 40], body mass index (BMI), cigarette smoking, and Charlson-Deyo comorbidity index [41, 42]. Similarly, we computed partial Spearman correlations between DNAm markers and NPS measures (i.e., PHQ-9, GAD-7, NPI severity score). We performed multivariable linear regression analyses to determine the longitudinal associations between 2-year change in DNAm epigenetic markers and 2-year change in global and domain-specific cognitive scores; we used Δperformance (i.e., cognitive performance at follow-up – cognitive performance at baseline) as the outcome and ΔDNAm as the exposure. Of note, the slope coefficient estimating the magnitude of longitudinal change in primary DNAm clock markers and change in cognitive function (ΔDNAm → Δperformance) is identical to the slope coefficient estimating the magnitude of longitudinal change in age-accelerated versions of DNAm marker and change in cognitive function (ΔAgeAccelDNAm → Δperformance). For simplicity, we present only the regression estimates of longitudinal change in primary DNAm clock markers and cognitive change. Models were adjusted for chronological age, sex, estimated blood cell types, BMI, cigarette smoking, and Charlson-Deyo comorbidity index. Regression coefficients (β) and 95% confidence intervals (CIs) are presented.
Post-hoc analyses
First, we computed Spearman-rank correlations between second-generation DNAm markers and cognitive outcomes according to baseline cognitive status. Second, we used general linear models of response profiles to relate baseline DNAm markers with cognitive change over 2 years. Third, as in prior work [35], we conducted an exploratory analysis of genome-wide differences in DNAm in these contrasting groups: 1) MCI versus CN; 2) MCI without NPS versus MCI with NPS; 3) CN with NPS versus CN without NPS; 4) NPS versus no NPS; ‘DMPFinder’ function in the minfi R package was used. Over-representation analysis was conducted, and annotation was performed using the Database for Annotation, Visualization and Integrated Discovery (DAVID) [43].
Results of secondary cognitive outcomes or post-hoc analyses were not adjusted for multiple hypothesis testing; findings from these analyses are considered exploratory and interpreted with caution. A two-tailed p-value<0.05 was used for statistical significance. All statistical analyses were performed with SAS version 9.4 (SAS, Cary, NC) and R.
RESULTS
Baseline characteristics
Participants’ mean age (standard deviation) was 69.8 (5.5) years and 48.9% were females. Of the n = 45 sample participants, there were 39 non-Hispanic white, 3 Black, and 3 Asian participants. Descriptive characteristics in the total sample and by cognitive groups are shown in Table 1. At baseline, participants with MCI, compared to CN, had significantly lower body mass index (BMI) and lower global and domain-specific cognitive scores. No differences were observed in DNAm-based epigenetic markers by cognitive phenotypes. PHQ-9, GAD-7, and NPI severity scores appeared similar in MCI and CN groups. The prevalence of NPS (≥2 NPI severity score) was 28.9% in this sample. Distributions of estimated blood cell types were similar in both groups except for naïve CD8 + T cells, Plasma blasts, and granulocytes. Figure 1 shows the scatterplot data and Spearman rank correlations between chronological age and second-generation DNAm-based epigenetic markers. DNAmGrimAge had the strongest positive correlation with chronological age [Spearman rho (ρ)=0.84, p < 0.001], followed by DNAmPhenoAge [ρ=0.65, p < 0.001]. There was a significant negative correlation between DNAmTL and chronological age [ρ=-0.57, p < 0.001].
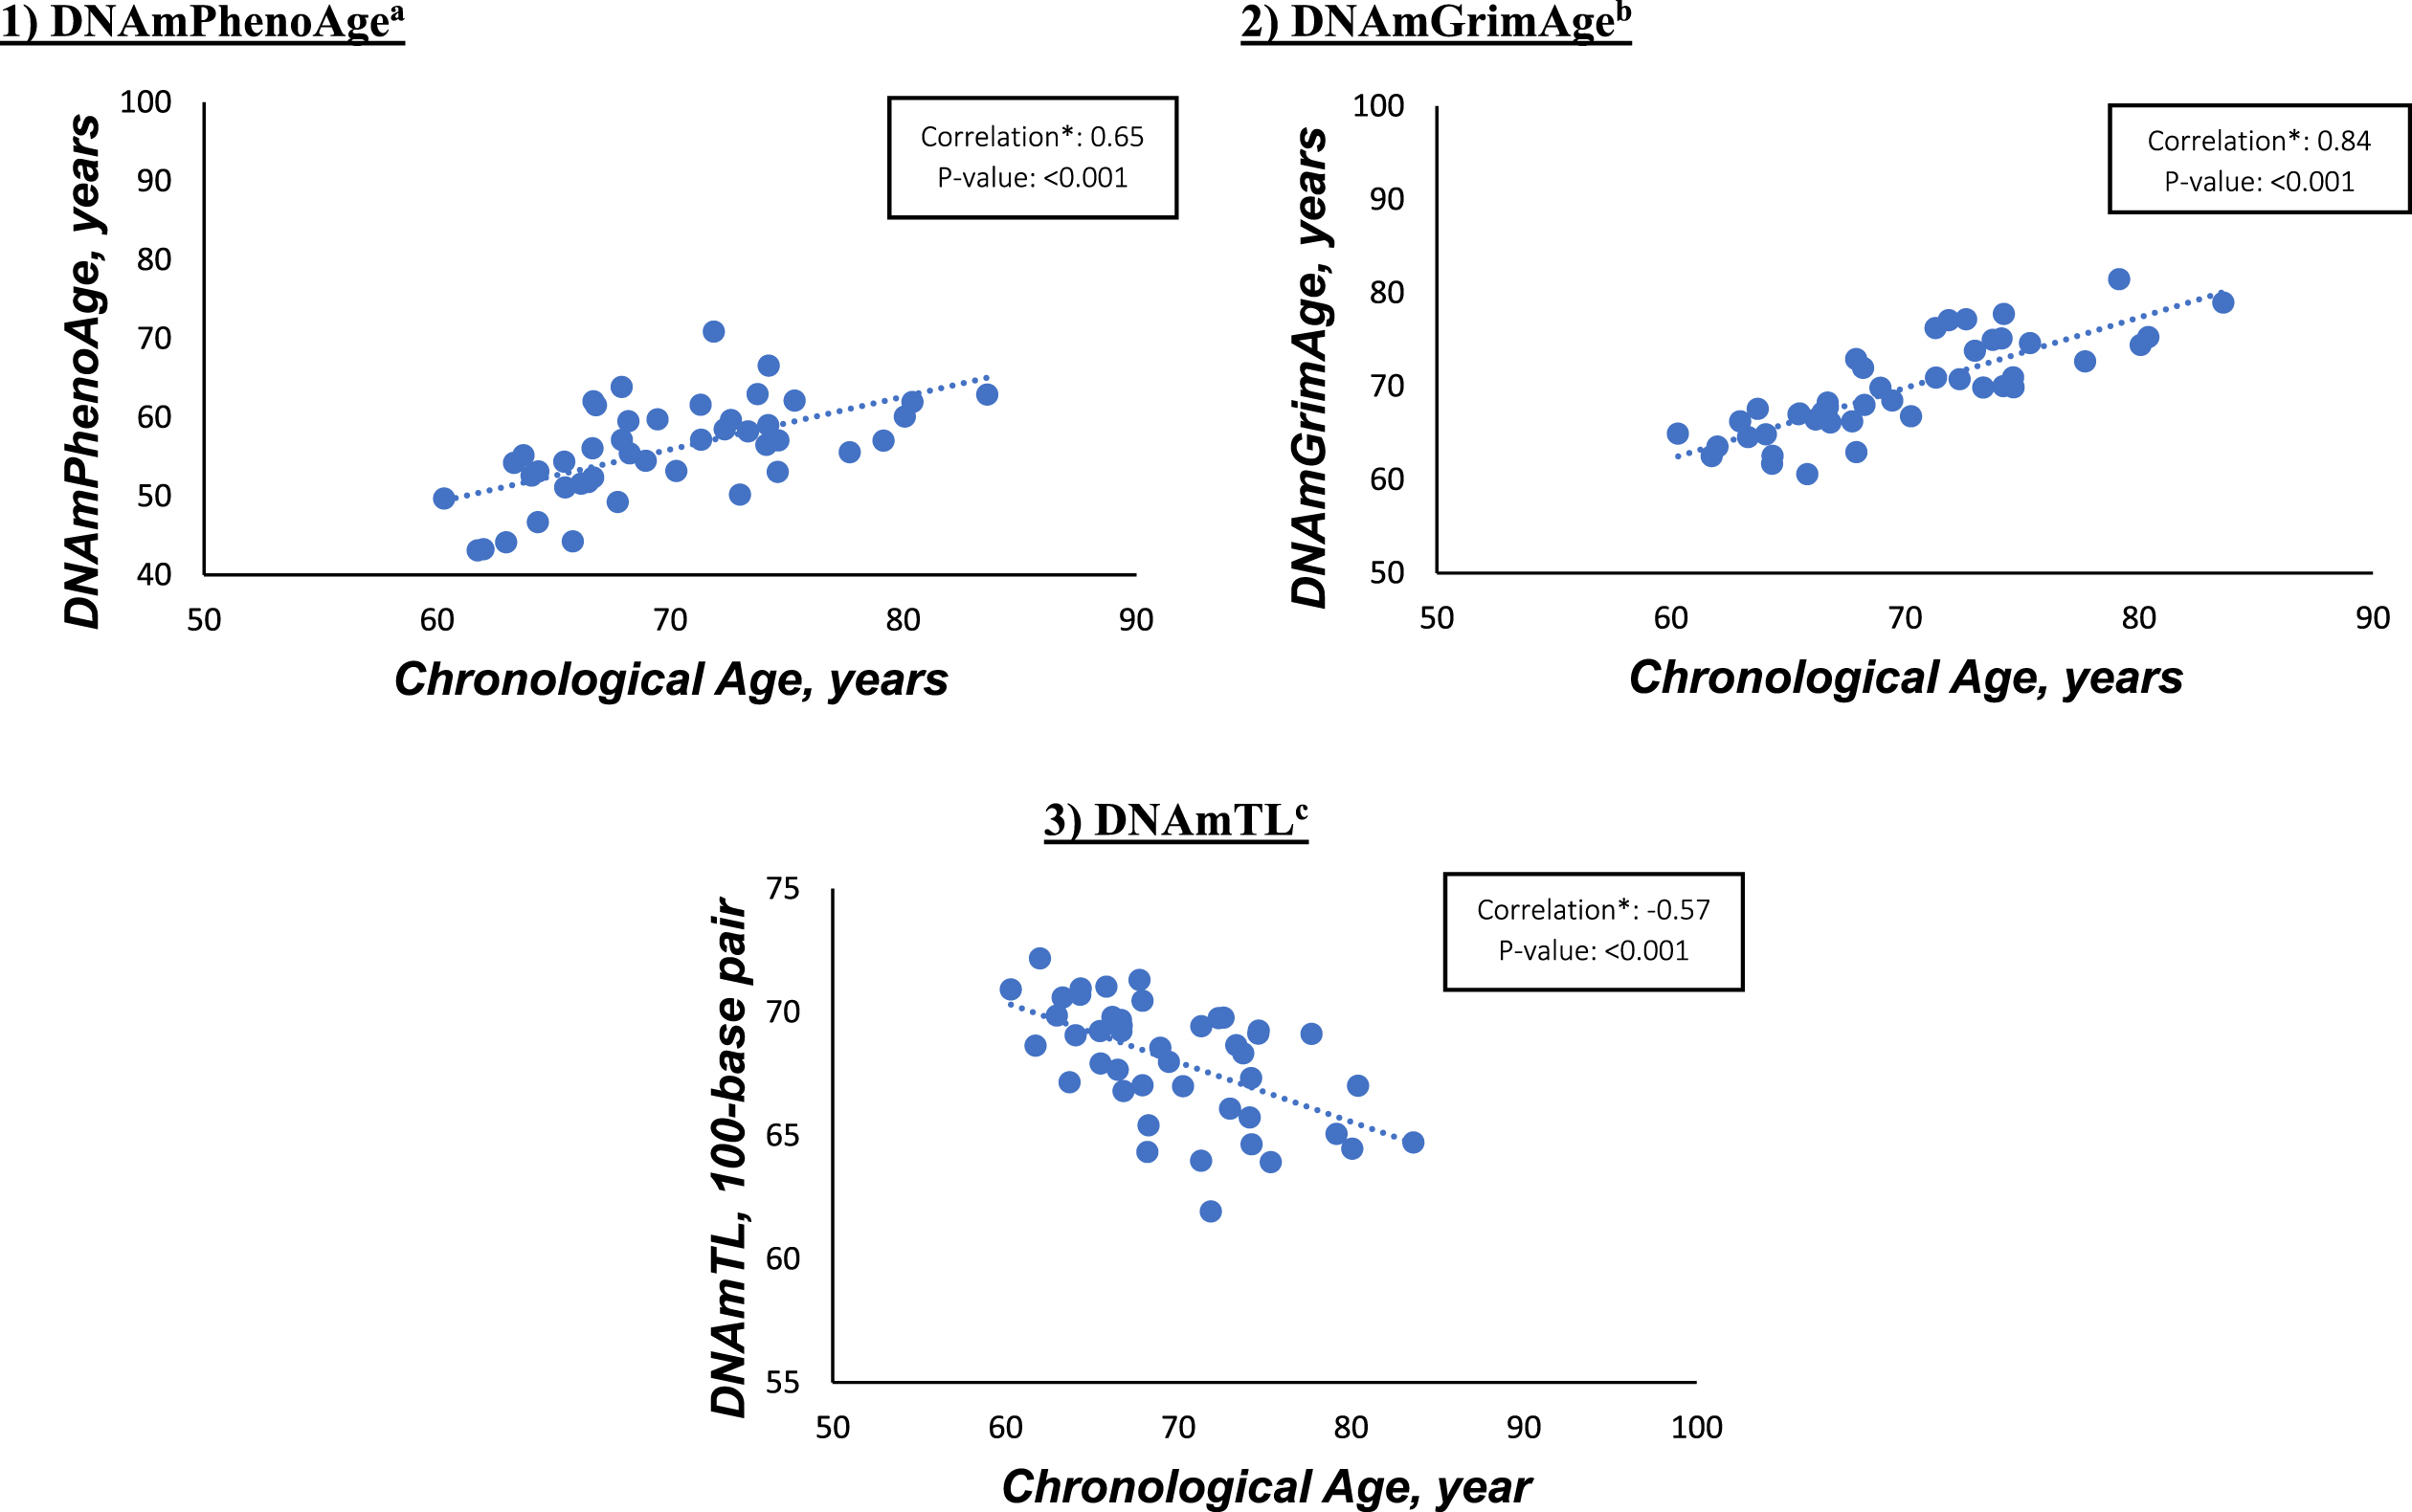
Spearman rank correlations between chronological age and second-generation DNAm markers at baseline. DNAm, DNA methylation. aDNAmPhenoAge is a validated novel epigenetic clock that predicts varying aging outcomes, including all-cause mortality, cancers, healthspan, physical functioning, and Alzheimer’s disease [4]. bDNAmGrimAge is a validated novel DNAm biomarker which predicts lifespan and all-cause mortality [5]. cDNAmTL is a DNA methylation measurement of telomere length (unit is per 100-base pairs) [6].
Participant characteristics in the total sample, and by cognitive groups
CN, cognitively normal; MCI, mild cognitive impairment; DNAm, DNA methylation; SD, standard deviation; IQR, interquartile range; BMI, body mass index; MET, metabolic equivalent of task; 3MS, the modified mini-mental state; PHQ, patient health questionnaire; GAD, generalized anxiety disorder; NPS, neuropsychiatric symptoms; NPI, neuropsychiatric inventory. aFor comparisons, we used the Wilcoxon-rank sum test for continuous variables and Fisher exact test for categorical variables. bLeisure-time physical activities include walking or hiking; jogging; running; bicycling; aerobic exercise/aerobic dance/exercise machines; lower intensity exercise/yoga/stretching/toning; tennis/squash/racquetball; lap swimming; weightlifting/strength training; other exercise. cThe Charlson-Deyo comorbidity index is a weighted comorbidity score derived from the sum of the scores for each of several major medical comorbid conditions; participants were categorized as having 0 and 1 or more points [41, 42]. dThese are ordinal abundance measures of cell counts estimated in the Epigenetic clock by Horvath and colleagues. The abundance of I CD8 + T cells, exhausted CD8 + T cells, and plasma blasts were derived using the Horvath method [39]. The natural killer cells, monocytes, and granulocytes were derived using the Houseman method [40]. eExhausted CD8 + T cells were defined as CD8 positive CD28 negative CD45 R negative [39]. fDNAmPhenoAge is a validated novel epigenetic clock that predicts varying aging outcomes, including all-cause mortality, cancers, healthspan, physical functioning, and Alzheimer’s disease [4]. AgeAccelPheno is an age-accelerated residual measure of DNAmPhenoAge, derived by regressing epigenetic age on chronological age. gDNAmGrimAge is a validated novel DNAm biomarker which predicts lifespan and all-cause mortality [5]. AgeAccelGrim is an age-accelerated residual measure of DNAmGrimAge, derived by regressing epigenetic age on chronological age. hDNAmTL is a DNA methylation measurement of telomere length (unit is per 100-base pairs) [6]. DNAmTLadjAge is an age-accelerated residual measure of DNAmTL, derived by regressing epigenetic age on chronological aIe. iGlobal cognition score is a composite score for the mean of the z-scores of all cognitive tests. jVerbal memory score is a composite score for the mean of the z-scores of 4 tests: the immediate and delayed recalls of both the 10-word list and the East Boston Memory Test. kExecutive function/attention score is a composite score for the mean of the z-scores of 4 tests: trails making tests A and B, and category fluency tests (naming animals and vegetables).
Cross-sectional relations of DNAm markers with cognitive and neuropsychiatric outcomes
Table 2 shows the partial Spearman rank correlations between second-generation DNAm-based epigenetic markers and cognitive outcomes after adjusting for chronological age, sex, estimated blood cell types, BMI, cigarette smoking, and Charlson-Deyo comorbidity index. We observed a signal of negative partial correlation between DNAmGrimAge and global cognitive score (ρ=-0.36; p = 0.04); partial correlations were similar between AgeAccelGrim and global cognitive score (ρ=-0.40; p = 0.02). There were no signals for partial correlations of DNAmPhenoAge, DNAmTL or their age-accelerated versions with global cognitive score.
Partial Spearman correlations between second-generation DNAm markers and cognitive outcomes at baseline (n = 45)
3MS, the Modified-Mini Mental State; DNAm, DNA methylation.
Regarding secondary cognitive outcomes, we observed a signal of negative partial correlations between DNAmGrimAge and executive function/attention (ρ=-0.32; p = 0.07); the estimate was similar between AgeAccelGrim and executive function/attention (ρ=-0.38; p = 0.03). There were no signals for cross-sectional associations between PhenoAge and DNAmTL clock measures with verbal memory and executive function/attention. In this sample, second-generation DNAm markers were not correlated with PHQ-9, GAD-7, and NPI severity scores (Supplementary Table 1).
Longitudinal relations of change in DNAm markers and change in cognitive outcomes
We observed significant longitudinal associations between changes in DNAm markers and changes in global cognition (Fig. 2). Each 1-year increase in DNAmGrimAge over 2 years was significantly associated with a faster 2-year decline in global cognitive score [adjusted β (95% CI): -0.09 (-0.15, -0.02); p = 0.02]. Furthermore, each 100-base pair increase in DNAmTL over 2 years was significantly associated with better global cognitive score over 2 years [adjusted β (95% CI): 0.15 (0.03, 0.28); p = 0.02]. There were no significant longitudinal associations between DNAmPhenoAge with global cognitive score. In secondary analyses, we observed variable, weak signals between changes in DNAm markers and changes in verbal memory and executive function/attention (Table 3).
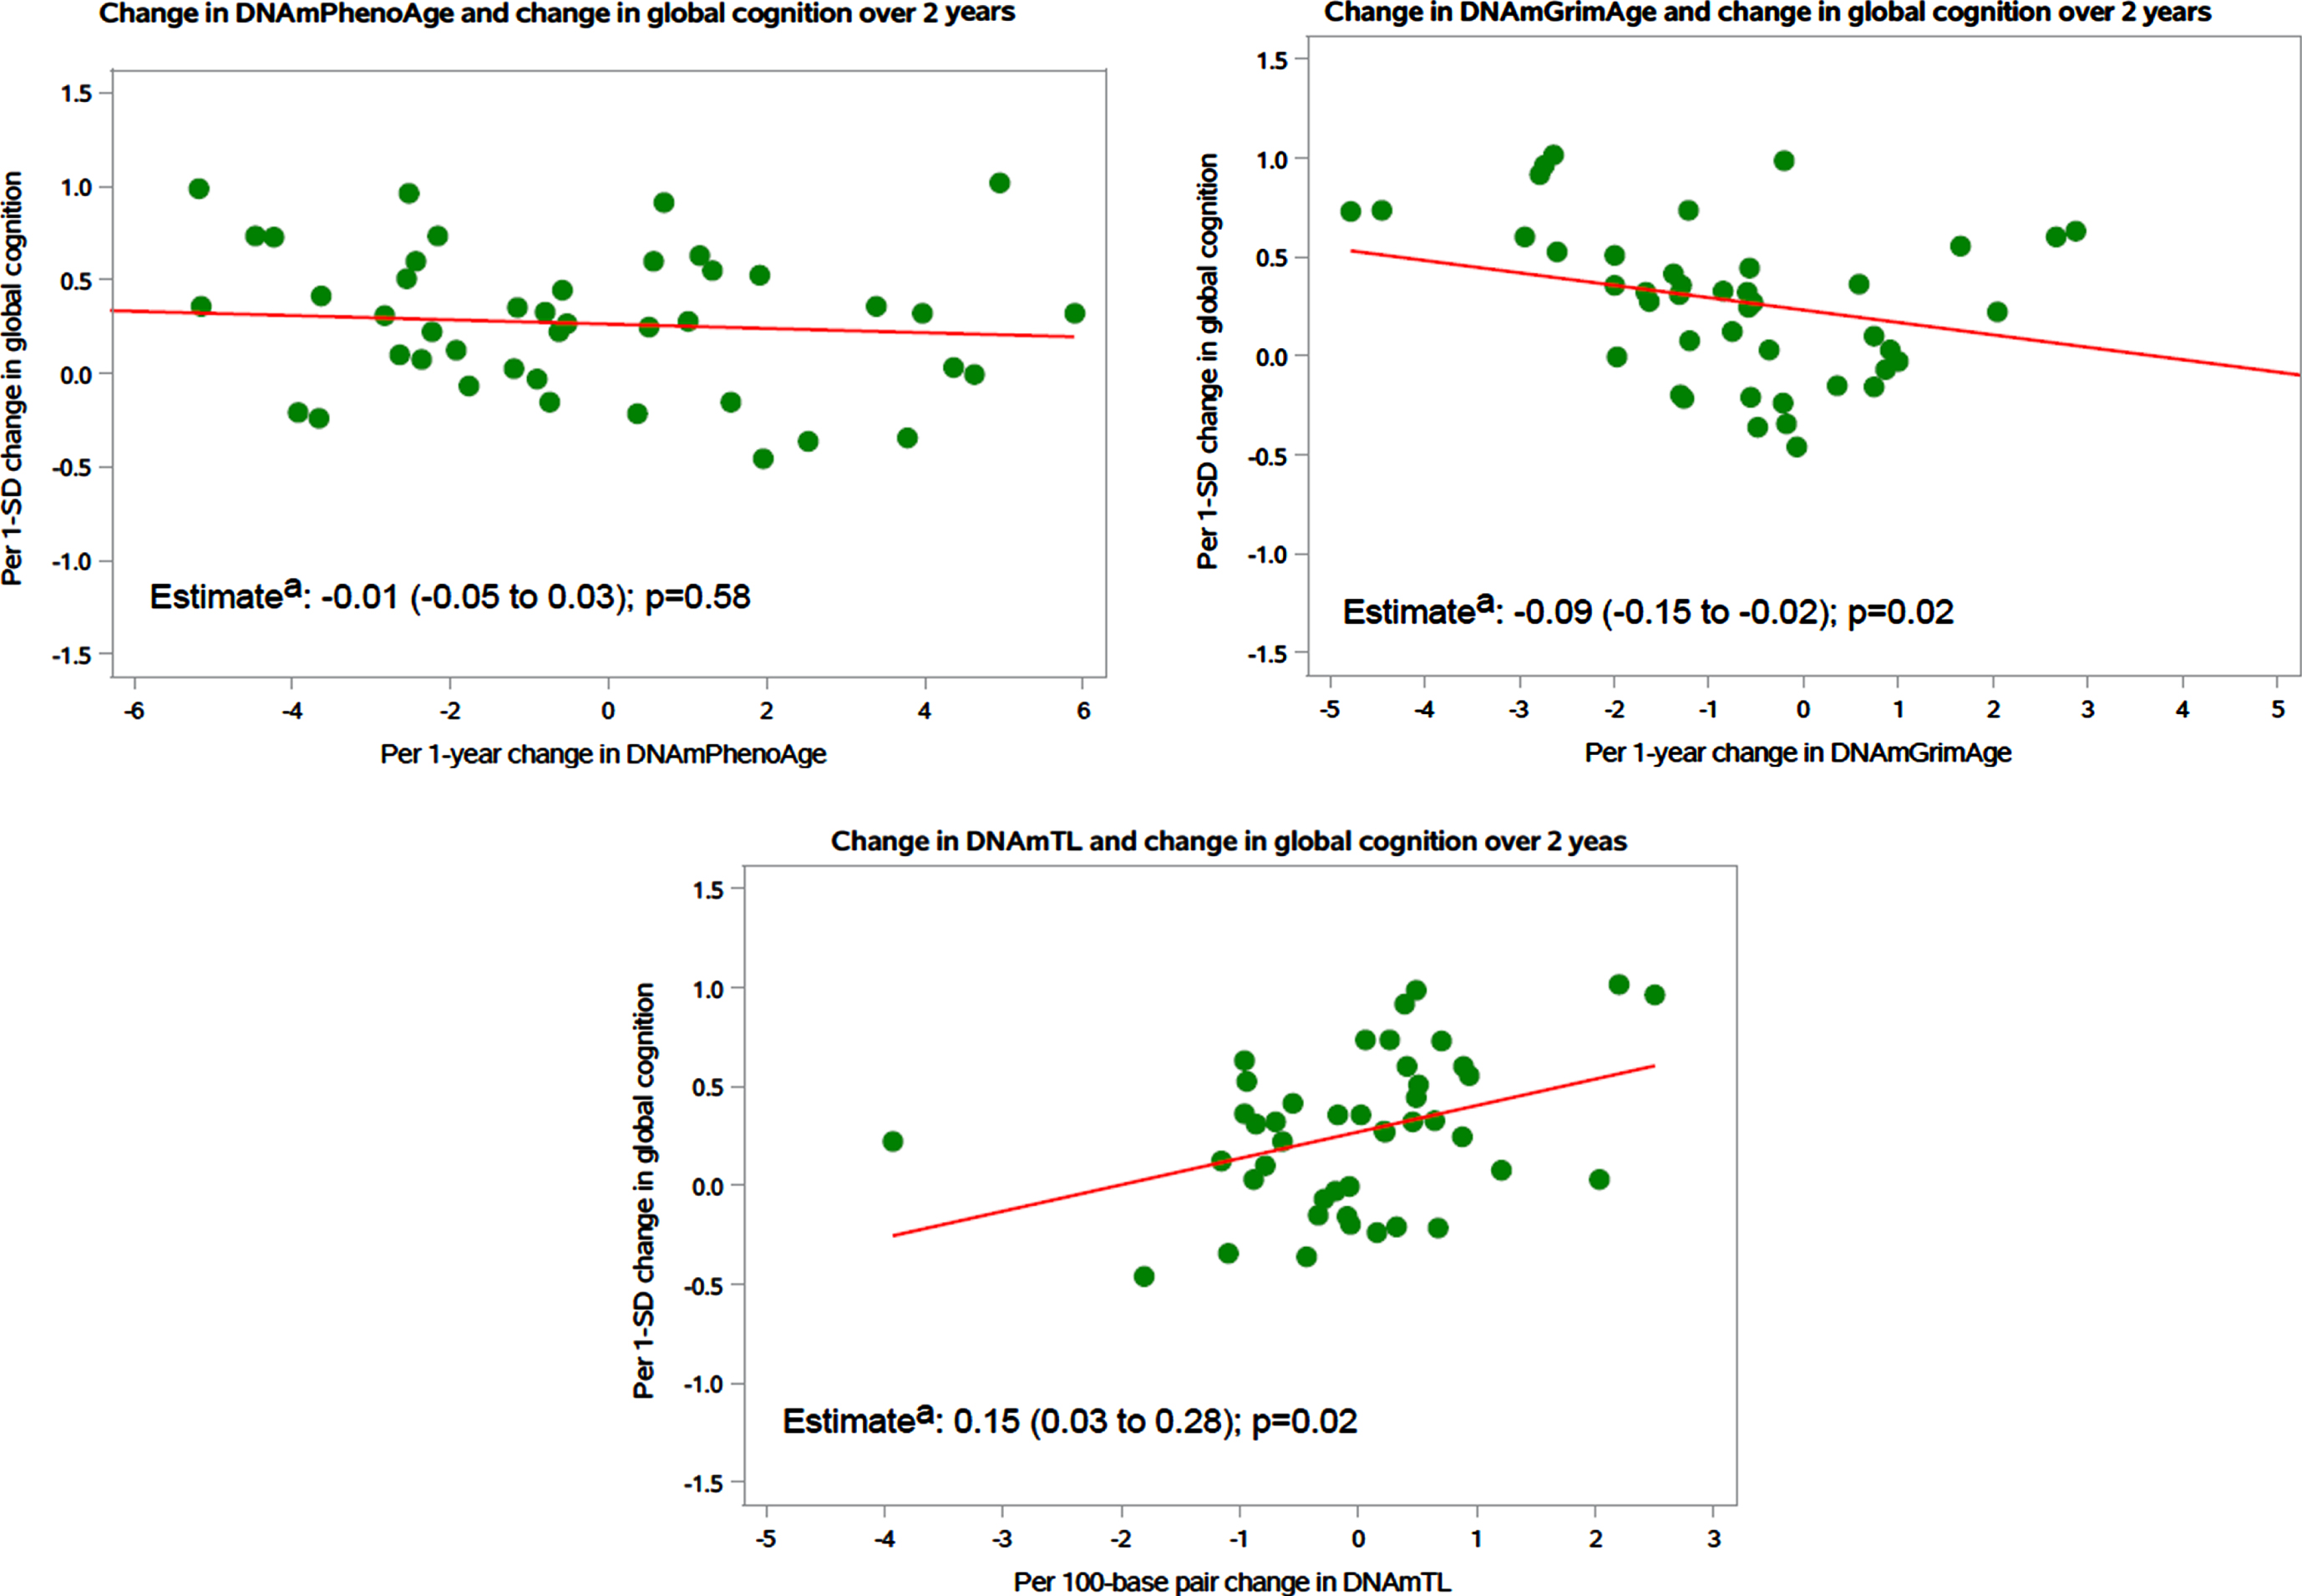
Association between 2-year change in DNAm marker and 2-year change in global cognition (n = 45). DNAm, DNA methylation; CI, confidence interval aRegression estimates and 95% CIs showed in the figures; models were adjusted by chronological age, sex, blood cell proportions, body mass index, cigarette smoking, and Charlson-Deyo comorbidity index.
Associations between 2-year change in second-generation DNAm markers and 2-year change in secondary cognitive outcome scores (n = 45)
DNAm, DNA methylation; 3MS, the Modified Mini-Mental State; CI, confidence interval. Results of secondary cognitive outcomes were not adjusted for multiple hypothesis testing; findings should be interpreted with caution. aDNAmPhenoAge is a validated novel epigenetic clock that predicts varying aging outcomes, including all-cause mortality, cancers, healthspan, physical functioning, and Alzheimer’s disease [4]. bDNAmGrimAge is a validated novel DNAm biomarker which predicts lifespan and all-cause mortality [5]. cDNAmTL is a DNA methylation measurement of telomere length (unit is per 100-base pair) [6]. dVerbal memory score is a composite score for the mean of the z-scores of 4 tests: the immediate and delayed recalls of both the TICS 10-word list and the East Boston Memory Test. eExecutive function/attention score is a composite score for the mean of the z-scores of 4 tests: trails making tests A and B, and category fluency tests (naming animals and vegetables).
Post-hoc analyses
First, results of partial correlations between second-generation DNAm markers and cognitive function scores stratified by baseline cognitive status are shown in Supplementary Table 2; there were modest signals of negative partial correlations of GrimAge clock markers with global cognition and verbal memory in the MCI group but not in the CN group. There were relatively stronger signals of positive correlations of DNAmTL with global cognition and executive function/attention scores in the MCI group but not in the CN group. Second, baseline second-generation DNAm markers were not associated with change in global and domain-specific cognitive function scores over 2 years (Supplementary Table 3). Third, preliminary results from exploratory analyses of genome-wide differences contrasting cognitive and neuropsychiatric phenotypes are included in Supplementary Tables 4 and 5; no CpGs surpassed the threshold for genome-wide significance (p < 5×10⁻⁸) in all comparisons. Exploratory results of potential biologic pathways underlying contrasts of MCI versus CN and MCI with versus without NPS are provided in the Supplement.
DISCUSSION
In this pilot study, chronological age was strongly correlated with DNAmGrimAge and moderately correlated with DNAmPhenoAge and DNAmTL. At baseline, we observed negative correlations between GrimAge clock measures with global cognition and executive function/attention. There were no signals for correlations between second-generation DNAm markers and their age-accelerated versions with PHQ-9, GAD-7, or NPI severity scores. Regarding DNAm-global cognition associations over 2-year follow-up: 1) each 1-year increase in DNAmGrimAge was significantly associated with faster decline in global cognition; 2) each 100-base pair increase in DNAmTL was significantly associated with better global cognitive scores. Secondarily, we observed a signal for longitudinal association between increase in DNAmGrimAge and faster declines in executive function/attention over 2 years. Exploratory genome-wide DNAm analysis revealed potential differences comparing MCI versus CN and MCI with versus without NPS.
The second-generation DNAm-based biomarkers of aging were developed recently with the objective of serving as biomarkers for healthspan and lifespan. While second-generation DNAm clocks have been associated with cognitive function and cognitive phenotypes [8–13, 44–46], this study provides new data regarding how changes in these DNAm markers are associated with changes in global and domain-specific cognitive function scores over time among community-dwelling older adults. Recently, a large prospective study found non-significant associations between accelerated second-generation DNAm with incident MCI and dementia [45]. However, differences in sample characteristics (MCI versus no MCI in the baseline sample), and the outcome under study (incident MCI versus cognitive change) limit comparisons between findings from the previous study and our current study.
In this pilot study, we observed accelerated cognitive decline in relation to a per-year increase in DNAmGrimAge and better cognitive change in relation to a per 100-base pair increase in DNAmTL; these results indicate significant correlations between changes in biological indicators of healthspan and lifespan and changes in cognitive function over time. For instance, epigenetic modifications are a prominent mechanism for controlling telomerase activity and regulating the TERT gene [47]. Additionally, experimental evidence suggests that early stages of age-related degenerative phenotypes could be reversed following the reactivation of endogenous telomerase activity [48]. Speculatively, it is possible that an increase in measured telomere length could reactivate telomerase activity through epigenetic modifications, thus, improving longitudinal cognitive function.
We observed no preliminary signals between second-generation DNAm markers and NPS measures in this sample. This pilot study included long-term trial participants who were generally healthy and high-functioning at baseline, and there was a relatively narrow range in PHQ-9, GAD-7, and NPI severity scores. It is also possible that peripheral blood methylation levels may not capture all epigenetic changes that might be related to complex neuropsychiatric manifestations; integration of brain tissue and cerebrospinal fluid could provide additional epigenetic information. Together, these issues may affect the ability to detect significant signals, as there was less variation in the sample than what might be seen in a larger or primarily clinical population. Finally, the exploratory analyses of genome-wide differences in DNAm in MCI versus CN and MCI with versus without NPS suggested some biological pathways (i.e., folate metabolism) reported in previous literature: e.g., altered one-carbon metabolism may impair DNA repair and methylation processes and contribute to microtubule-associated tau protein hyperphosphorylation – mechanisms implicated in the early stages of cognitive dysfunction [49, 50].
Study strengths include a well-characterized sample, cross-sectional and longitudinal study design within an experimental framework, state-of-the-art MethylationEPIC 850K technology, in-person detailed neuropsychiatric assessments, and administration of validated psychiatric and behavioral symptom measures.
Our study results should be interpreted in light of several limitations. First, although we identified signals for possible cross-sectional and longitudinal associations between second-generation DNAm epigenetic markers and global and domain-specific cognition, caution is needed given the exploratory nature of our work and the potential for chance findings. Similarly, results of partial correlations between epigenetic clocks and cognitive outcomes by baseline cognitive status (MCI versus CN) should be interpreted with caution. Second, to avoid statistical overfit in this small pilot sample, we used a limited set of covariates, and ancestry measures (e.g., principal components from the SNP array) were not included in the models. Third, our results regarding telomere length (TL) were obtained using an epigenetic clock, not a direct measurement of relative or absolute TL, so our results cannot be compared with previous studies of actual TL [51]. Fourth, we cannot exclude the possibility of reverse causation bias in observed signals of longitudinal associations between epigenetic aging and cognitive aging, i.e., lower cognitive performance is a cause rather than an effect of accelerated biological aging. Fifth, the sample had limited racial and ethnic diversity; studies with larger numbers of participants from diverse racial and ethnic backgrounds are necessary to improve generalizability of findings.
In conclusion, chronological age was strongly correlated with DNAmGrimAge, followed by DNAmPhenoAge and DNAmTL. Results from this study suggested that, even in the context of small sample size, second-generation DNAm-based clocks of healthspan and lifespan, especially GrimAge, were cross-sectionally and longitudinally related to cognitive aging. Exploration of genome-wide DNAm differences in contrasting cognitive and neuropsychiatric phenotypes raised possible epigenetic mechanisms involved in cognitive aging. Future research is needed to validate our results in larger cohorts and to provide further explorations of mechanistic relationships between newer epigenetic aging markers and cognitive aging. If confirmed, epigenetic aging biomarkers could inform development of targets in prevention studies of dementia.
Footnotes
ACKNOWLEDGMENTS
We acknowledge the invaluable contributions and dedication of the 25,871 participants in VITAL and the entire staff of the VITAL study.
Previous presentation: Portions of the results have been presented at the 2021 Annual Meeting of the American Association for Geriatric Psychiatry and at the 2021 Alzheimer’s Association International Conference.
FUNDING
VITAL-DEP is supported by R01 MH091448 and R56 MH091448 from the National Institute of Mental Health (NIMH). VITAL is supported by grants R01 AT011729, U01 CA138962, and R01 CA138962, which include support from the National Cancer Institute; National Heart, Lung, and Blood Institute (NHLBI); Office of Dietary Supplements; National Institute of Neurological Disorders and Stroke; and the National Center for Complementary and Integrative Health of the National Institutes of Health (NIH). The VITAL ancillary studies and CTSC (Clinical and Translational Science Center) component are supported by grants DK088078 and R01 DK088762 from the National Institute of Diabetes and Digestive and Kidney Diseases (NIDDK); R01 HL101932 and R01 HL102122 from NHLBI; R01 AG036755 from the National Institute on Aging (NIA); R01 AR059086 and R01 AR060574 from the National Institute of Arthritis and Musculoskeletal and Skin Diseases; and R01 MH091448 from the NIMH.
This work was conducted with support from the Harvard Catalyst CTSC (UL1TR001102 from the National Center for Advancing Translational Sciences). Dr. Reynolds’ participation also received support from P30 MH090333 from NIMH, and the University of Pittsburgh Medical Center Endowment in Geriatric Psychiatry. Dr. Sadreyev’s participation received support from P30 DK040561 from NIDDK. Pharmavite LLC of Northridge, California (vitamin D) and Pronova BioPharma/BASF of Norway (Omacor® fish oil) donated the study agents, matching placebos, and packaging in the form of calendar packs. VITAL-DEP has been approved by the Institutional Review Board of Partners Healthcare/Brigham and Women’s Hospital, and the VITAL study agents have received Investigational New Drug Approval from the U.S. Food and Drug Administration. Voting members of the Data and Safety Monitoring Board for VITAL and ancillary studies, including VITAL-DEP, included Lawrence S. Cohen, MD; Theodore Colton, ScD; Mark A. Espeland, PhD; Craig Henderson, MD; Alice H. Lichtenstein, ScD; Rebecca A. Silliman, MD, PhD; and Nanette Wenger, MD (chair). Ex-officio members include Josephine Boyington, PhD, MPH; Rebecca Costello, PhD; Cindy Davis, PhD; Peter Greenwald, MD; and Wendy Weber, PhD. VITAL and VITAL-DEP are registered at clinicaltrials.gov (VITAL: NCT01169259; VITAL-DEP: NCT01696435). The VITAL website is http://www.vitalstudy.org.
The NIH, Harvard Catalyst, US FDA, Pharmavite LLC, and Pronova BioPharma/BASF had no role in the design and conduct of the study; collection, management, analysis, and interpretation of the data; preparation, review, or approval of the manuscript; and decision to submit the manuscript for publication.
CONFLICT OF INTEREST
Dr. Vyas has received research support from Nestlé-Purina Petcare Company. Dr. Kang has received research support for Pfizer, Inc. Dr. Reynolds receives payment from the American Association of Geriatric Psychiatry as Editor-in-Chief of the American Journal of Geriatric Psychiatry, royalty income for intellectual property as co-inventor of the Pittsburgh Sleep Quality Index and, in the past, a one-time honorarium from Merck for consultation on care pathways for insomnia. Dr. Reynolds also receives royalty income from Oxford University Press and from Up-to-Date.
Dr. Mischoulon has received research support from Nordic Naturals and Heckel Medizintechnik GmbH. He has received honoraria for speaking from the Massachusetts General Hospital Psychiatry Academy, Peerpoint Medical Education Institute, LLC, and Harvard blog. He also works with the MGH Clinical Trials Network and Institute (CTNI), which has received research funding from multiple pharmaceutical companies and NIMH.
Dr. Chang receives royalties from Up-to-Date.
Dr. Manson has received research support from Mars Edge.
Dr. Okereke receives royalties from Springer Publishing for a book on late-life depression prevention.
No other authors have disclosures to report.
DATA AVAILABILITY
We recognize and support the principles of data sharing that have been endorsed by the NIH. We maintain a policy that actively promotes new research collaborations that make use of the comprehensive outcomes, covariate and blood-based biomarker data collected during the trial, and will encourage the submission of collaborative studies that include investigators from other departments and institutions. We will also maintain our strong commitment to communicate important study results to participants and the scientific community through the regular VITAL study newsletters, published manuscripts, presentations at national meetings, and interviews for lay publications. The data generated from this research will be made available to affiliated investigators through secure databases. Only investigators with specific IRB approval will have access to any identifiable data. For de-identified datasets, investigators can contact Dr. Olivia I. Okereke (olivia.okereke@mgh.harvard.edu) and Dr. Vyas (cvyas@partners.org). Consent for such data sharing was integral to enrollment in the VITAL study, and our participants have been generous in their willingness to have their data shared to advance health research.