
Abstract
Background:
The existence and contribution of microglia with senescent-like alterations in the pathogenesis of age-related neurodegenerative diseases like Alzheimer’s disease (AD) have been suggested in recent years. However, the identification of this distinct microglial population in vivo has proven challenging, largely due to overlaps in the inflammatory phenotype of activated and senescent microglia. Furthermore, attempts at recapitulating senescence in microglia in vitro are limited.
Objective:
To identify and characterize senescent microglia that occur in vivo in an animal model of neurodegeneration driven by pathologic tau.
Methods:
We analyzed the RNA expression patterns of individual microglia from normal mice and the pathogenic tau P301 S PS19 mouse model. We have previously demonstrated that p16-expressing senescent microglia occur in these mice when neurodegeneration has occurred.
Results:
Here we identify a subset of disease-associated microglia with senescent features, notably characterized by the expression of Ccl4. This signature overlaps with established markers of senescence from other cell types.
Conclusion:
Our characterization of senescent microglia can be used to better understand the role of senescent microglia in various age-related contexts, including whether clearance of senescent microglia represents a viable therapeutic option.
INTRODUCTION
The largest risk factor for neurodegenerative diseases is aging, with almost one in ten individuals over the age of 65 diagnosed with Alzheimer’s disease (AD) [1]. Combined with a global population that is aging, the incidence of age-related neurodegenerative diseases is likely to increase, making the need for new therapeutic options more pertinent than ever [2, 3]. However, treatment options for these conditions remain largely targeted toward the alleviation of symptoms and not at the true treatment of the underlying disease-causing effects [4].
Cellular senescence represents a potential novel way to target the pathogenesis of several neurodegenerative diseases. Senescence is a state of irreversible cell cycle arrest, accompanied by a senescence-associated secretory phenotype (SASP), macromolecular damage, and deregulated metabolism [5]. Senescent cells accumulate with age and have been associated with a variety of age-related diseases, including neurodegenerative diseases like AD and Parkinson’s disease (PD) [6, 7]. Clearing senescent cells in mouse models of PD, AD, and tauopathy has led to alleviations in pathophysiology and cognitive behavior [8–10], implicating senescence in the pathogenesis of age-related neurodegenerative diseases. This targetable nature of senescent cells makes them a promising new therapeutic strategy in the treatment of age-related neurodegenerative disease, and indeed senolytic therapies have entered clinical trials for the treatment of AD [11].
Several cell types have been proposed to become senescent in age-related neurodegenerative diseases, including microglia [9, 12, 13], astrocytes [9, 10, 14], neurons [15–17], and oligodendrocyte progenitor cells [8]. It is likely that several cell types exhibit features reminiscent of senescence in the context of age-related neurodegenerative disease and may contribute to pathogenesis in unique ways. While there is much to learn about the features distinguishing all of these cell types, understanding microglia has been complicated due to the lack of unique attributes that would only be present in the senescent state [18]. For example, inflammatory microglia exhibit many changes that are likely to be shared with senescent microglia, where both populations display a pro-inflammatory secretome consisting of increased expression of tumor necrosis factor α (TNFα), interleukin 1β (IL-1β), interleukin 6 (IL-6), and interferon γ (IFNγ) [19, 20]. Senescence-associated β-galactosidase (SA-β-gal) activity, a common marker used to define senescent cells, can be observed in phagocytic cells like microglia that are not senescent [21–23]. These features, together with senescence missing a distinguishing singular biomarker [5], has hampered our understanding for how this important cell population may contribute to neurodegenerative disease when they become senescent. However, with the key role that microglia play in neurodegenerative disease [24, 25], defining the presence of senescent microglia and their differences from non-senescent inflammatory microglia remains an important point to address.
To gain a better understanding of the senescence-associated phenotype of microglia in disease, we performed RNA sequencing of individual microglia from control and MAPT P301 S PS19 (hereafter P301 S or simply tau) mice. This mouse model is characterized by neuroinflammation and degeneration beginning around 6 months of age [26]. We have previously shown that astrocytes and microglia are prone to senescence and their removal, both via transgenic and pharmacological means, result in the attenuation of disease and cognition [9]. Knowing that tau mice had some features of senescence in microglia, here we sought to investigate more deeply their phenotype.
MATERIALS AND METHODS
Mouse strains
All experiments were reviewed and approved by the Mayo Clinic Institutional Animal Care and Use Committee. MAPTP301SPS19 (P301 S) mice were originally purchased from The Jackson Laboratory (stock no.008169) and bred to C57BL/6 for at least ten generations. Control C57BL/6 mice (wt) were littermates of PS19 mice. C57BL/6 ATTAC transgenic mice are as previously described [9, 27, 28]. ATTAC mice were bred to PS19 mice to create WT;ATTAC and tau;ATTAC mice. Animals from this cohort were randomly assigned to receive either AP20187 (AP; B/B homodimerizer; Clontech) or vehicle (100% EtOH, 4%; PEG400, Sigma 91893, 10%; 2% tween 20, Fisher BP337500; 86%) twice a week beginning at weaning age (3 weeks). Dosing of AP was 2.0 mg per kg body weight. Mice were housed in a 12 h:12 h light:dark cycle environment, and had ad libitum access to standard irradiated pelleted chow (LabDiet product 5053).
Single cell dissociation
Mice were sacrificed at 9.5 months of age, and the brains from 2 mice were pooled for each sample. Male and female C57BL/6 and wildtype mice were analyzed separately. Single cell dissociation was carried out under sterile conditions and either on ice or at 4°C. Mice were anesthetized with ketamine before being transcardially perfused with 50 mL of ice-cold HBSS (Corning 21-022-CM). The brains were then dissected, and the cortices and hippocampi isolated. Cortices and hippocampi were then minced using a razor blade and incubated with 10 mL accutase (Fisher A1110501) for 30 min at 4°C. The cell suspension was then spun down at 300 g at 4°C for 10 min, the accutase was decanted, and the cell pellet was resuspended in HBSS before the resuspended cells were passed through a 70 micron cell strainer. Myelin removal was then carried out using Miltenyi’s myelin removal beads (Miltenyi 130-096-731) using their standard protocol, before CD11b selection using EasySep’s Mouse CD11b Positive Selection Kit (StemCell 18970) and their standard protocol. CD11b+cells were then resuspended in 0.04% ultrapure BSA (Life Technologies AM2616) in DPBS (Corning 21-031-CV) before being immediately sent for single-cell library preparation.
Single cell library preparation
Single-cell library preparation was performed by the Mayo Clinic Genome Analysis Core. The cells were first counted and measured for viability using the Vi-Cell XR Cell Viability Analyzer (Beckman-Coulter, Brea, CA). The barcoded Gel Beads were thawed from -80°C and the cDNA master mix was prepared according to the manufacturer’s instruction for Chromium Next GEM Single Cell 3’ Library and Gel Bead Kit (10x Genomics, Pleasanton, CA). A per sample concentration of 400,000 cells per milliliter was required for the targeted cell recovery of approximately 10,000 cells. The cell suspension and master mix, thawed Gel Beads and partitioning oil were added to a Chromium Single Cell G chip. The filled chip was loaded into the Chromium Controller, where each sample was processed and the individual cells within the sample were partitioned into uniquely labeled GEMs (Gel Beads-In-Emulsion). The GEMs were collected from the chip and taken to the bench for reverse transcription, GEM dissolution, and cDNA clean-up. The resulting cDNA contained a pool of uniquely barcoded molecules. A portion of the cleaned and measured pooled cDNA continued to library construction, where standard Illumina sequencing primers and a 10x Genomics unique i7 Sample index were added to each cDNA pool. All cDNA pools and resulting libraries were measured using Qubit High Sensitivity assays (Thermo Fisher Scientific, Waltham, MA) and Agilent Bioanalyzer High Sensitivity chips (Agilent, Santa Clara, CA). Libraries are sequenced at between 40,000 and 50,000 fragment reads per cell following Illumina’s standard protocol using the Illumina cBot and HiSeq 3000/4000 PE Cluster Kit (Illumina, San Diego, CA). The flow cells were sequenced as 100 X 2 paired end reads on an Illumina HiSeq 4000 HD using HiSeq 3000/4000 sequencing kit and HCS v3.4.0.38 collection software. Base-calling was performed using Illumina’s RTA version 2.7.7.
Single cell RNA-sequencing analysis
Sequencing output was demultiplexed and aligned to the mouse reference genome GR. Cm38 using 10x Genomics Cell Ranger 3.0.2. Alignment output from Cell Ranger in the form of gene-barcode matrix were analyzed using R package Seurat 3.2.3. Genes were filtered to remove those expressing in less than 3 cells. Cells were also filtered so that only those with at least 500 expressed genes, at least 1,000 unique molecular identifiers (UMIs) and mitochondrial gene content less than 50% UMI. Cells with UMI count larger than the average UMI of all cells plus 3 times the standard deviation of UMI were also removed. Raw counts were log-transformed and multiplied by a factor of 1000. A subset of 2000 genes with high variance across all the cells were selected as variable features. The dataset was then centered and scaled after regressing out the number of UMI of each cell. Principal component analysis (PCA) was performed on the previously identified 2000 most variable genes and an elbow plot showing number of PCs versus cumulative total variance explained was generated to decide the optimal number of top principal components (PCs) to use for downstream analysis, which was 20 in this study. The Uniform Manifold Approximation and Projection (UMAP) method was used to project the cells represented by selected number of PCs into two-dimensional scatter plots for visualization. A graph-based clustering approach was used to group cells into clusters. First, a k-nearest neighbor (KNN) graph was constructed based on the selected top PCs using Euclidean distance. Pairwise edge weights of cells were refined based on the shared overlap in their local neighborhoods (Jaccard similarity). This step was achieved by calling function FindNeighbors in the Seurat package. A modularity optimization process using the Louvain algorithm was applied to iteratively group cells together, with the goal of optimizing the standard modularity function. This is implemented in the function FindClusters in the Seurat package. A resolution of 0.8 was used to control the granularity of the clusters. Cluster marker genes were determined using function FindAllMarkers for each cluster and filtered by Bonferroni-corrected p-value<0.05 and log2 fold change > 0.25 and expressing in at least 25% of cells in the cluster.
Immunofluorescence staining
Mice were transcardially perfused with 4% paraformaldehyde (Sigma-Aldrich #P6148) followed by ice-cold DPBS (Gibco #14190144). Brains were stored in 4% PFA overnight at 4°C and then cryoprotected by incubating in a 30% sucrose solution for 48 h at 4°C. Samples were sectioned into 30-μM-thick coronal sections and stored in antifreeze solution (300 g sucrose, 300 ml ethylene glycol, 500 ml PBS) at -20°C. Iba1 staining (Wako #019-19741) and Ccl4 staining (R&D systems, #AF-451-NA) were carried out on free-floating brain sections from bregma -2.78 mm to -3.28 mm as previously described [9]. Images were acquired on a Zeiss LSM 780 confocal system using multi-track configuration.
RESULTS
Disease associated microglia occur in P301 S mice
To unbiasedly characterize the alterations that occur in microglia in neurodegenerative disease, we performed single cell dissociation and microglial isolation under cold, sterile conditions. This was done to minimize activation and subsequent transcriptional changes that would not be reflective of the situation in vivo. At 9.5 months of age, wildtype and P301 S (tau) mice were perfused, and the cortices and hippocampi were minced before digestion with accutase. Myelin removal and CD11b+selection was then carried out, before single-cell sequencing (Fig. 1A). After a preliminary clustering analysis (Supplementary Figure 1A), non-microglial clusters (mostly astrocytes) were excluded, and the remaining cells were re-clustered. Selection of cells for reclustering was based on the expression of the microglial markers Tmem119, P2ry12, Cx3cr1, Itgam, and Fcrls [29–31], as well as excluding cells with high expression of the defining markers of the main contaminating populations like astrocytes (Gfap, Slc1a2) [32], border-associated macrophages (Mrc1, F13a1), and monocyte-derived macrophages (Ccr2) (Supplementary Figure 1B).
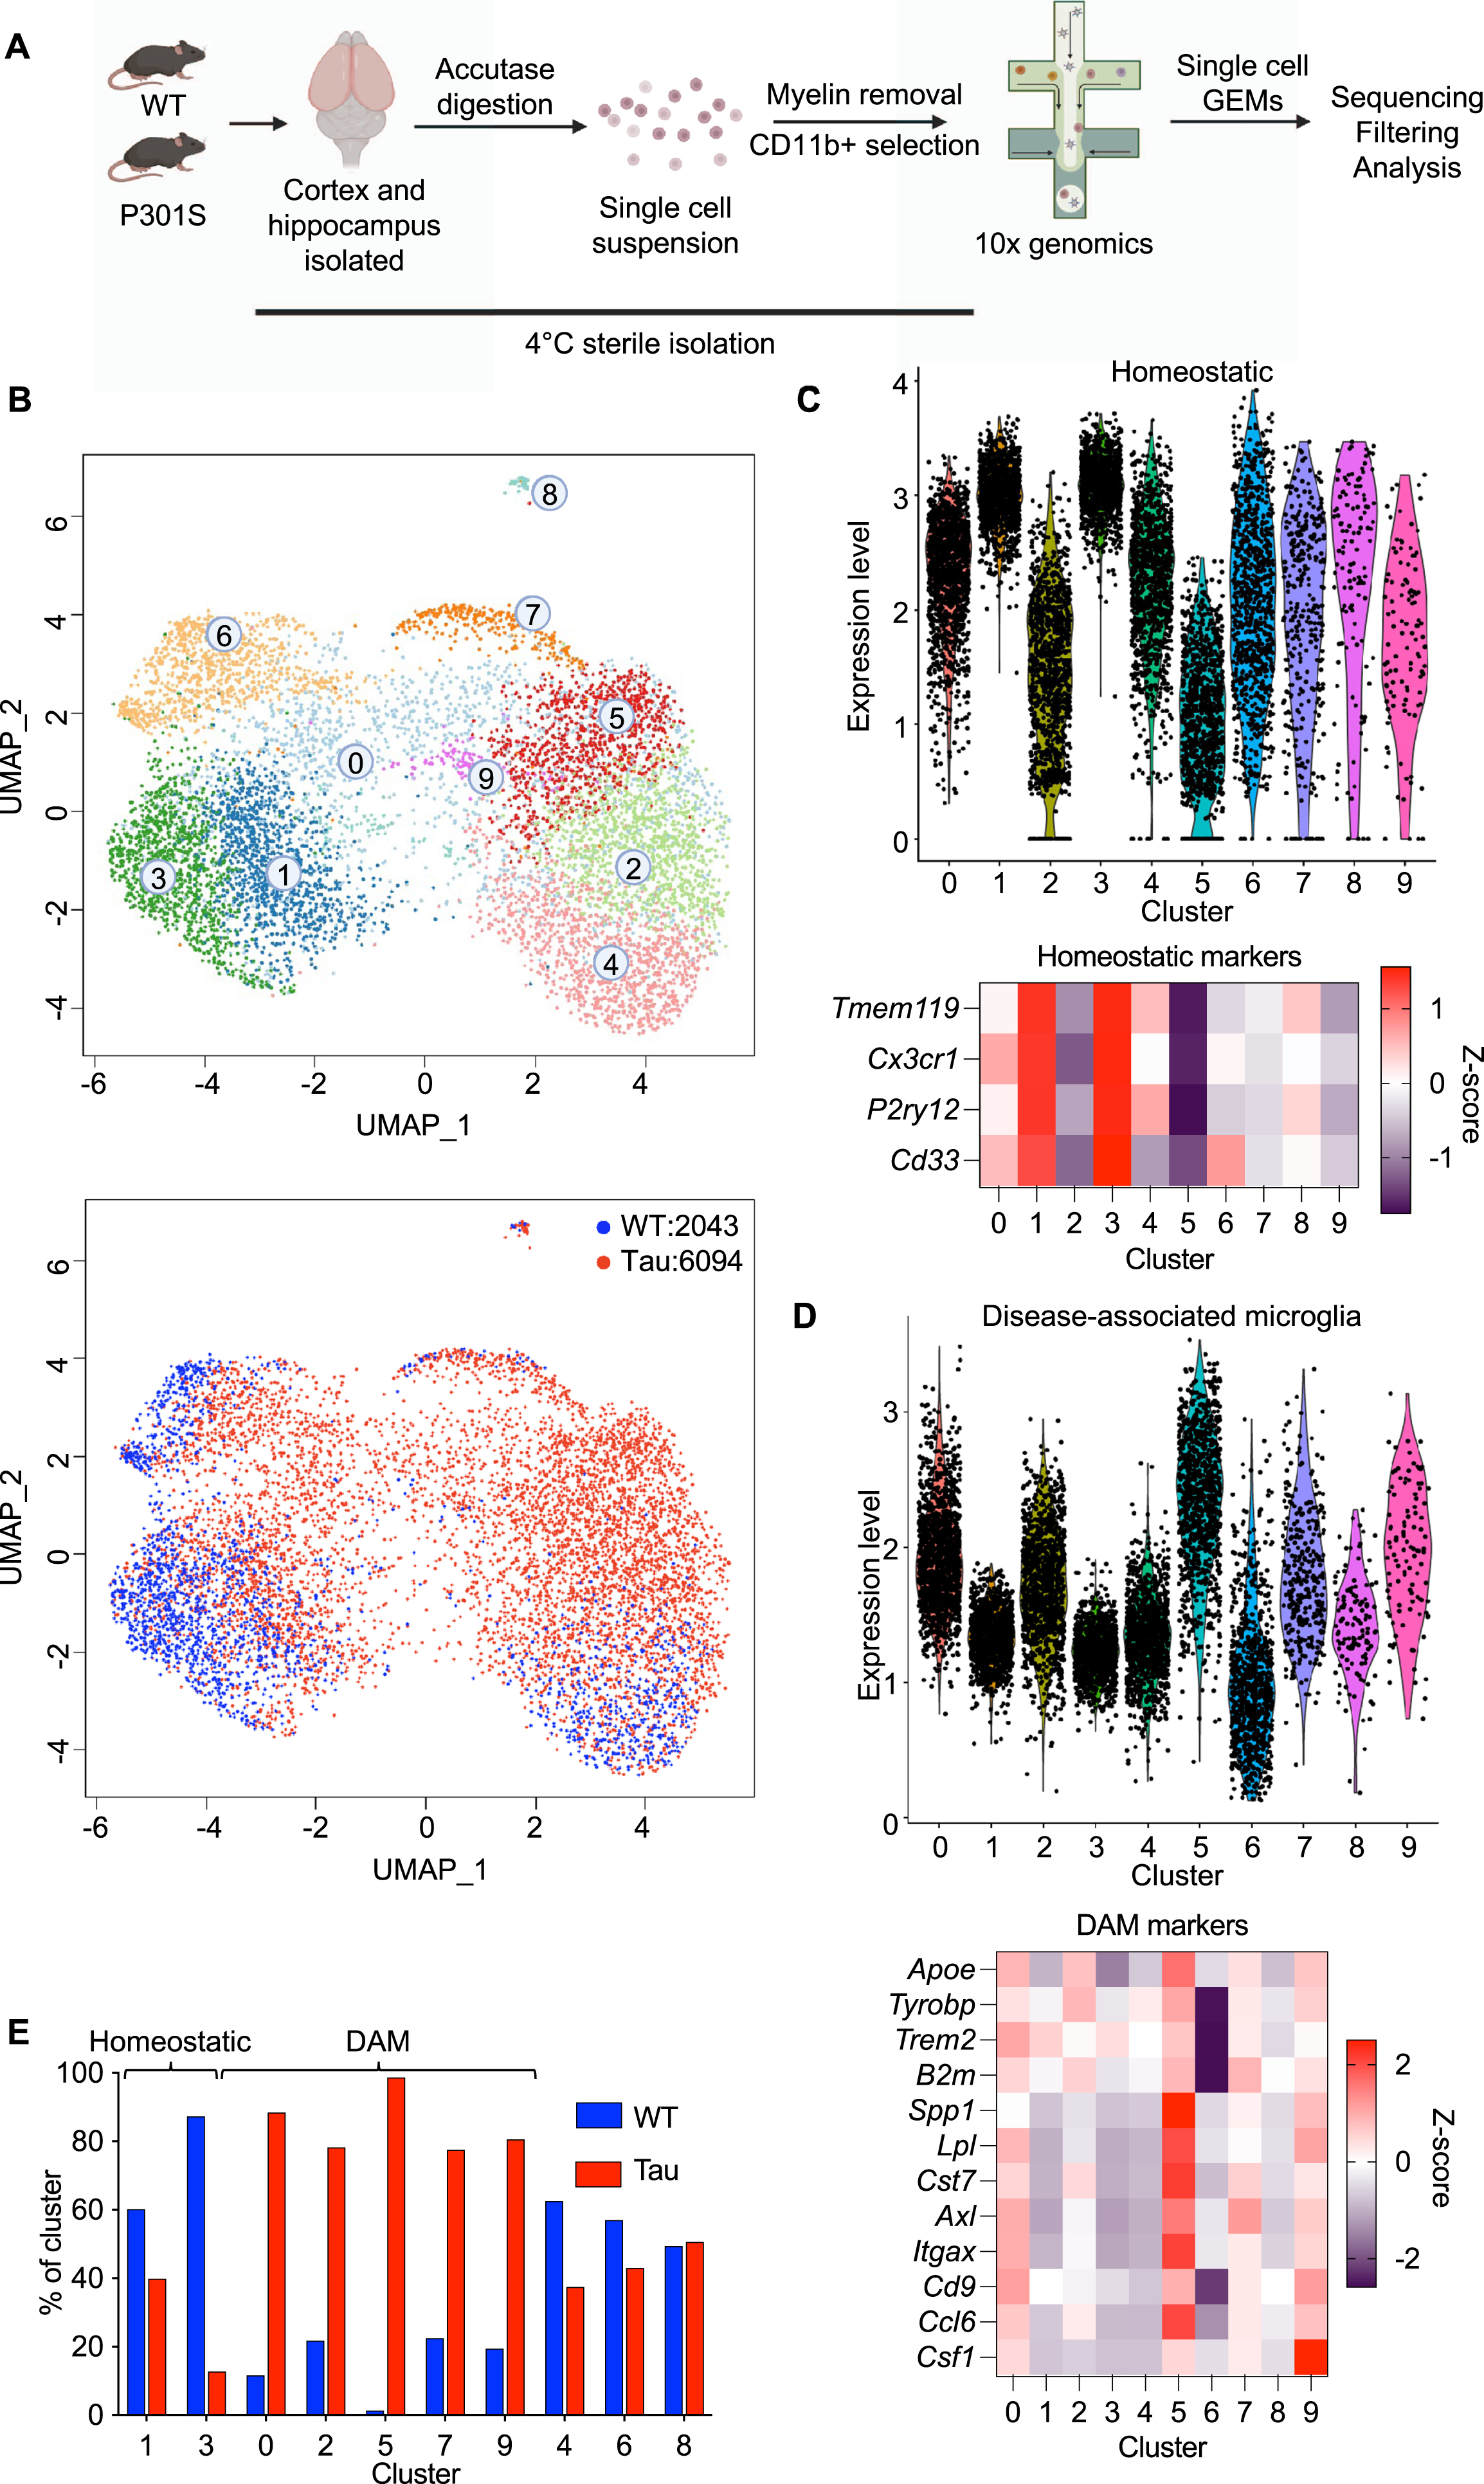
After re-clustering, 10 distinct microglia clusters were revealed (Fig. 1B). Microglial identity was confirmed through expression of the aforementioned microglial markers Tmem119, P2ry12, Cx3cr1, Itgam, and Fcrls and little to no expression of the defining genes of the major contaminating populations like astrocytes (Gfap, Slc1a2), border-associated macrophages (Mrc1, F13a1) [33, 34], and monocyte-derived macrophages (Ccr2) [35] (Supplementary Figure 1C).
To broadly categorize the clusters, we looked at the average expression of the homeostatic microglia genes Tmem119, P2ry12, Cx3cr1, and Cd33 (Fig. 1C) and disease-associated microglia (DAM) genes [25] (Fig. 1D) across the 10 clusters. As expected, the clusters highly expressing homeostatic microglia genes (clusters 1 and 3) were predominantly from wildtype mice, whereas the clusters highly expressing DAM genes (clusters 0, 2, 5, 7, and 9) were predominantly from tau mice (Fig. 1E). This can be seen through morphological assessments of microglia as well. Iba1 staining of brain slices revealed that a majority of the microglia in wildtype mice had a ramified, ‘surveillant’ morphology, typical of homeostatic microglia [36] (Supplementary Figure 2A). On the other hand, microglia from tau mice tended to have either a hypertrophic (enlarged, larger soma, ‘bushy’ appearance) or dystrophic morphology (swollen soma, with beaded, truncated processes) [36, 37] (Supplementary Figure 2A). Microglia with a hypertrophic morphology have also been described as ‘reactive’ or ‘activated’ and can be seen after injury to the central nervous system, with aging, or in the context of AD [38, 39]. Dystrophic microglia have been associated with the aging brain and AD [40, 41]. DAMs seemingly do not adopt a specific morphology as they have been associated with both a hypertrophic and dystrophic appearance [42]. The upregulation of genes involved in iron ion homeostasis has been associated with dystrophic microglia, including ferritin light chain 1 (Ftl1) and ferritin heavy chain 1 (Fth1) [42, 43]. From our data set, these genes are upregulated in several DAM clusters, including clusters 0, 5, 7, and 9 (Supplementary Figure 2B). These results suggest that at least some DAMs exhibit a dystrophic morphology in tau mice.
Of the homeostatic clusters, cluster 1 originated predominantly from female mice whereas cluster 3 was predominantly from male mice (Supplementary Figure 3A). Upon differential gene analysis of cluster 1 versus cluster 3, the separation of the clusters was mostly driven by sex chromosome transcripts, including Xist, Tsix, Ddx3y, and Eif2s3y [44] (Supplementary Figure 3B). Interestingly, two genes associated with DAM (Apoe and Lyz2) [45] were enriched in homeostatic microglia from female mice compared to homeostatic microglia from male mice. This perhaps relates to the increased risk of auto-immune diseases [46] and dementias like AD in women [47], and microglia from females exhibit features resembling pro-inflammatory states under basal conditions [48].
Clusters 4, 6, and 8 do not seem to be homeostatic or disease-associated microglia. Cluster 4 has moderately high expression of homeostatic genes like Tmem119, P2ry12, and Cx3cr1, although not to the level of the homeostatic clusters 1 and 3 (Supplementary Figure 3D). Perhaps cluster 4 represents some sort of intermediate state between homeostasis and activation. The top DEGs of cluster 6 is also highly expressed by the homeostatic clusters 1 and 3 and the DAM cluster 0 (Supplementary Figure 3D), although cluster 6 is highly unlikely to be a DAM (Fig. 1D). Perhaps cluster 6 also could be an intermediate state between homeostasis and activation, although the high expression of Malat1, a long noncoding RNA associated with inflammatory microglia [49, 50], would suggest that cluster 6 is overall inflammatory. The top DEGs of cluster 8 are highly associated with proliferation, such as Stmn1 [51], Hmgb2, Top2a, and Mki67 [52], suggesting that cluster 8 is a cluster of highly proliferative microglia. Cluster 8 made up about 1.5% of the total microglia, in concordance with previously published data that about 2% of microglia proliferate at a given time [53].
The disease-associated microglia (clusters 0, 2, 5, 7, and 9) encompass several distinct microglial states (Supplementary Figure 3D). For example, 4 of the top 5 differentially expressed genes (DEGs) of cluster 7 are highly associated with an interferon response (Ifit3, Isg15, Ifitm3, and Ifit2), genes which are lowly expressed in the other DAM clusters. Cluster 5 has the highest expression of genes like Spp1, Lpl, and Cst7, all part of the gene signature of stage 2 DAM [54]. Cluster 2 appears to be a highly transcriptionally active cluster, with the top DEGs all related to ribosomal genes.
One particular subset, cluster 9, also appeared transcriptionally distinct, specifically expressing chemokines like Ccl4 (also known as macrophage inflammatory protein-1 β or Mip-1β) and Ccl3 (also known as macrophage inflammatory protein-1 α or Mip-1α), both of which are pro-inflammatory chemokines involved in recruitment of immune cells [55, 56].
One distinct microglia subset exhibits features of senescence
To aid in identifying the microglial population that could be senescent, we looked at the expression of the recently described SenMayo panel [57], a novel gene set with predictive ability for senescent cell detection across tissues and species. The high enrichment of SenMayo’s signature in cluster 9 showed that this cluster highly expressed genes characteristic of senescent cells (Fig. 2A). We then investigated the expression of Cdkn1a which encodes p21, a cyclin-dependent kinase inhibitor associated with both transient cell-cycle arrest and senescence. Cluster 9 had the highest mean and proportion of cells expressing Cdkn1a, although only 29% of the cells had detectable levels (Fig. 2B). Cdkn2a, which also encodes cyclin-dependent kinase inhibitors highly associated with senescence (p16 and p19), was lowly detected across the clusters (Supplementary Figure 3C), reflecting its low expression levels and therefore dropout in single cell data sets [58]. Functional annotation of the upregulated genes of cluster 9 versus the homeostatic clusters 1 and 3 also showed that several processes associated with senescence were a defining characteristic of cluster 9, including cell cycle regulation, apoptosis, and aging and regeneration (Fig. 2C, D). This functional annotation also showed that cluster 9 is a highly inflammatory cluster, upregulating inflammatory chemokines including Ccl2, Ccl3, Ccl4, and Il1b. Cluster 9 also makes up a relatively small proportion of microglia, composing about 1.3% of the microglia. This would agree with previously published data that in several tissues, including brain, senescent cells were a very rare population, generally accounting for less than 1% of the tissue [59].
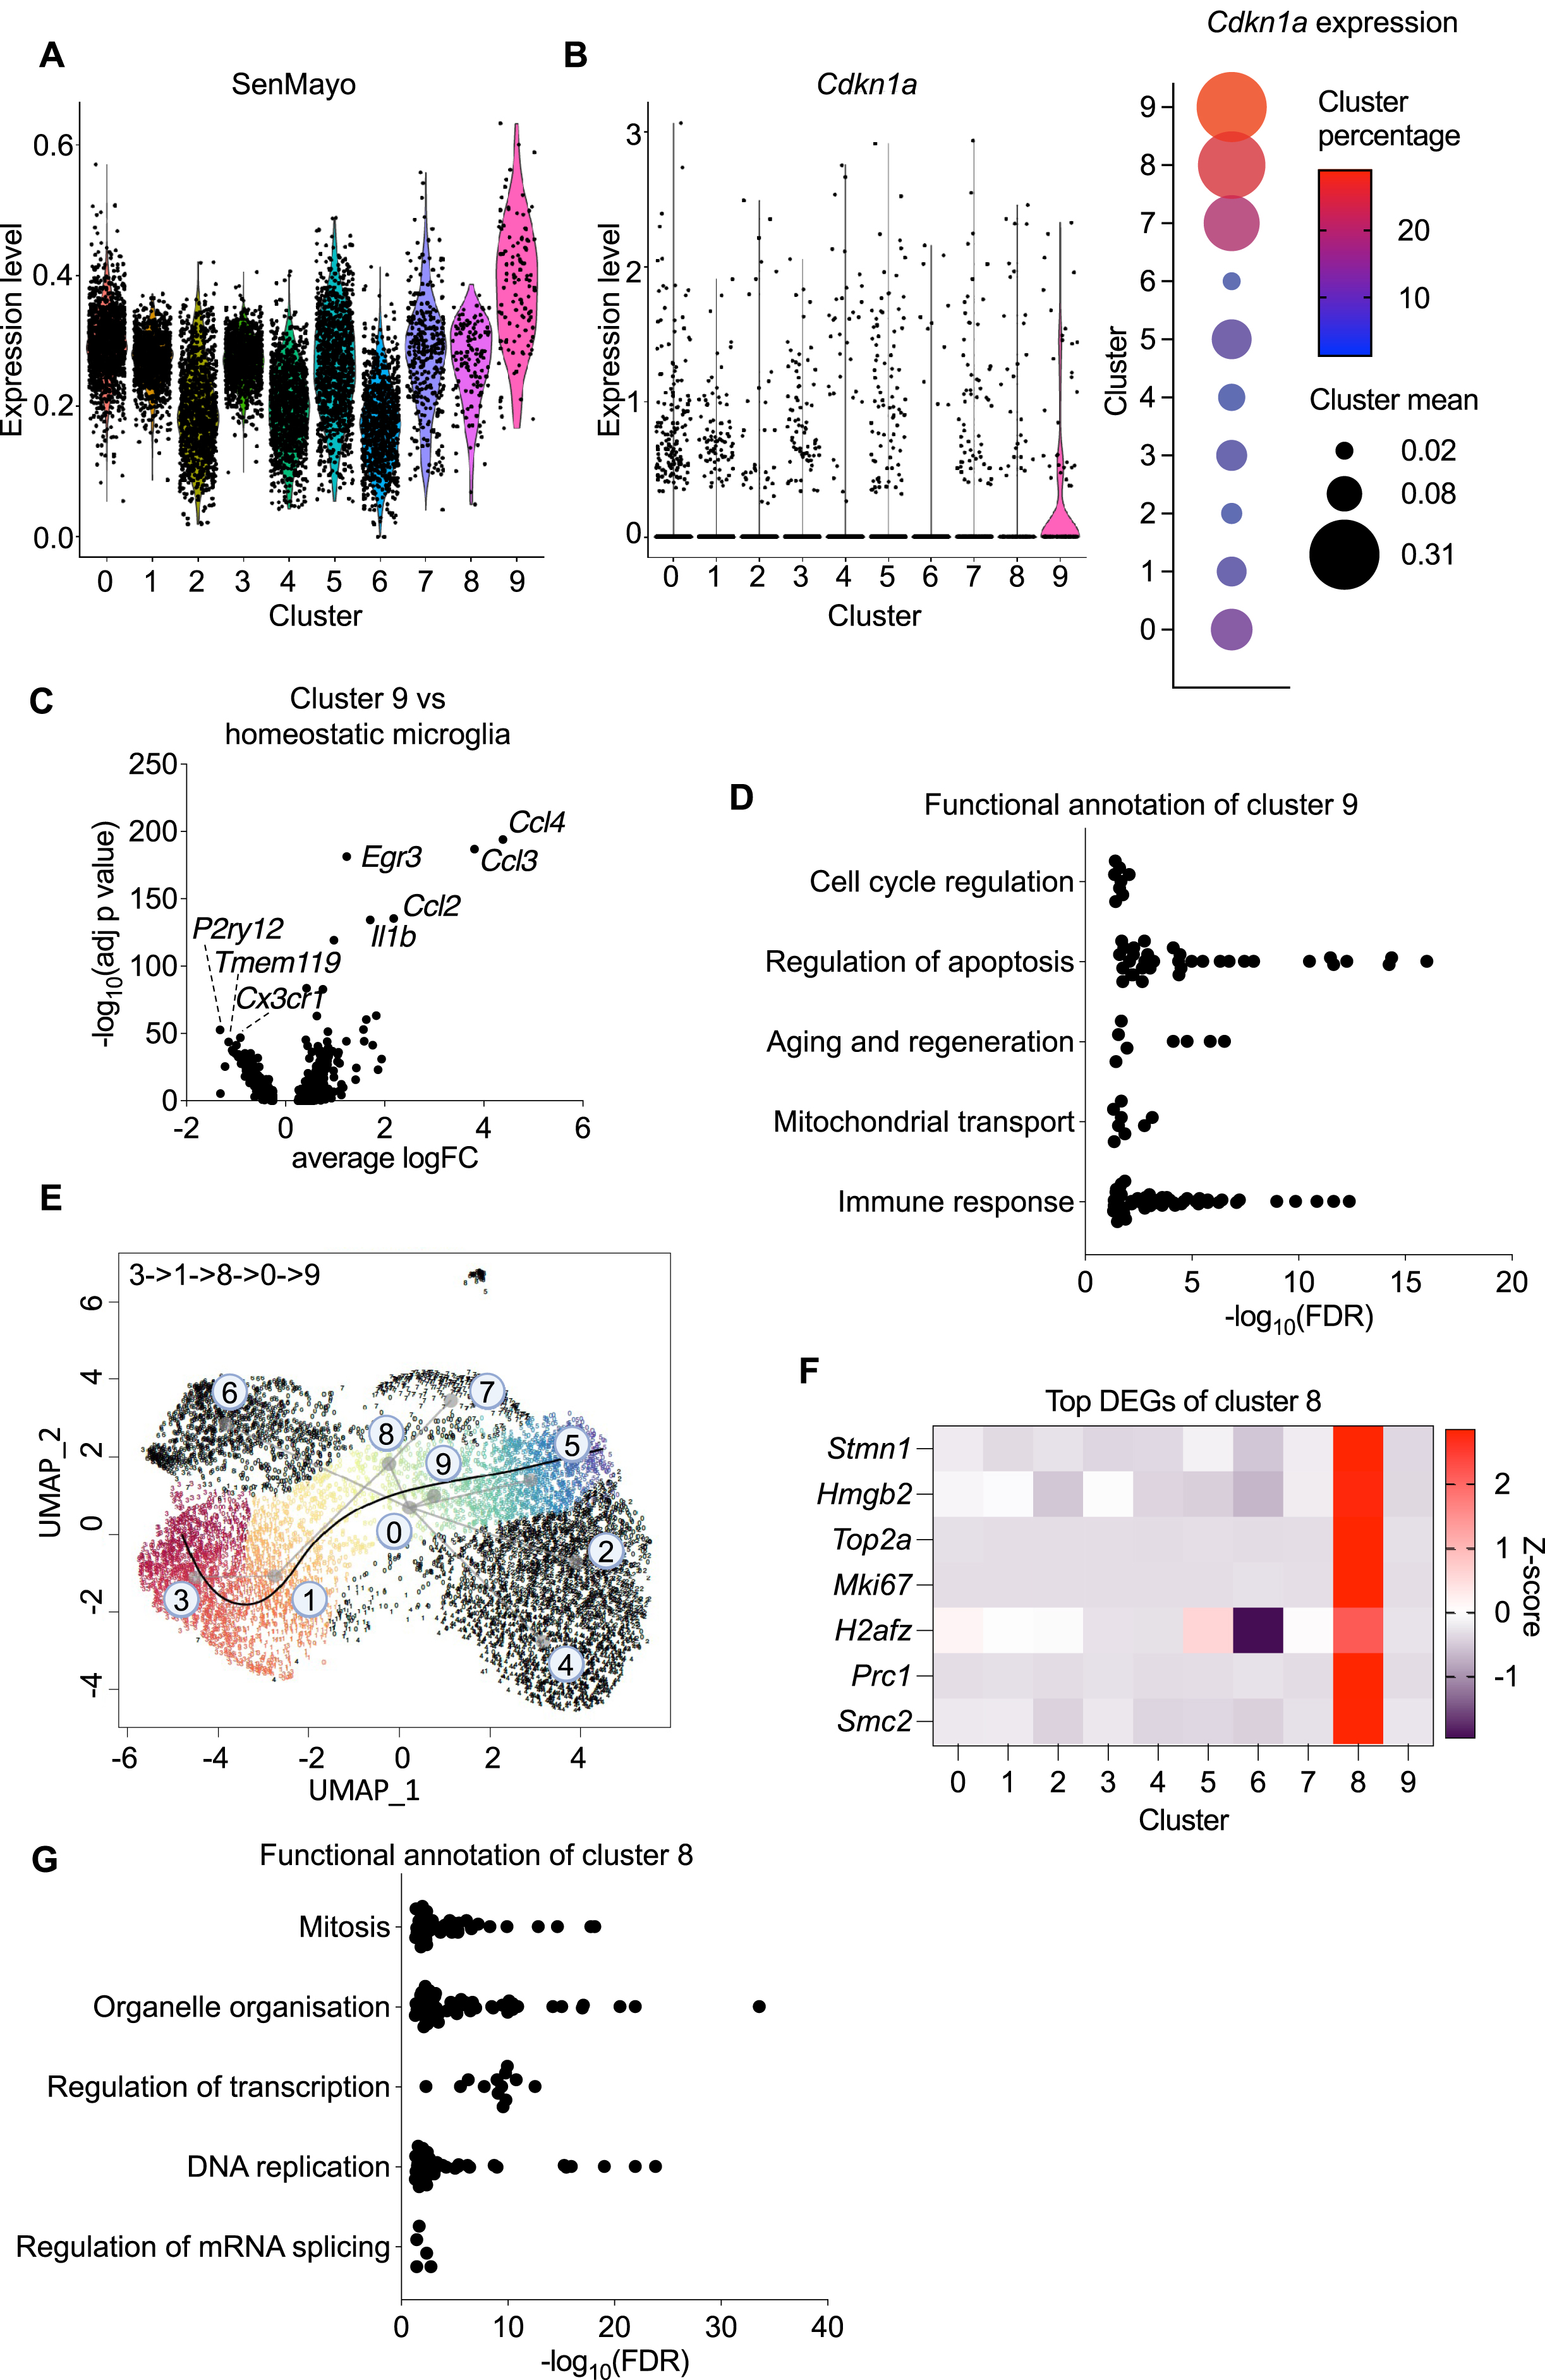
Cellular senescence is generally thought of as an irreversible terminal state [5], and we were interested in seeing if the senescent-like microglial population in this dataset was a terminal state as well. We were also interested in seeing how the senescent population could have arisen, if for example the senescent microglia had a separate lineage from the other disease-associated microglia, or if disease-associated microglia became senescent. In order to investigate these questions, we performed a Slingshot analysis to infer the possible pseudotimes that cluster 9 could be a part of. In brief, Slingshot analysis identifies lineages by treating clusters of cells as nodes, and then drawing a minimum spanning tree between the nodes. Lineages are then defined by tracing paths through the minimum spanning tree [60]. Cluster 9 was part of only one pseudotime (Fig. 2E), which originated from the homeostatic clusters 3 and 1, before transitioning through cluster 8, then cluster 0, before ending in cluster 9. Cluster 8 was strongly enriched in genes involved in proliferation (Fig. 2F), and functional annotation of the upregulated genes confirmed this with pathways highly involved in cellular replication (Fig. 2G). This highly proliferative nature of cluster 8 also explains its relatively high expression of Cdkn1a (Fig. 2B) [61]. Cluster 0 was previously identified as a population of DAM (Fig. 1D). Overall, the pseudotime analysis suggests that cluster 9 is a terminal microglial state that originated from homeostatic microglia, which were triggered to enter a highly proliferative state and then became a DAM, before becoming a senescent DAM.
In addition, 5 other pseudotimes which did not involve cluster 9 were generated by Slingshot analysis (Supplementary Figure 2E). All pseudotimes originated from the homeostatic clusters 3 and 1, and transitioned through the proliferative cluster 8, including pseudotimes involving the previously identified DAM populations (clusters 0, 2, 5, 7, and 9). This lends support to the theory that microglia can be activated by triggers in neurodegenerative disease to enter a proliferative state, which could then give rise to DAM [54, 62, 63].
The senescence-associated cluster resembles microglial clusters enriched in aged and other neurodegenerative diseases
Next, we wanted to describe the gene signature of cluster 9. Cluster 9 is highly enriched in inflammatory genes like Ccl4, Ccl3, Ccl2, and Il1b, and has comparatively low expression of homeostatic microglial genes like P2ry12, Cx3cr1, and Tmem119 (Figs. 2C and 3A). This downregulation of homeostatic genes is typical of DAM [25]. Of the genes enriched in cluster 9, Ccl4, Ccl3, and Ccl2 (chemokines), Atf3, Egr1, and Egr3 (transcription factors), Il1b (an inflammatory interleukin), and Rcan1 (a regulator of calcineurin) were more specific to cluster 9 and lowly expressed in other microglial populations. Ccl4, Ccl3, Ccl2, and Il1b have all been described to be possible components of the SASP [64–66], and perhaps these genes are part of the SASP secreted by senescent microglia. Atf3, a transcription factor induced through various stress signals [67], has also been implicated in senescence, although the exact pathway that Atf3 and senescence are linked has differed between studies [68–70]. Egr1 has also been linked to senescence, by inducing replicative senescence through p53 [71, 72]. Rcan1 has been shown to be upregulated in the brains of AD patients and is associated with mitochondrial dysfunction, another hallmark of senescence [73, 74].

If cluster 9 microglia are indeed senescent microglia, it is conceivable that they will be enriched in other associated contexts where senescent microglia have been described, like aging and other neurodegenerative disease models. First, we looked at a bulk RNA sequencing dataset which identified genes that were in common in microglia from aged mice (24mo) and two other mouse models of AD (APP/PS1 and P301 L) [75]. Of the 25 common genes that they identified, 19 genes were a DEG in cluster 9 (Fig. 3B), suggesting that cluster 9 had a gene signature that was in common between aging and AD. Ccl4, a defining marker of cluster 9, was also of the 25 common genes.
Next, we looked at a single-cell microglia dataset that identified clusters of microglia that were upregulated in aging [76]. One of the clusters of microglia in that paper (OA2) was defined by 6 genes. All 6 of those genes were DEGs in cluster 9 (Fig. 3C). Also like OA2, Ccl4 was a gene that was specifically expressed in cluster 9 and had little to no expression in other microglial populations (Fig. 3A). Overall, cluster 9 has a very similar gene signature to OA2 and is likely to be a microglial population that is enriched in aging.
Ccl4 is a defining marker of this senescent-like microglia population, and was a gene regularly identified in multiple studies as upregulated in microglia found in contexts where senescent microglia have been implicated, such as aging and neurodegenerative diseases. Overall, this implicates Ccl4 as a unique marker for senescent microglia.
Ccl4 + microglia are enriched in the brains of tau mice
To validate that Ccl4 + microglia are detected in tau mice, we stained sections of the hippocampus from age-matched tau and wildtype mice with Iba1 and Ccl4. The proportion of Ccl4 + microglia were indeed higher in tau mice compared to wildtype mice (Fig. 4A, B). To test if Ccl4 + microglia were senescent, we utilized INK-ATTAC transgenic mice bred with tau (creating cohorts of WT;ATTAC and tau;ATTAC), such that administration of AP20187 (AP) would eliminate p16INK4a-expressing cells [9, 27, 28]. Administration of AP from weaning age led to a reduction of Ccl4 + microglia to some extent, with some mice having a stronger reduction than others (Fig. 4B). Perhaps this could correlate with the spread of disease severity in this mouse model, where the extent of disease pathology may not necessarily correlate with age or that there are some other currently unknown factors that determine whether a mouse would respond to intervention.
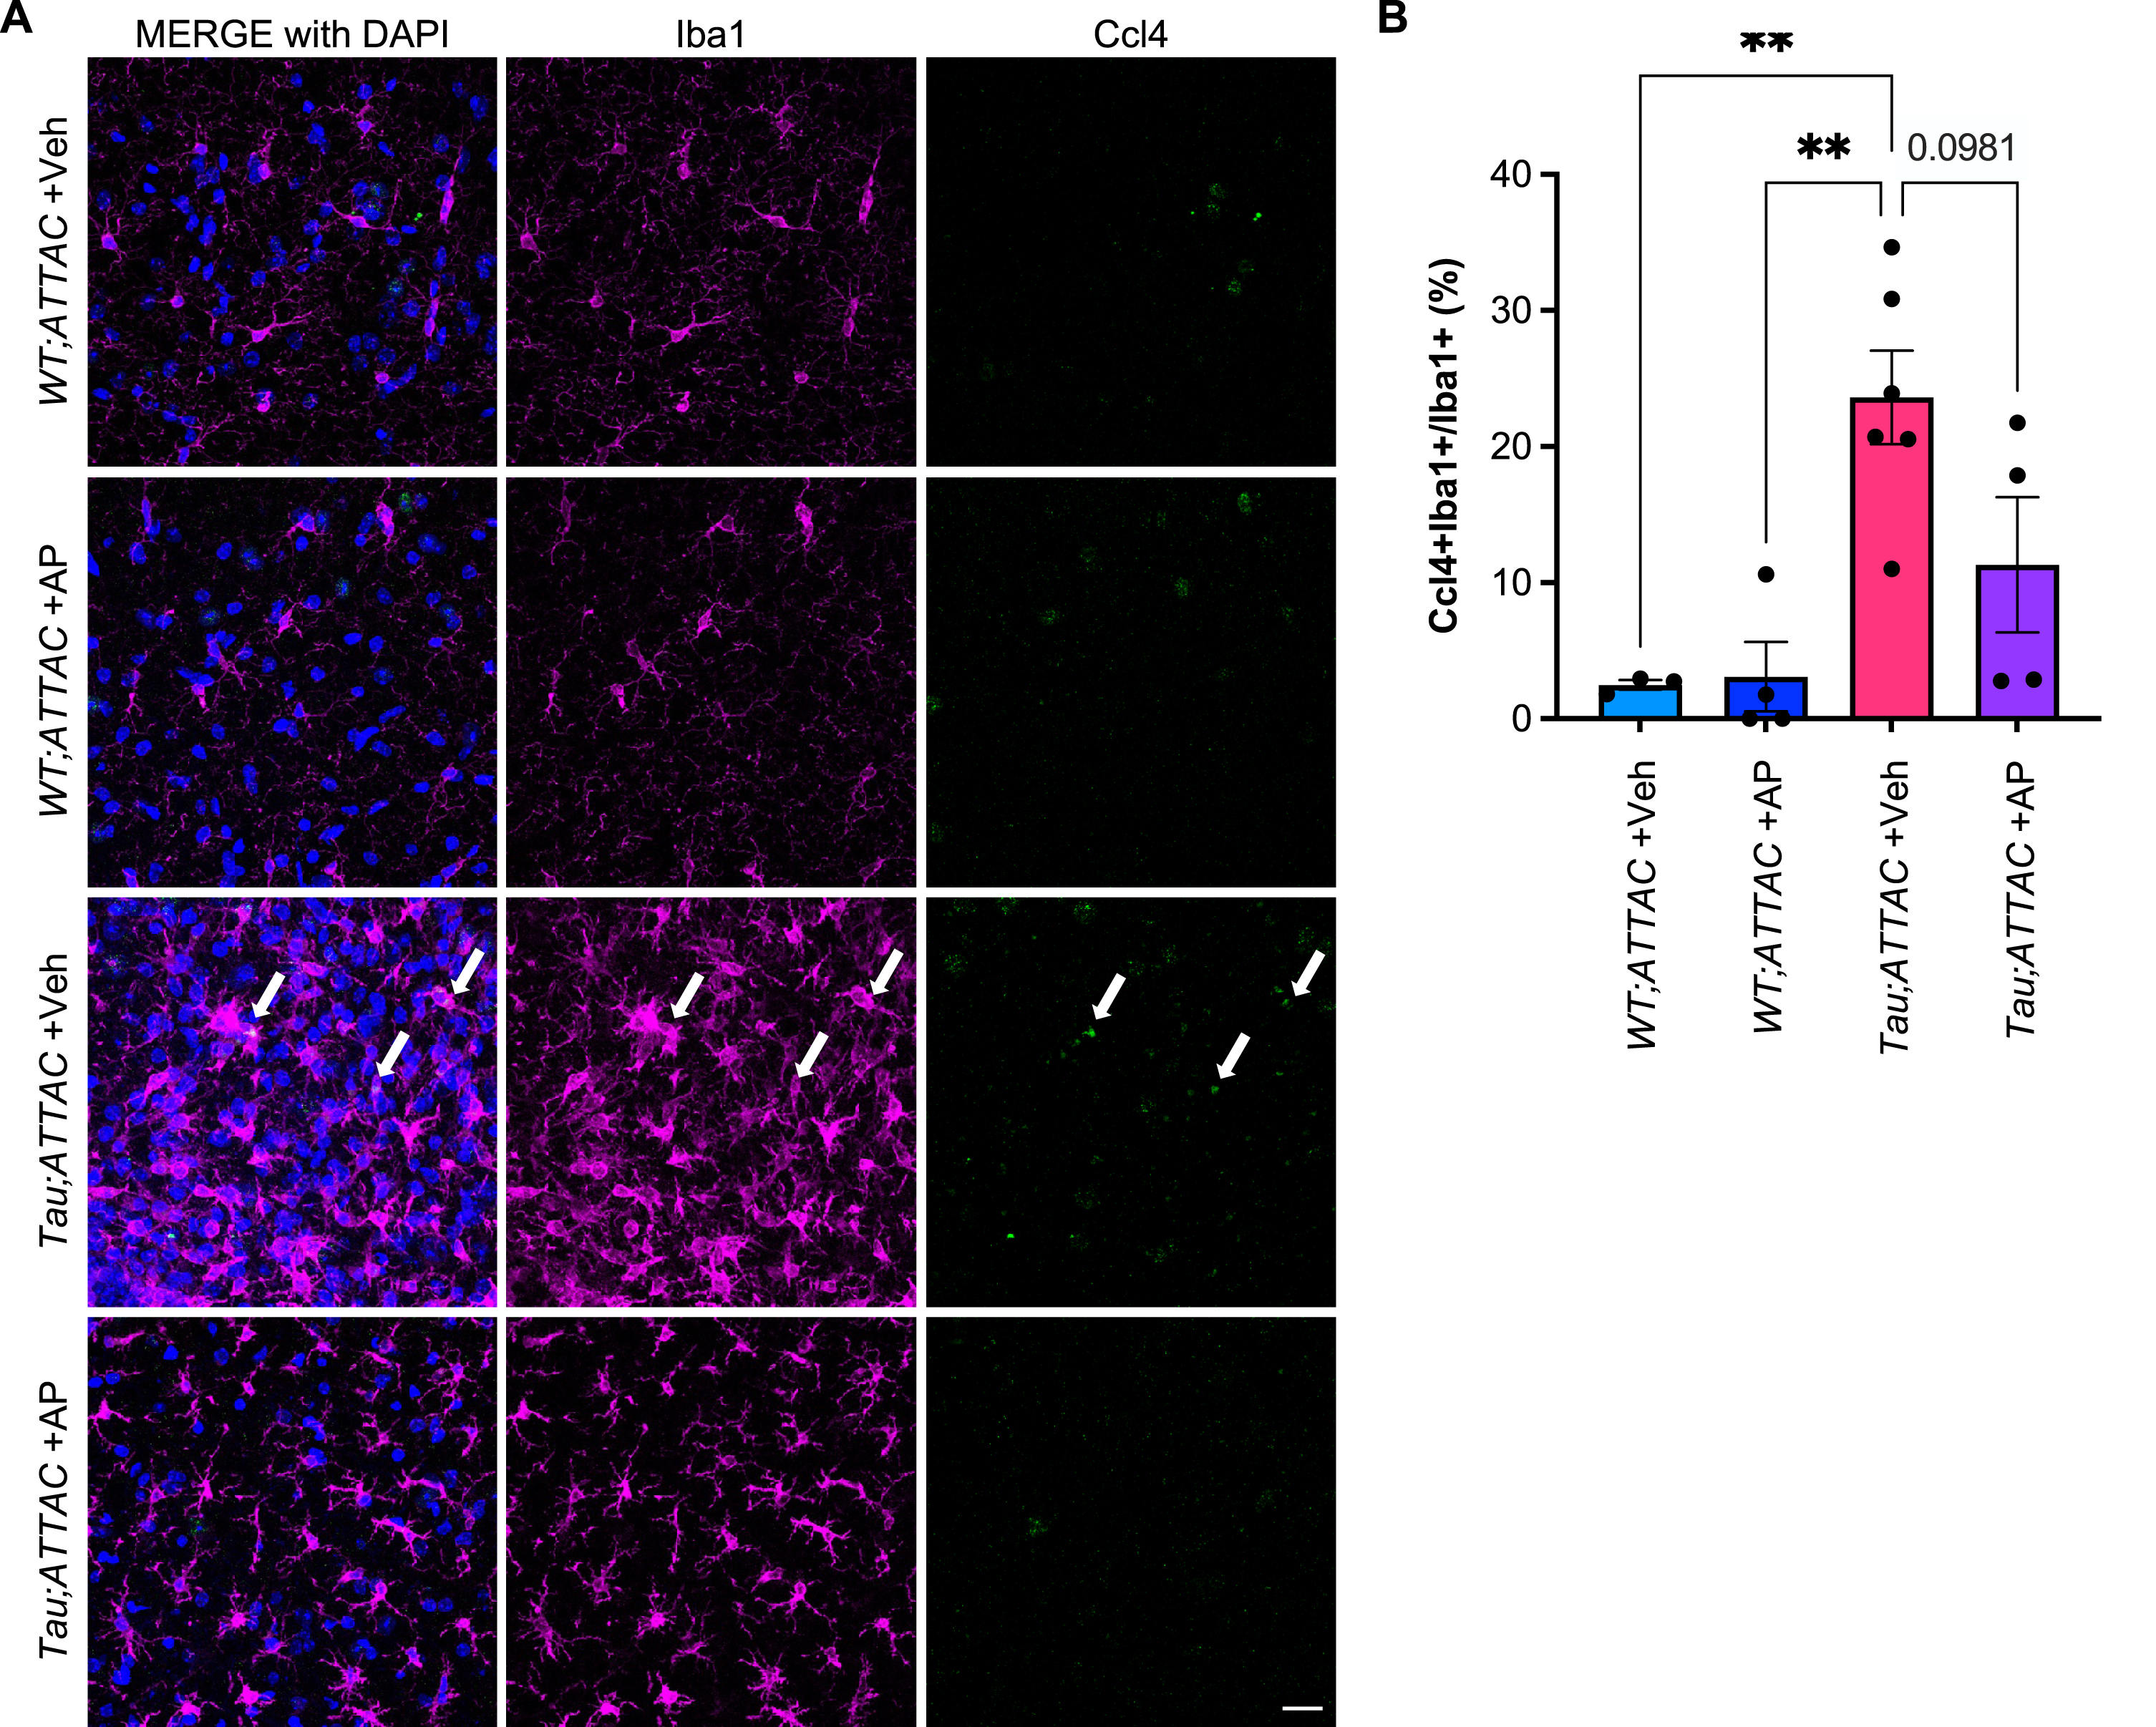
In other contexts, it has been suggested that dystrophic microglia are equivalent to senescent microglia [41]. However, morphological analyses of Ccl4 + microglia from tau mice show that Ccl4 + microglia can be both hypertrophic and dystrophic. We also found dystrophic microglia that did not stain Ccl4 + . This, combined with the observation that other DAM populations also express high levels of dystrophic microglia markers including Fth1 and Ftl1 (Supplementary Figure 2B), suggests that while there can be overlap between dystrophic and senescent microglia, these terms are not synonymous. Others have also suggested that microglial phenotypes in AD mouse models may not accurately represent what is seen in human AD [77]. For example, unlike our observations reported here, the senescence markers 8-hydroxy-2-deoxyguanosine (8-OHdG), hemeoxygenase-1 (HO-1), γ-H2AX, and lipofuscin did not occur preferentially in dystrophic microglia [78].
DISCUSSION
Here, we uncovered unforeseen heterogeneity in microglia isolated from P301 S mice and their wildtype controls. The microglial subsets represent a variety of states, including homeostasis, proliferation, and interferon response. We have also defined a subset of disease-associated microglia (cluster 9) which has features of senescence, such as cell cycle arrest, an inflammatory profile, and high expression of senescence-related genes. This cluster is enriched in the diseased mice compared to wildtype mice, and this enrichment is seen in both male and female mice. This cluster is also enriched in other conditions where senescence is likely to accumulate, such as aging and other neurodegenerative diseases [75, 76].
Microglia have been heavily implicated in neurodegenerative diseases; inflammatory microglia have long been observed to accumulate around Aβ plaques in AD [79]. Additionally, genome-wide association studies have identified several risk alleles in genes expressed by microglia such as TREM2 and APOE which are associated with increased risk of AD [80–82]. Major changes in microglial profile have also been identified in aged and diseased brains [25, 31, 75, 76, 83], although how exactly these changes contribute to disease, how modifiable these changes are, and if altering these microglial states will have any impact on disease remains to be fully elucidated. Targeting senescent microglia presents an interesting opportunity to precisely target a specific population of cells associated with age-related disease, without affecting the beneficial functions of other subsets of microglia such as the clearance of cellular debris, synaptic pruning, and promoting neuronal survival [84, 85].
However, even identifying a senescent microglial population has proven controversial. Defining senescence in immune cells in general is difficult, given the overlaps in senescent and non-senescent associated inflammation. Classically used tools to identify senescence in other cell types, like SA-β-gal staining and p16 or p21 up-regulation, have also been shown in non-senescent immune cells [21–23, 86]. In addition, utilization of single-cell RNA sequencing approaches may result in lowly expressed transcripts (such as Cdkn1a and Cdkn2a in this study) being difficult to detect due to a “dropout” problem [87].
In this study, we propose that a specific subset of disease-associated microglia defined by the expression of Ccl4 is distinct from non-senescent inflammatory microglial populations due to the presence of cell cycle arrest as well as the high expression of senescence-associated genes. Based on pseudotime inference, this senescent population could emerge as a result of microglial proliferation. This would correlate with the specific expression of Egr1 in this Ccl4 + microglia subset, a gene associated with replicative senescence [71, 72]. This would also agree with previous reports of DAM having a senescence-associated profile, and that these senescence-associated DAM were generated from early microglial proliferation [13].
Clearing senescent cells has been shown to improve the pathophysiology and cognitive behavior in a variety of mouse models of aging and neurodegenerative disease [8, 9, 12]. However, the identified cellular populations being cleared in the various models are different, perhaps pointing to the context specificity of each model and/or the under-appreciation of the heterogeneity of senescent cells. Although it is likely that ultimately senescence in a variety of cell types contribute to age-related neurodegenerative disease, identifying senescent microglia can help in the understanding of the role senescence plays in the pathogenesis of neurodegenerative disease, and the development of new treatment strategies.
However, differences in microglial response in mouse models and humans have also been described. For example, some studies suggest that strongly activated microglial cells surrounding plaques have only been seen in mouse models, and that microglia were in fact attenuated around plaques in humans [77]. Other studies also see a similar inflammatory microglial profile in human AD patients [83, 88]. These differences in results from various human studies may reflect the difficulty in sample collection as well as the difference in methodology used, and as such it is still unclear to what extent these findings from mouse models of AD may apply to humans.
Footnotes
ACKNOWLEDGMENTS
We would like to thank T. Thao, and R. Fierro Velasco for genotyping and animal support; I. Sturmlechner and L. I. Prieto for assistance with bioinformatics and helpful feedback on the manuscript; and the Mayo Clinic Genome Analysis Core for RT-qPCR instrumentation and assistance with the single cell RNA-seq experiment.
FUNDING
This work was supported by the National Institutes of Health (R01AG053229, R01AG068076 to D.J.B.), the Glenn Foundation for Medical Research (D.J.B.) and the Agency for Science, Technology and Research, Singapore (stipend supporting P.Y.N.).
CONFLICT OF INTEREST
D.J.B. has a financial interest related to this research. He is a co-inventor on patents held by Mayo Clinic and patent applications licensed to or filed by Unity Biotechnology, a company developing senolytic strategies for treatment of age-related disorders, including small molecules that selectively eliminate senescent cells. Research in the Baker laboratory has been reviewed by the Mayo Clinic Conflict of Interest Review Board and is being conducted in compliance with Mayo Clinic Conflict of Interest policies.