
Abstract
Background:
Clock Drawing Test (CDT) is a commonly used screening tool for cognitive disorders, known for its ease of administration and scoring. Despite frequent use by clinicians, CDT is criticized for its poor predictive value in mild cases of impairment.
Objective:
To evaluate CDT as a screening tool for early stage of cognitive impairment in biomarker-verified Alzheimer’s disease (AD) and depressive disorder (DD).
Methods:
We analyzed CDT of 172 patients with verified AD, 70 patients with DD, in whom neurodegenerative disorder was excluded using cerebrospinal fluid biomarkers, and 58 healthy older adults. CDT was scored using the semi-quantitative (Shulman) and itemized criteria (adapted from Mendez).
Results:
Logistic regression showed that for both DD and AD patients with high Mini-Mental State Examination (MMSE) scores (27 and above) the significant predicting variable is uneven number spacing. As MMSE deteriorates (24-26 points), an additional error of setting clock hands is predictive of the disease. In the low MMSE condition, CDT showed an acceptable discrimination for AD (AUC itemized 0.740, Shulman 0.741) and DD (AUC itemized 0.827, Shulman 0.739) using both scoring methods. In the high MMSE condition, discrimination rates were acceptable using itemized scoring but poor using Shulman scoring for both AD (AUC itemized 0.707, Shulman 0.677) and DD (AUC itemized 0.755, Shulman 0.667) groups.
Conclusion:
Ideally, modern diagnostic process should take place before the cognitive performance drops beneath the healthy range. This makes CDT of little use when screening patients with very mild cognitive deficits.
INTRODUCTION
With ever better therapeutic options for treatment of Alzheimer’s disease (AD) on the horizon, procedures to identify patients with mild cognitive deficits become increasingly important. The therapies currently in development target pathophysiology of AD rather than being symptomatic treatments. Thus, screening tests need to be evaluated for their ability to characterize mild neuropsychological deficits with regards to their etiology. In addition, for use in general practitioner’s settings screening tests need to administered and scored quickly.
Clock Drawing Test (CDT) is one of the most widely used screening tests for cognitive disorders. CDT was first validated by Shulman in 1986 [1] and at the time belonged to a range of drawing tests that were used to investigate cognition, such as cube-drawing [2], house-drawing [3], or a tree-lined-avenue-drawing [4]. Popularity of the CDT can be attributed to its easy administration—the patients are instructed to draw a face of a clock with the hands of the clock indicating a particular time. A widely cited review of the CDT [5] states that the test has high levels of sensitivity and specificity as well as concurrent and predictive validity. However, many studies on validity and reliability derived their data from comparisons of patients with well-established AD and healthy controls [6–14]. This leaves a question of whether CDT is equally suitable for early disease detection.
With the new treatment techniques emphasizing importance of early diagnosis for a successful treatment, screening tools need to keep up. This does not seem to be the case for CDT. However scored, CDT seem to be only modestly successful in identifying cases of mild dementia [15, 16] and could not discriminate between cases with very mild dementia of Alzheimer’s type and healthy controls at all [17]. Studies using CDT for the screening of mild cognitive impairment reported mixed results using several scoring types [18, 19].
CDT scoring systems can be broadly divided into qualitative, semi-quantitative, and quantitative approaches [20]. Qualitative analyses of the clock are the most subjective and describe typical errors in the drawing by considering the clock as a whole [21–24]. Quantitative approaches on the other hand are represented by numerical scales with objective and fast scoring that focuses on one aspect of the clock at a time [12, 25–27]. A compromise between the two systems, a semi-quantitative approach, uses a numerical scale to characterize a subjectively evaluated clock drawing [1, 28]. A semi-quantitative method proposed by Shulman is the one used most widely today [29]. To improve its accuracy some researchers suggested to use CDT in in conjunction with the Mini-Mental State Examination (MMSE) [30], verbal fluency, and informant reports. This has become a critique point, for if a screening tool cannot be used in isolation, can it really be used as a stand-alone test [31]. Aiming to increase the ability to distinguish different patterns of cognitive deficits it was suggested to use quantitative analyses, such as the one suggested by Mendez [12], hoping that its itemized nature will be more helpful in describing profiles for different types of dementia [21, 32].
While CDT is mostly used to screen for cognitive deficits in patients with suspected dementia it has also been used to detect cognitive deficits in depressive disorders (DD) [33]. Depression and dementia of Alzheimer’s type share a number of symptoms in the initial stages of the disease such as apathy, loss of interest and decreased cognition [34]. Classical cognitive impairments in AD are progressively worsening episodic memory function and spatial orientation [35]. In addition to these initial symptoms, executive function, memory, planning, and attention become impaired as disease progresses [35]. Patients with DD seem to suffer particularly from decreased executive function as well as reduced verbal learning capacity; the latter is especially evident in late-onset DD [36, 37]. Deficits in verbal learning are reported to occur due to poor consolidation as well as poor recall among DD patients [38–40]. Morphologically both conditions present with atrophy in temporal und frontal structures and white matter lesions and [41]. It comes as no surprise that they are hard to tell apart in the initial stages. Despite the initial similarity in cognitive and affective domains, the treatment path for these two conditions is different and warrants an early and accurate diagnosis.
Using biomarkers, the diagnosis of AD can be verified and AD can be ruled out in patients with depressive symptoms [38]. The authors are not aware of any study looking at the characteristics of the CDT in patient groups with verified AD and verified DD. The current study aimed to analyze two different scoring systems of the CDT with regard to their ability to distinguish between patients with verified very early AD and patients with DD, in whom AD pathology was ruled out.
MATERIALS AND METHODS
This study is a retrospective observational study. We used in- and outpatient records from the gerontopsychiatric services of Ulm University at Bezirkskrankenhaus Günzburg from 2014 to 2018. The study received approval of the ethics committee of Ulm University (289/18). It was conducted in accordance with the ethical standards of the University of Ulm and the guidelines outlined in the declaration of Helsinki [42].
Study sample
Our study sample was selected from records of 3,758 in- and outpatients that were referred to the Geriatric Psychiatry services of Ulm University at Günzburg hospital between 2014 and 2018. Exclusion criteria were age under 60, MMSE score of under 24 as well as psychiatric diagnoses other than AD and DD. All participants received a detailed neuropsychological evaluation consisting of verbal memory (measured by California Verbal Learning Test [43], including five learning trials, immediate and delayed recall (without and with cues) and recognition), verbal and visual span forward and backward [44], Trail Making Test A and B [45] and semantic (category animals) and phonetic (words beginning with letter P and S) fluency [46]. All AD and DD patients met the respective diagnostic criteria of mild AD or DD according to the 10th version of the International Classification of Diseases (ICD-10; [47]). Diagnoses were backed up by taking medical history, exploring the current symptoms, and performing a physical examination. AD was additionally verified using cerebrospinal fluid (CSF) biomarkers (amyloid-β (Aβ)1 - 42 < 550 pg/ml, total tau > 300 pg/ml, or phospho-tau>61 pg/ml). DD was additionally verified by including only patients with biomarkers not suggestive of AD pathology (Aβ1 - 42 > 550 pg/ml, total tau < 300 pg/ml, phospho-tau<61 pg/ml). Patients with subjective cognitive complaints, whose subjective memory complaints could not be verified through a neuropsychological examination and who presented with inconspicuous medical history, normal physical examination, and no indication of gradual cognitive decline, were classified as healthy controls. The final sample analyzed in this study consisted of 58 participants in the control group (CG), 70 persons with DD, and 172 persons with AD. The demographics and average scores of neuropsychological evaluation for all groups are presented in Table 1.
Participant demographic data. Results are displayed as Mean±Standard Deviation
AD, Alzheimer’s disease; CVLT, California Verbal Learning Test; DD, Depressive Disorder; CG, Control group; GDS, Geriatric Depression Scale; MMSE, Mini-Mental State Examination; TMT, Trail Making Test.
Materials
Mini-Mental Status Examination [30]: The MMSE is a widely used instrument to give on overview over global cognitive functioning. It comprises questions on orientation, registration, short-term memory, language use, comprehension, and basic motor skills. The score ranges from 0 –30, with a score below 24 indicating a cognitive impairment.
Geriatric Depression Scale [48]: The short version of the Geriatric Depression scale is a 15-item questionnaire to assess symptoms of depression. Participants are asked to answer each item with yes or no. One point is given for each answer compatible with the symptoms of depressive disorder. Scores above five indicate a particular severity of depression: 5-8 mild, 9-11 moderate and 12-15 severe.
Clock Drawing Test: In the CDT, participants were presented with A4 sheet with a circle on it and asked to complete a face of the clock with the hands indicating a time “ten past eleven”. The present study used two separate scoring methods.
Itemized: This scoring method was derived from the original scoring of separate error types proposed by Mendez [12]. The clock is scored by individually assessing 20 items and comprises three major components: general impression, clock numbers and clock hands. Few modifications were added in the current study. Firstly, as proposed by Nakashima [49] all items were renamed to reflect the error type this item represents. One point was given for an error in each item. In cases where one of the major components of the clock was not present, all items in this group were considered an error. Secondly, we decided to split items 4 (a “2” is present and is pointed out to indicate the time) and 9 (an “11” is present and is pointed out to indicate the time) in the original Mendez system to separate the errors of a missing number and the clock hands not pointing to that particular number. Finally, as the template used for the CDT already contained a circle, we removed the item 3 (there is a closed figure without gaps) from the original Mendez scoring. The final scoring system used in this study consisted of 21 items (Table 2).
Error types in CDT drawing test
Shulman [29]: This scoring method consists of a hierarchical scale, where a clock is analyzed as a whole. The original method uses scores from 5 to 0 with lower scores indicating greater severity. In this study we used a German adaptation with scores from 1 to 6, where a higher score indicates greater severity: 1 = a perfect clock; 2 = minor visuospatial errors; 3 = acceptable visuospatial organization, but incorrect time; 4 = moderate visuospatial disorganization of numbers, 5 = severe visuospatial disorganization; 6 = no reasonable attempt to draw a clock.
Statistical analyses
All statistical data analyses were carried out using the statistics program SPSS (SPSS 25.0 for Windows, Armonk, NY, 2017). A binomial logistic regression was used to predict the probability that participants fall into the control or disease (AD and DD) group based on the errors they have made in the CDT. Probabilities calculated in the regression models of the itemized CDT scoring method as well Shulman method scores were used to produce ROC curves to compare their overall discriminatory ability over different conditions.
RESULTS
Figure 1 represents percentages of items that were scored as correct using Itemized scoring criteria (Fig. 1A) and percentage of scores using Shulman criteria (Fig. 1B) in each group. Note that for better graphical representation Fig. 1A represents not errors (as used in the subsequent analyses) but the correct scores.
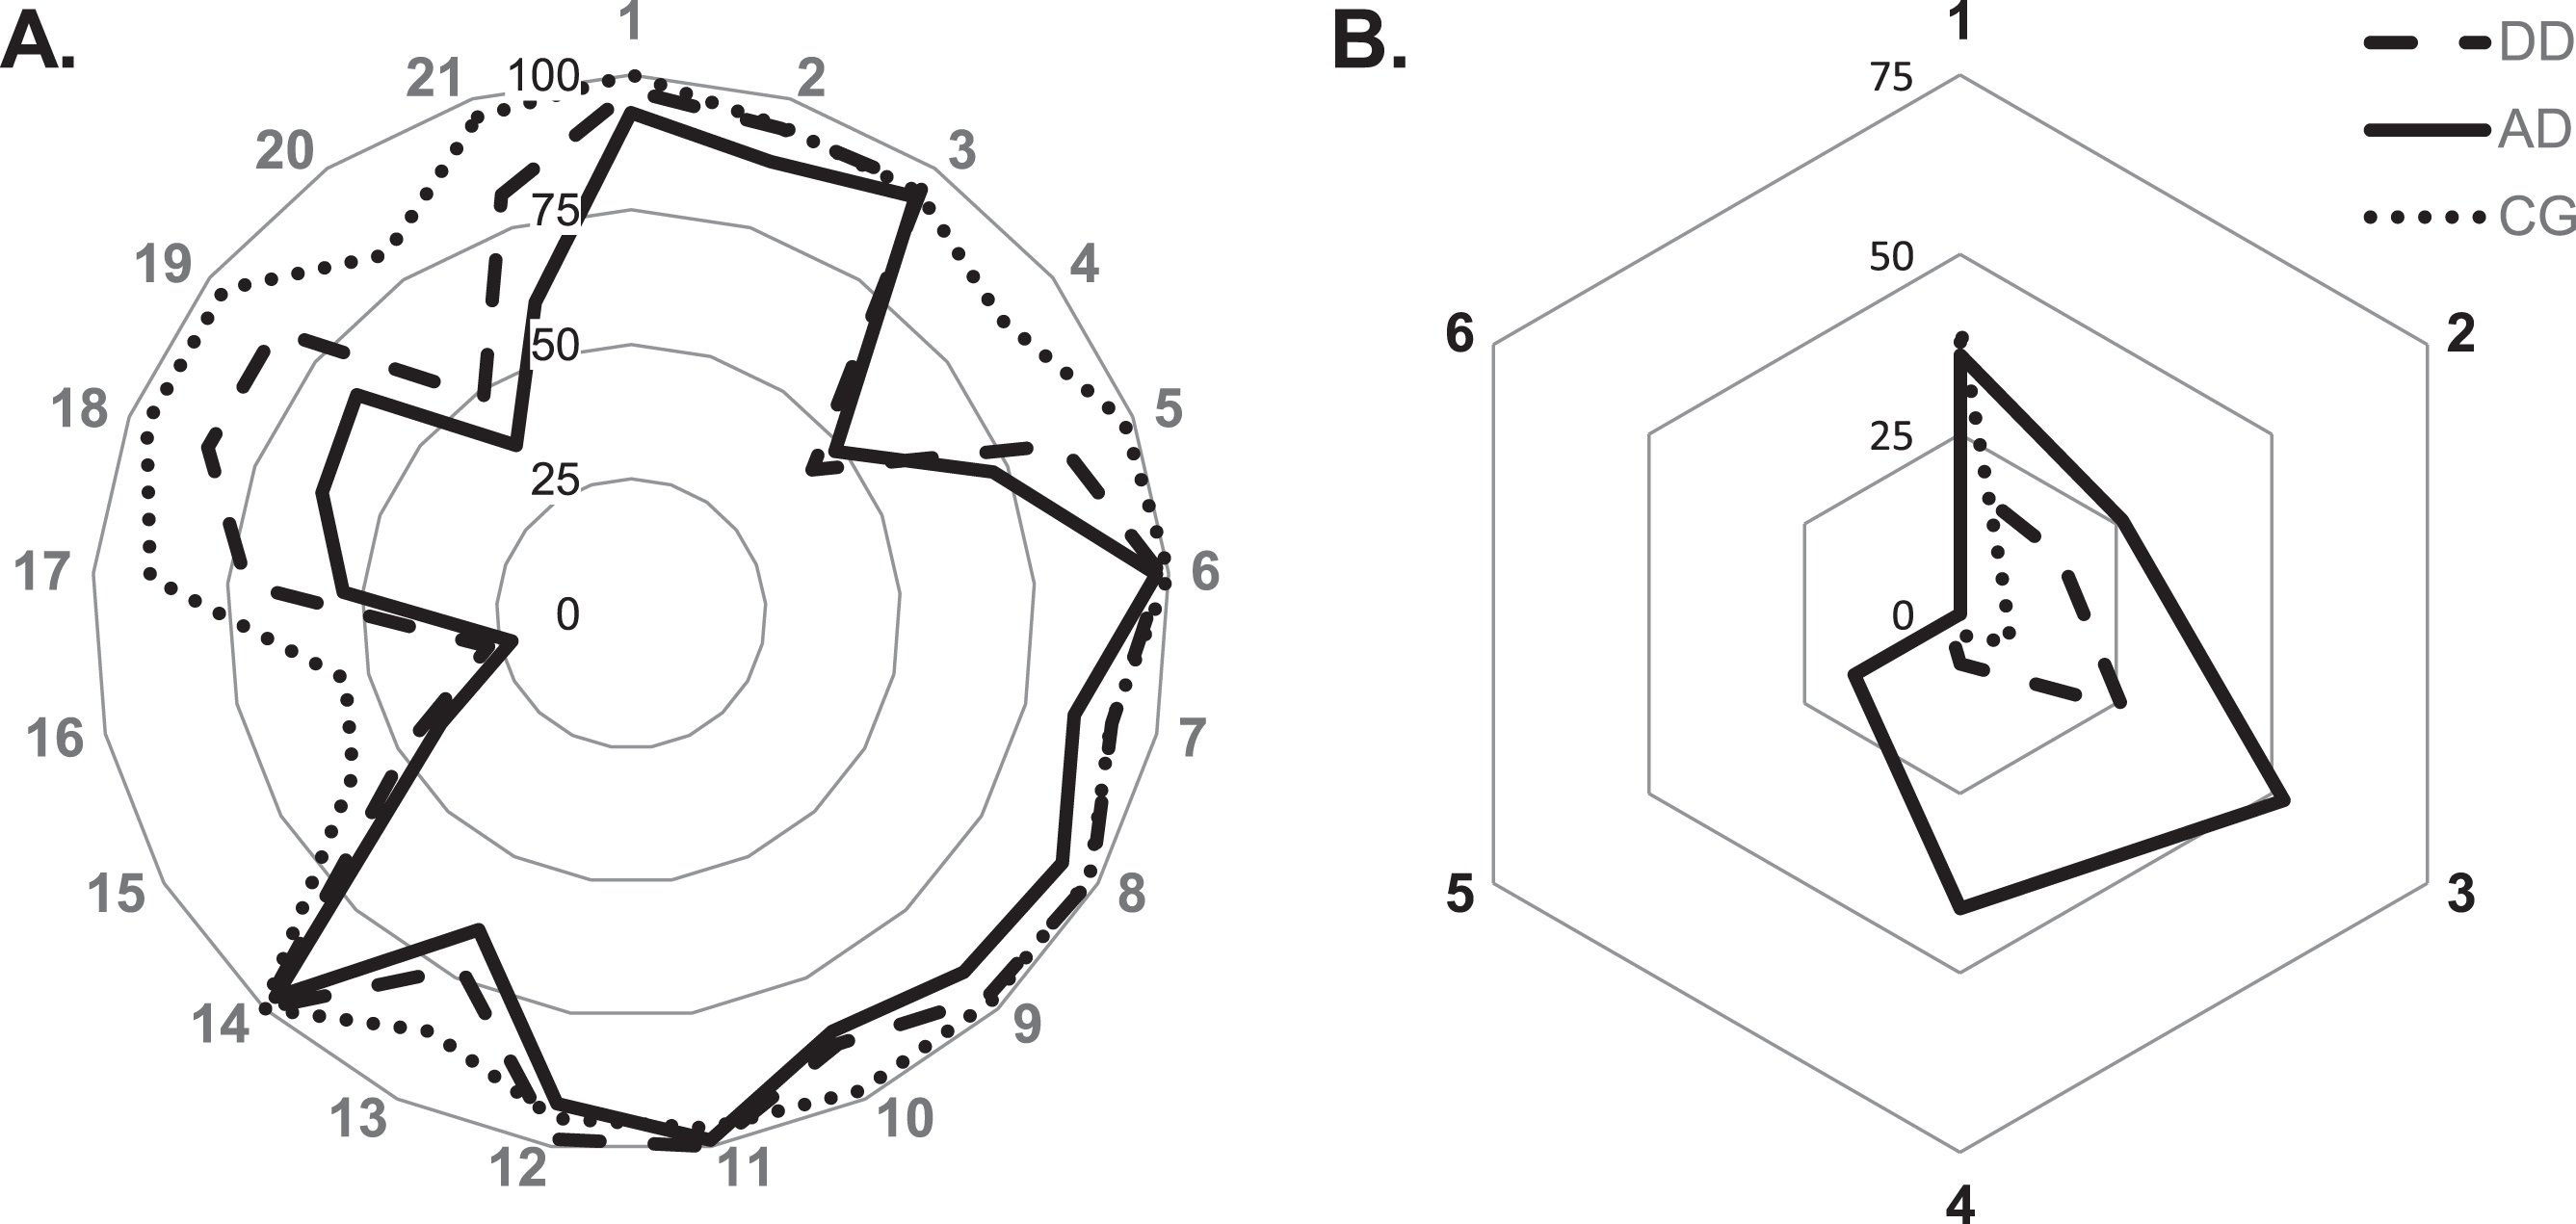
A) Percentage of correct items using itemized scoring (see Table 2 for item descriptions). B) Percentage of achieved scores per group using Shulman scoring. AD, Alzheimer’s disease; CG, control group; DD, depressive disorder.
Itemized scoring
Separate binomial logistic regression analyses were performed to ascertain the effects of CDT items on the likelihood that participants have DD and AD respectively. CDT items, where at least a half of participants in the respective group scored wrong, were used for the analysis. For both groups it comprised items 4, 15, 16, and 20. We first analyzed the complete sample and later divided each sample into subgroups of high MMSE scores (values 27 and above) and low MMSE (values between 26 and 24). The demographic data of the participants in high and low MMSE conditions can be found in Table 3.
Demographic data of AD and DD groups divided by MMSE scores. Results are displayed as Mean±Standard Deviation
AD, Alzheimer’s disease; CG, Control group; CVLT, California Verbal Learning Test; DD, Depressive Disorder; GDS, Geriatric Depression Scale; MMSE, Mini-Mental State Examination; TMT, Trail Making Test.
The logistic regression model for the complete DD group was statistically significant and explained 30% of the variance. Items 4 (uneven distribution of numbers along the face of the clock) and item 20 (hand of the clock not pointing to number 2) were significant predictors and increased the likelihood of DD. The model for the high MMSE DD group was significant and explained 28% of the variance (Nagelkerke R2) with item 4 being a significant predictor. Logistic regression model for low MMSE DD group was likewise statistically significant and explained 40% of the variance (Nagelkerke R2) with items 4 and 20 being significant predictors for DD (Table 4).
Logistic regression predicting likelihood of depressive disorder and Alzheimer’s disease based on Clock Drawing Test
AD, Alzheimer’s disease; CG, control group; DD, depressive disorder; MMSE, Mini-Mental State Examination. *Error Items 4 (numbers spaced unevenly), 15 (shifted clock center), 16 (clock hands are same length), 20 (hand does not point at number 2).
Similarly, the logistic regression model for AD was statistically significant χ2 (4)=20.161, p < 0.001. The model explained 17% of the variance (Nagelkerke R2) and correctly classified 69.3% of cases. Items 4 was the only significant predictor in the model, with errors in it increasing the likelihood of AD. The model for the high MMSE AD group was significant and explained 18% of the variance (Nagelkerke R2) with item 4 being a significant predictor. Logistic regression model for low MMSE AD group was likewise statistically significant and explained 22% of the variance (Nagelkerke R2) with items 4 and 20 being significant predictors for AD (Table 4).
Finally, to test the suitability of CDT in differential diagnostic we have calculated analyzed the how well CDT with itemized scoring can differentiate between AD and DD patients (all MMSE values). The test showed 100% specificity and 0% sensitivity classifying all patients in the AD group.
Shulman scoring
Logistic regression analysis for Shulman criteria scores returned statistically significant model for DD group and explained 19% of variance. Models for high and low MMSE DD groups were likewise significant and predicted 13% and 28% of variance respectively. Similarly, the logistic regression models for AD were statistically significant; the model explained 29% of the variance for the complete AD group, 26% for the high MMSE AD group, and 40% for the low MMSE AD group (Table 4). Lastly, we looked into how well CDT can discriminate between AD and DD patients using Shulman scoring (all MMSE values). Similarly like with itemized scoring, all patients were classified in the AD group resulting in 100% specificity and 0% sensitivity.
The values of accuracy, sensitivity, and specificity for AD and DD category predictions using itemized and Shulman scoring are displayed in Table 5.
Classification of cases using Mendez and Shulman divided by MMSE
AD, Alzheimer’s disease; CG, control group; DD, depressive disorder; MMSE, Mini-Mental State Examination. * Error Items 4 (numbers spaced unevenly), 15 (shifted clock center), 16 (clock hands are same length), 20 (hand does not point at number 2).
The probabilities of the logistic regression models of both DD and AD for high and low MMSE scores were used to produce ROC curves and compare CDT results scored using itemized and Shulman criteria (Figs. 2 3). The criteria proposed by Hosmer [50] were used as guidelines in the AUC analysis (AUC < 0.7 = poor discrimination; 0.7 ≤ AUC <0.8 = acceptable discrimination; 0.8 ≤ AUC <0.9 = excellent discrimination; AUC ≥ 0.9 = outstanding discrimination). The results are displayed in Table 6 and show acceptable or excellent discrimination for itemized scoring method across groups, whereas CDT loses its discriminatory ability in the groups with high MMSE value.

Discriminating ability of Shulman and itemized criteria illustrated by ROC curves for high and low MMSE in Alzheimer’s disease. See Table 6 for numerical values of area under the curve.

Discriminating ability of Shulman and itemized criteria illustrated by ROC curves for high and low MMSE in Depressive Disorder. See Table 6 for numerical values of area under the curve.
Area under the curve assessment for high and low MMSE values in AD and DD
AUC, area under the curve; CI, confidence interval; *Error Items 4 (numbers spaced unevenly), 15 (shifted clock center), 16 (clock hands are same length), 20 (hand does not point at number 2).
DISCUSSION
Inspection of the graph depicting the frequency of the separate error types in the clock-drawing test shows that lines representing different participant groups follow a similar pattern, differing in the frequency of the errors. Patients with both DD and AD seem to be susceptible to two types of visual-spatial and executive errors. Both DD and AD groups seem to have difficulties spacing the numbers evenly and determining the clock center as well as disregard the length difference in the hands of the clock and do not point the hand of the clock at number 2 to indicate 10 minutes.
Although it was not the focus of this paper, it is worth pointing out, the potential importance of separating the nonexistence of numbers 2 or 11 and the hands of the clock not pointing to these particular numbers as separate errors. Nonexistence of number 2 (item 3) or number 11 (item 8) followed a similar pattern as nonexistence of other numbers (item 9). This type of item error is generally associated with visuospatial difficulty and deficits in the right parietal lobe [49, 52]. On the other hand failure to set the clock hands points towards the dysfunction of the frontal lobe and could reflect difficulties in abstract thinking [53, 52].
Logistic regression analysis identified two items as significant predictors. In the low MMSE group, where MMSE values ranged from 24 to 26, uneven spacing of numbers and clock hands not pointing to number 2 were significant predictors for both AD and DD. On the other hand, for high MMSE group, with MMSE scores 27 and above, only uneven spacing predicted the disease condition.
Uneven spacing of numbers reflects a broader deficit in visuospatial planning, which has been described to occur in AD [21, 54] and affects as many as 43% of patients [55]. Among other deficits in constructing representations of visual scenes and objects AD patients show deficits in spatial coherence [56]. The remembered or imagined objects lack spatial integration, are fragmented or misplaced. These reports closely resemble the clocks drawn by AD participants in regards of correctly spacing the numbers on the face of the clock. Neuroanatomical studies have reported that this type of error was associated with impairments in frontal lobe [49] as well as nondominant right parietal lobe [52]. A successful visual planning of a clock face additionally requires successful communication between frontal and parietal lobes [57] that coordinate visuospatial understanding of the clock. Frontoparietal circuits seem to be adversely affected by depression and result in problems with cognitive flexibility and cognition, especially in integrating information into coherent mental representations [58], such as a face of a clock.
Incorrect placement of the clock hands was an error more descriptive of a higher-level impairment as measured by the MMSE. Other studies found that this error directly related to executive functioning and was able to discriminate between early dementia of Alzheimer’s type from other dementia forms [59] and from healthy controls [60]. Most of the participants in the current and similar studies place the minute hand of 10 instead of 2, to indicate the time “ten past eleven” [49, 60]. Correct placement of the clock hands requires a transformation of the verbal time indication to its correct representation on a clock. This is facilitated by semantic memory where the knowledge about conceptual time representation and that of a clock functionality is stored. Access to semantic storage is impaired in early stages of AD [61–63]. Correct placement of the clock hands requires a transformation of the verbal time indication to its correct representation on a clock. This is facilitated by semantic memory where the knowledge about conceptual time representation and that of a clock functionality is stored. Access to semantic storage is impaired in early stages of AD [21, 64].
CDT is mostly known and used for dementia screening, therefore literature on its diagnostic value in DD is relatively scarce and mostly describes CDT as a tool to detect underlying dementia [65, 66]. Later studies showed, that even among patients with depression without concomitant diagnoses, an executive dysfunction correlates with lower CDT scores [67]. Clock setting in particular discriminates between patients with DD and healthy controls [68]. In good harmony with our results, Klein and colleagues [69] reported that overall CDT score correlated significantly with the semantic memory impairment relating to minute hand functionality. Additionally depressed individuals with late onset depression performed significantly worse than individuals with early onset depression in tasks concerning minute hand placement and digit arrangement in the clock face. The current study builds up on these results suggesting that the deficits in question are directly related to depression, since neurodegenerative disease in the current sample was excluded using biomarkers.
Although AD and DD are distinct disorders, they share a lot of common symptoms when it comes to cognitive deficits, such as memory, attention, visuospatial and executive functions [38]. This phenotypical similarity is well reflected in the findings of the current study as both disease groups showed the same types of errors. Given blurred boundaries between AD and DD when it comes to most cognitive deficits, diagnostic process should rely on a more detailed evaluation of a telltale sign of AD—episodic memory. Hodges and colleagues [35] have reported that AD follows a sequential pattern of deficits, which starts with episodic memory and are followed by attention, working-memory, and executive functions later on. DD lacks such a clear-cut pattern of deficits and may involve some or all of the AD deficits to varying degrees and differing time of onset. This leaves early episodic memory deficits as a most reliable criteria within differential diagnostics. Admittedly, a thorough evaluation of episodic memory is a considerably lengthier process, requiring a trained neuropsychologist. This could, however, give a much clearer picture of the symptomatic constellation of the particular patient and help decide on the most efficient further steps for each individual.
Due to quick and easy administration CDT appeal remains high. It is arguably a valuable addition to the GP’s assessment package as a rough verification of subjective complaints [66]. However, it should be kept in mind that impaired performance in CDT does not necessarily point to a specific etiology of the complaints. Similarly, inconspicuous result does not guarantee an absence of illness. If used for initial screening or as a follow-up tool, CDT should be applied with its limitations in mind. As evident from the ROC curves, itemized quantitative scoring is more valuable than a semi-quantitative Shulman scoring in detecting cognitive deficits. If at all used, Shulman scoring method should only be applied for individuals with at least moderate cognitive deficits. If cognitive deficits are mild, or have not been previously assessed, it is recommended to use only itemized scoring for initial screening. When communicating CDT results, types of error should be included in the report, as these potentially indicate the severity of cognitive decline.
The current study has potential limitations. As the design of the study was retrospective, we collected and scored clock drawings readily available at the hospital’s medical record archives and did not administer CDT ourselves. The number of the previous depressive episodes for DD group could not be accurately determined and was not accounted for in this study. The number of the depressive episodes could potentially have had an impact on the severity of cognitive impairment in this group [70]. Although the classical paper-pencil administration of the CDT is predominantly in use by clinicians, a digital version of the CDT [71, 72] has been gaining momentum in the research community as a tool to evaluate neuropsychological deficits [73–77]. Compared to the classical administration it offers additional graphomotor and latency parameters, which are hard to capture otherwise [78, 79]. As digital CDT requires additional hardware for its administration it might not be practical for many clinicians. Alternative can be offered by an automated algorithm-based scoring [80–82]. Future studies should aim to look into additional value to early differential diagnostics provided through digital administration and machine-learning scoring of the CDT.
Conclusion
Analysis of clocks drawn by patients with verified AD and patients with DD without concomitant neurodegenerative disease showed that CDT is a poor choice for early and adequate diagnostic process. Type of scoring played a crucial role in test’s accuracy. Itemized error by error scoring showed better discriminability than semi-quantitative method. Two errors stood out as particularly common for both AD and depression—uneven number spacing was the most typical of very light cognitive impairment, followed by errors setting clock hands as the cognition worsens. Overall, the CDT offers some insights into visual-spatial capabilities; however, it is time to let the test go as a screening tool.
Footnotes
ACKNOWLEDGMENTS
KS, FG, and CL were responsible for data acquisition. KS and MR were responsible for data interpretation, drafting and revising the manuscript. All authors approved the final version of the manuscript.
FUNDING
The authors have no funding to report.
CONFLICT OF INTEREST
The authors have no conflict of interest to report.
DATA AVAILABILITY
The data supporting the findings of this study are available on request from the corresponding author. The data are not publicly available due to privacy or ethical restrictions.