
Abstract
Background:
Alzheimer’s disease (AD) is a complex neurodegenerative disease, and increasing evidence has linked dysregulation of amino acids to AD pathogenesis. However, the existing studies often ignore the chirality of amino acids, and some results are inconsistent and controversial. The changes of amino acid profiles in AD from the perspective of enantiomers remain elusive.
Objective:
The purpose of this study is to investigate whether the levels of amino acids, especially D-amino acids, are deregulated in the peripheral serum of AD patients, with the ultimate goal of discovering novel biomarkers for AD.
Methods:
The chiral amino acid profiles were determined by HPLC-MS/MS with a pre-column derivatization method. Experimental data obtained from 37 AD patients and 34 healthy controls (HC) were statistically analyzed.
Results:
Among the 35 amino acids detected, D-proline, D/total-proline ratio, D-aspartate, and D/total-aspartate ratio were decreased, while D-phenylalanine was elevated in AD compared to HC. Significant age-dependent increases in D-proline, D/total-proline ratio, and D-phenylalanine were observed in HC, but not in AD. Receiver operator characteristic analyses of the combination of D-proline, D-aspartate, D-phenylalanine, and age for discriminating AD from HC provided satisfactory area under the curve (0.87), specificity (97.0%), and sensitivity (83.8%). Furthermore, the D-aspartate level was significantly decreased with the progression of AD, as assessed by the Clinical Dementia Rating Scale and Mini-Mental State Examination.
Conclusion:
The panels of D-proline, D-phenylalanine, and D-aspartate in peripheral serum may serve as novel biomarker candidates for AD. The latter parameter is further associated with the severity of AD.
INTRODUCTION
Alzheimer’s disease (AD), the predominant cause of dementia worldwide, is characterized by a complex and multifactorial etiology. AD, as a chronically progressive neurodegenerative disease, has an estimated prevalence of 10–30% population over 65 years of age, with an incidence of 1–3% [1]. With the rapid growth of elderly populations, the number of people affected by AD is predicted to triple by 2050, unless effective interventions are developed and implemented [2].
Currently, the preliminary diagnostic methods of AD are based on cognitive tests, brain imaging techniques, and cerebrospinal fluid (CSF) assays [3, 4]. Accumulated clinical data support that three core CSF biomarkers of amyloid-β42 (Aβ42), total tau protein, and phosphorylated tau can represent the crucial elements of AD pathophysiology [5]. Low concentrations of Aβ42 are detected in the CSF of AD patients because of cortical amyloid deposition, and elevated concentrations of total tau protein and phosphorylated tau due to cortical neuronal loss and cortical tangle formation, respectively [6]. Such CSF biomarkers have been advocated for research purposes, but they are expensive, invasive, and even inaccurate [7]. Besides, sensitivity and specificity issues have raised concerns about their clinical applicability [8]. Furthermore, growing evidence shows that the amyloid cascade hypothesis and neurofibrillary tangle pathology cannot encapsulate the complex and heterogenous symptomology of AD [9, 10]. Therefore, expanding the AD biomarker toolbox with minimally invasive, easily accessible, and cost-effective alternative biomarkers is urgently needed.
Numerous studies have shown that amino acids are associated with brain and neurological disorders over the last few years. The known neurological functions of amino acids include energy metabolism regulators, neuromodulators, and neurotransmission via N-methyl-D-aspartate receptors (NMDARs), which are important glutamate receptors involved in learning, memory, and synaptic plasticity [11]. Deregulated amino acids and amino acid catabolites may lead to toxicity-induced AD progression [12]. Studying AD from the perspective of amino acid metabolism is expected to provide new insights into the pathogenesis of AD and may discover dietary metabolite supplements to partially delay or alleviate some of the pain caused by AD [12, 13]. It is worth noting that most amino acids have chiral centers and exist in two forms, namely, levorotatory (L-) and dextrorotatory (D-) enantiomers pairs, which have different biological functions [14]. L-amino acids are common components of proteins and are abundant in mammals, whereas the presence of D-amino acids has been underestimated for a long time. However, some studies investigated amino acids as a whole [13, 15], which might miss some important information and even draw inaccurate conclusions. Hence, the enantioselective measurement of multiple chiral amino acids in peripheral blood provides a comprehensive and accessible approach.
In recent years, there are increasing reports about the changes of peripheral amino acid profiles, especially D-amino acid profiles, in AD patients, but the results are inconsistent and controversial. The slight decrease in D-serine (D-Ser) level, slight increase in L-Ser level, and a significant decrease in D/total-Ser (D/T-Ser) ratio were observed in the serum of AD patients compared to healthy controls (HC) [16]. However, these results have not been confirmed in the subsequent comparisons between preclinical AD, mild cognitive impairment (MCI), and overt dementia. Notably, the changes of L-Ser, D-Ser, and D/T-Ser ratio, as well as D-aspartate (D-Asp), L-Asp, and D/T-Asp ratio were not statistically significant [17]. In order to solve this discrepancy, the serum levels of Ser and Asp enantiomers in AD patients and HC were evaluated. Significant increases in D-Ser and D/T-Ser ratio were observed, while the levels of D-Asp and L-Asp did not change significantly [18]. Moreover, the serum levels of glycine (Gly), Ser, Asp, alanine (Ala), and glutamate (Glu) enantiomers in MCI, mild AD, moderate-to-severe AD, and HC were compared. The levels of Gly, D-Glu, and D/L-Glu ratio were significantly different between inter-groups and decreased with the severity of cognitive deficits [19]. Subsequently, the same group of researchers concluded that lower D-Glu and higher D-Ala may predict more severe behavioral symptoms [20]. A recent study showed that D-Glu and D/L-Glu ratio were significantly decreased in MCI and AD patients compared to HC [21]. Nonetheless, the existing studies cover incomplete chiral amino acid panels, and the confounding results need further verification.
This study aimed to expand the panels of chiral amino acids, clarify whether the levels of amino acids, especially D-amino acids, in the peripheral serum of AD patients are deregulated, and evaluate their potential as novel biomarkers in AD. Amino acid enantiomers were first separated and measured using a well-established HPLC-MS/MS method. The association between amino acid enantiomers and AD progression was investigated, and the possible implications of these specific D-amino acids on AD were also discussed.
MATERIALS AND METHODS
Subject recruitment and sample collection
AD patients (n = 37) and HC (n = 34) were recruited from the Beijing Geriatric Hospital, China (Chinese Clinical Trial Registry Identifier: ChiCTR1800014839). This study was approved by the Ethics Committee of Beijing Geriatric Hospital (no. 2017-013) and was carried out in accordance with the current revision of the Declaration of Helsinki. All participants or their guardians provided informed written consent before enrollment and were assessed by psychiatrists based on a thorough diagnostic workup.
All patients were diagnosed as probable AD according to the National Institute of Neurological and Communicative Disorders and Stroke - the Alzheimer’s Disease and Related Disorders Association (NINCDS-ADRDA) [22]. Then, Mini-Mental Score Examination (MMSE) [23] and Clinical Dementia Rating (CDR) Scale [24] were performed. The tests were completed by two experienced neuropsychiatrists who were blinded to the study design, and the intraclass correlation coefficient (ICC) between the two neuropsychiatrists was 0.91. MMSE is a commonly used cognitive test for screening dementia and measuring cognitive impairment in the elderly [25], and CDR score is a gold-standard informant-based global assessment scale, which is widely used as a severity-ranking scale worldwide [26]. The MMSE score ranged from 0 (worst) to 30 (best), and the CDR score was defined as five domains: 0 (no dementia), 0.5 (very mild dementia), 1 (mild dementia), 2 (moderate dementia), and 3 (severe dementia). All patients (age≥60 years) met the NINCDS-ADRDA criteria and had a CDR score of > 1. HC presented as MMSE higher than 27/30 and CDR 0, without current or past neuropathological and/or psychopathological manifestations. All participants had adequate education to communicate effectively and were able to complete the evaluation of the study. Exclusion criteria included major medical, neuropathological and/or psychopathological diseases other than AD; delirium symptoms; substance abuse or dependence (including alcohol); Hachinski Ischemic Score > 4; history of significant cerebrovascular disease; serious hearing or visual impairment; and inability to follow protocol. Whole blood samples were centrifuged at 1500×g for 15 min, and the obtained serum samples were stored at –80 °C until further analysis.
Measurement of amino acids by HPLC-MS/MS
The serum sample (50μL) was added to MeOH (450μL) and mixed vigorously for 5 min (1500 rpm), followed by centrifugation at 16,000×g for 10 min and drying under nitrogen at 40°C. After reconstitution of the residues with 50μL water, a derivatization reaction with N α-(5-fluoro-2,4-dinitrophenyl)-L-leucinamide (FDLA) (1% in ACN, 50μL) was initiated at 55°C for 40 min, and then terminated by formic acid (5μL). HPLC-MS/MS analysis was performed on an XBridge® C18 column (130 Å, 3.5μm, 2.1 mm×150 mm; Waters, USA) using the UltiMate 3000 HPLC system (Dionex, Sunnyvale, CA, USA) equipped with API 4000 MS/MS system (AB Sciex, Concord, Canada). The mobile phase gradient of solvent A (0.1% formic acid in water) and solvent B (0.1% formic acid in acetonitrile) at a flow rate of 0.2 mL min–1 was programmed as follows: 30% B (0–10 min); 30–60% B (10–34 min); 60% B (34–39 min); 60–30% B (39–40 min); equilibration time 5 min. The identification of D- and L-amino acids was performed by comparing the retention time and changes in peak area before and after the addition of a single enantiomer standard. The enantiomeric quantification was based on the peak area using the calibration curve of standards. The HPLC-MS/MS method passed the rigorous methodological validation as described in a previous study [27].
Statistical analysis
The data were analyzed using SPSS Statistics for Windows, version 26.0 (IBM Corp., Armonk, NY, USA). Descriptive statistics were used to describe the demographic and clinical characteristics of all participants. Continuous variables were reported as means±standard deviation (SD), and the normality of the distribution of continuous variables was analyzed using the Shapiro-Wilk test. Statistical differences in the categorical and continuous variables between the AD and HC groups were determined using the following methods: Chi-squared test for categorical variables; Student’s t-test for demographic and clinical data; analysis of covariance (ANCOVA) for serum amino acids (before or after normal transformation, controlling for age); Pearson’s correlation tests for evaluating the relationships of the concentrations of amino acids with age and MMSE. To further estimate the association between amino acids and AD diagnosis, logistic regression was performed using diagnosis as the dependent variable, age as the explanatory variable with forced entry, and amino acid levels as explanatory variables with forward stepwise selection. The relationships between amino acids and MMSE score in AD patients were assessed by multiple regressions, using MMSE score as dependent variables, age as explanatory variables with forced entry, and amino acid levels as explanatory variables with stepwise selection.
RESULTS
A total of 37 AD patients and 34 HC were enrolled in this study. The demographic and clinical characteristics of all subjects are described in Table 1. There were no significant differences in gender (p = 0.081), body mass index (BMI) (p = 0.303), and family history (p = 0.687) between the AD and HC groups. Compared with HC, AD patients had older age (83.11±6.96 versus 75.79±7.37, p = 0.0001), lower MMSE scores (7.57±6.68 versus. 29.53±0.90, p < 0.00001), and higher CDR scores (2.57±0.60 versus 0.00±0.00). The age of AD group was significantly older than that of HC group. Thus, age was selected as a covariate in the statistical analysis. The serum levels of 18 L-amino acids, 14 D-amino acids, asparagine (Asn), Gly, and GABA in AD patients and HC were successfully measured by HPLC-MS/MS method combined with the pre-column FDLA derivatization. Since D- and L-Asn could not be separated in this system, the combined Asn value was used.
Demographic and clinical characteristics of AD and HC groups
AD, Alzheimer’s disease; HC, healthy controls; BMI, body mass index; CDR, Clinical Dementia Rating; MMSE, Mini-Mental Status Examination. All values are expressed as mean±standard deviation. aStatistical p values derive from the t-test (t). bStatistical p values derive from chi-squared test (χ2). Significant p values are in bold type.
Comparison of amino acid levels between AD patients and HC
Among the 35 amino acids detected, there were significant intergroup differences in 3/35 amino acids between the AD and HC groups (p < 0.05), namely, D-Asp, D-proline (D-Pro), and D-phenylalanine (D-Phe) (Table 2 and Fig. 1). The D-Pro level and D/T-Pro ratio were significantly decreased in AD patients compared with HC (log10-transformed: 448.42±291.35 versus 549.39±279.32 nmol/L, p = 0.024, and 0.22±0.14 versus 0.29±0.17, p = 0.018, respectively), while the L-Pro level remained unchanged (p = 0.953). Similar to D-Pro, the D-Asp (186.03±65.31 versus 242.19±71.75 nmol/L, p = 0.002) and D/T-Asp ratio (log10-transformed: 3.68±1.29 versus 4.28±1.02, p = 0.046) were significantly decreased in AD patients compared to HC. The L-Asp level was also reduced, but statistically not significant (p = 0.062). Different from D-Pro and D-Asp, the D-Phe level was significantly higher in AD patients (58.87±12.38 versus 49.97±7.46 nmol/L, p = 0.038) than in HC group, whereas the L-Phe level and D/T-Phe ratio remained unchanged (p = 0.108 and 0.573, respectively). Considering that the age of AD group was older than that of HC group, a proportion of population with no significant difference in age was selected for post-hoc analysis (Supplementary Table 1). Similar to the above results, the post-hoc analysis revealed significant differences in D-Asp, D-Pro, and D-Phe between AD and HC groups (Supplementary Table 2 and Supplementary Figure 1).
Comparison of the concentrations of amino acids between AD and HC groups
AD, Alzheimer’s disease; HC, healthy controls; Ser, serine; Ala, alanine; Pro, proline; Val, valine; Thr, threonine; Ile, isoleucine; Leu, leucine; Asp, aspartic acid; Glu, glutamic acid; Trp, tryptophan; Met, methionine; His, histidine; Phe, phenylalanine; Arg, arginine; Tyr, tyrosine; Lys, lysine; Cys, cysteine; Gln, glutamine; Asn, asparagine; Gly, glycine; GABA, γ-aminobutyric acid. aValues are expressed as mean±standard deviation. The concentration unit of all L-amino acids, Asn, and Gly is presented as μmol/L, and that of D-amino acids and GABA is presented as nmol/L. bAnalysis of covariance is performed by controlling for age. Significant p values are in bold type.
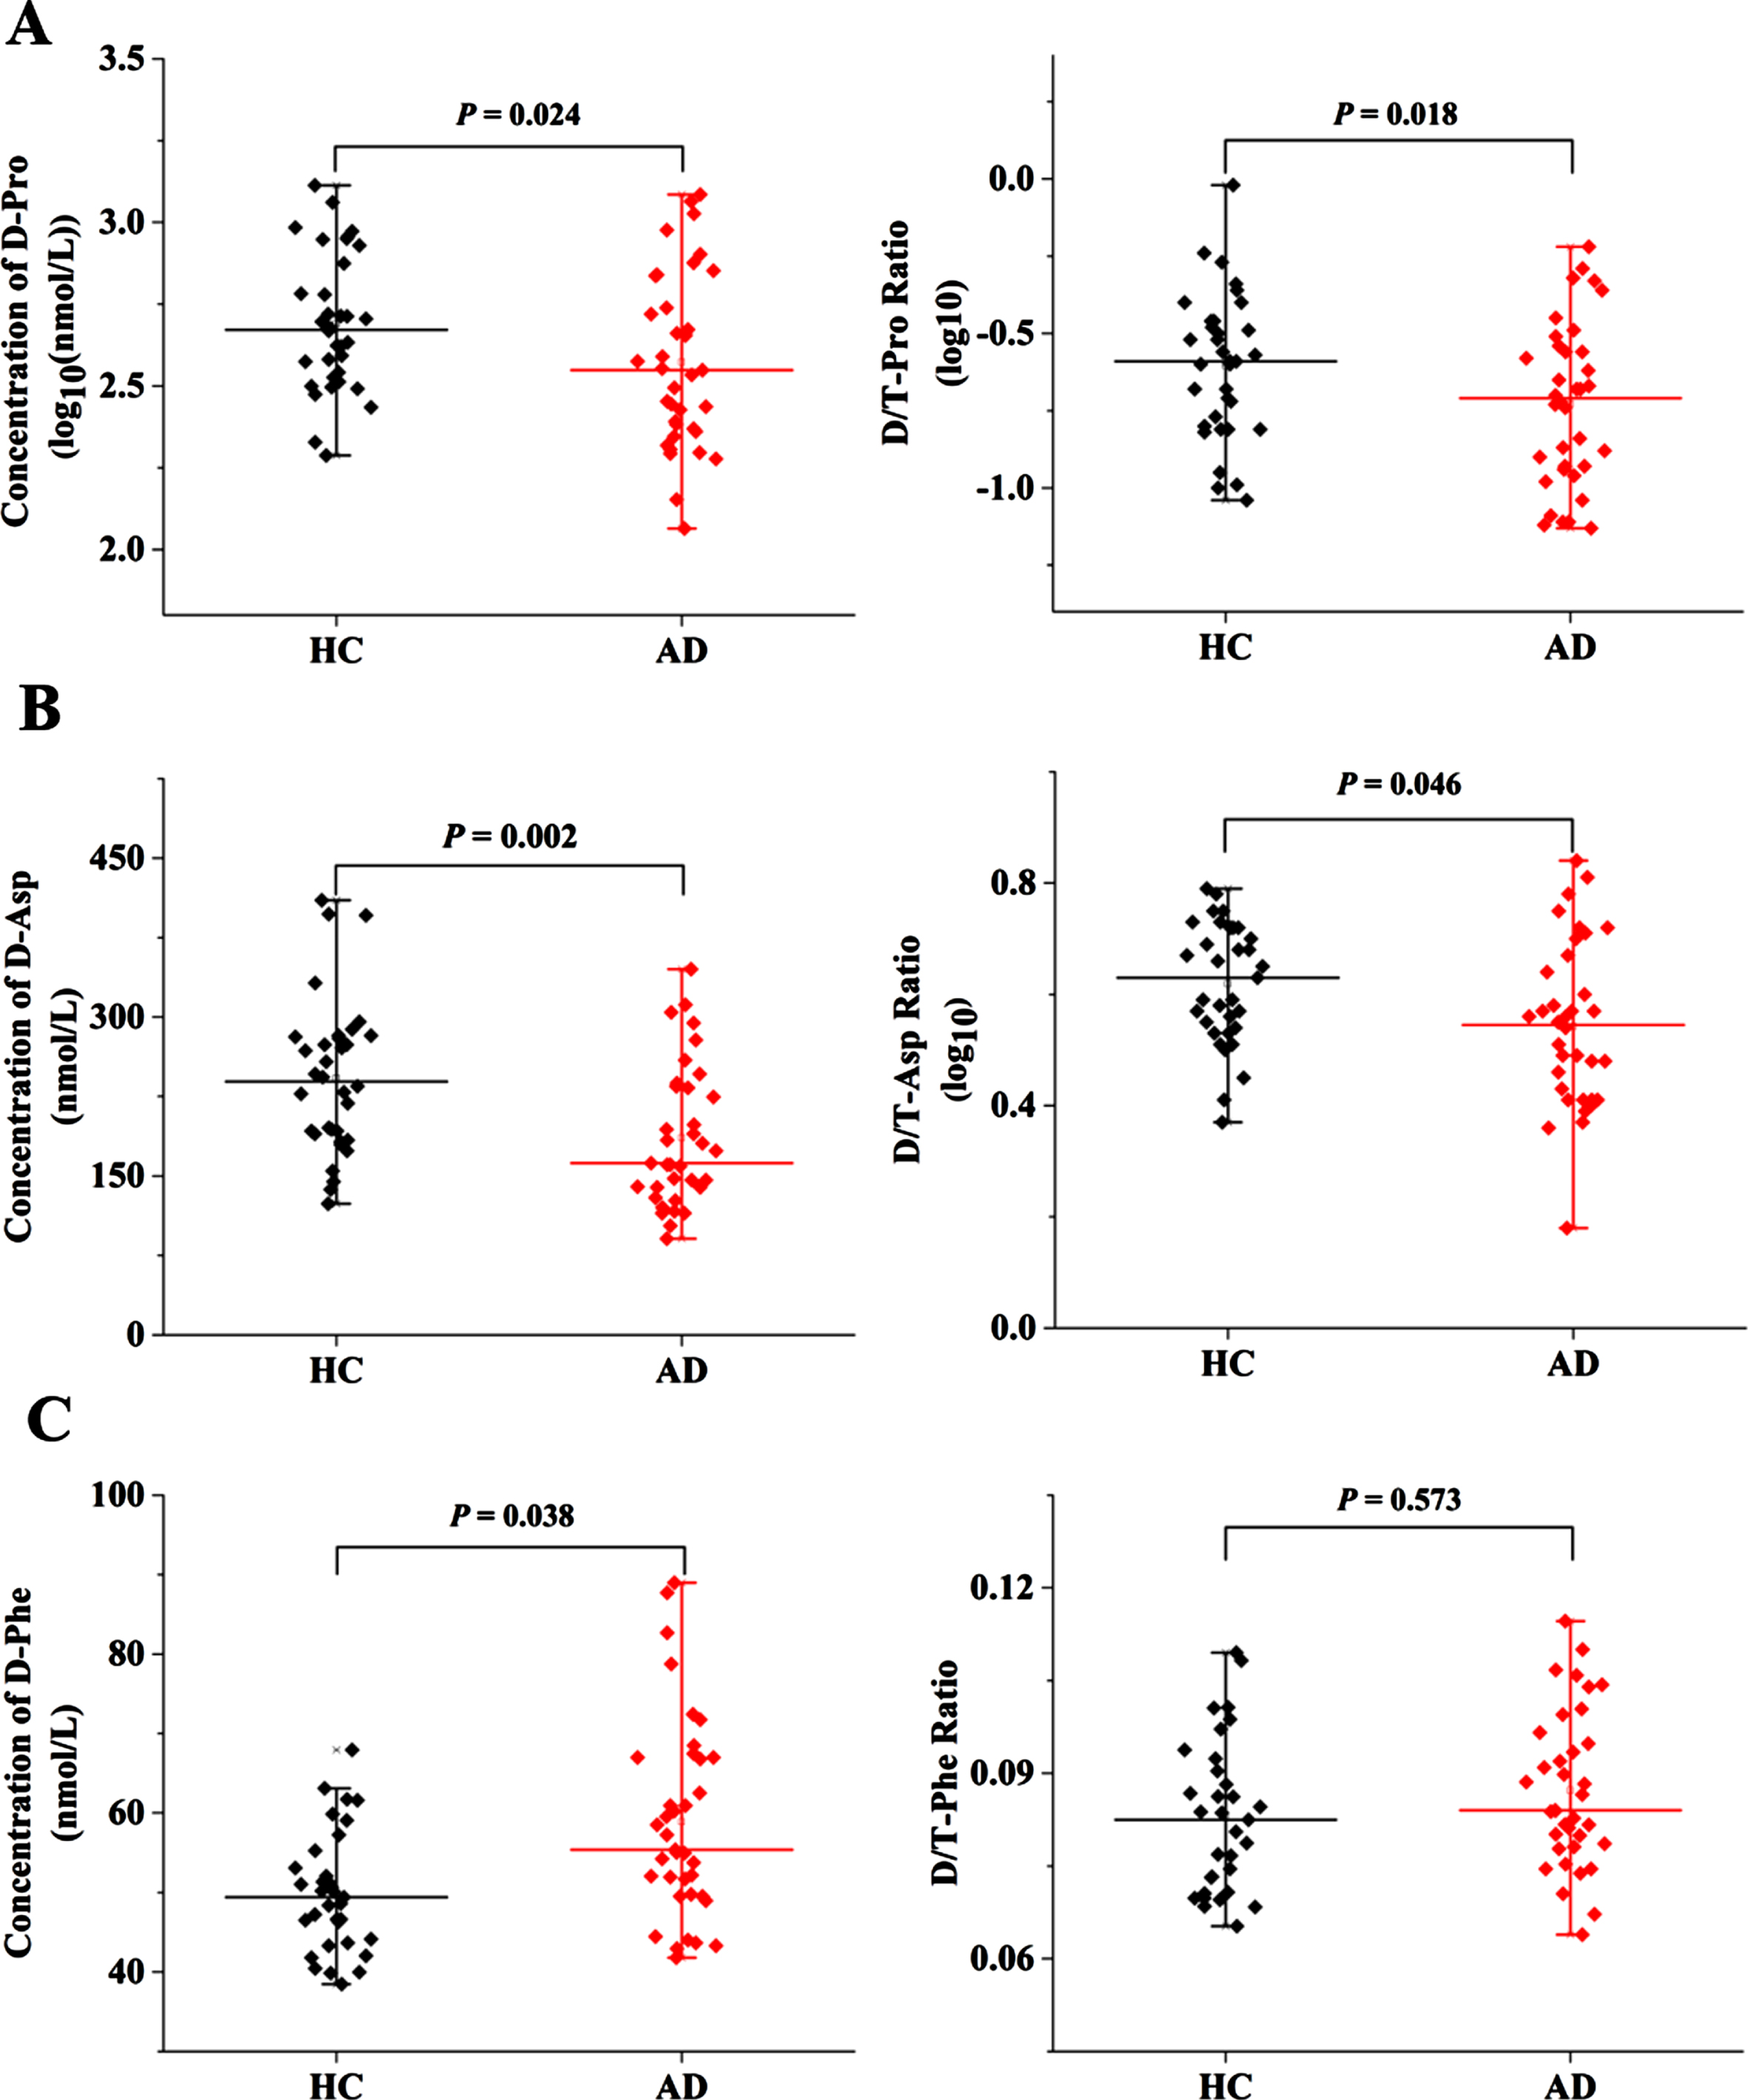
Serum levels of Pro, Asp and Phe enantiomers in AD and HC groups. A) D-Pro level (log10-transformed) and D/T-Pro ratio (log10-transformed). B) D-Asp level and D/T-Asp ratio (log10-transformed). C) D-Phe level and D/T-Phe ratio.
Age-dependent changes in amino acid levels
Age-related variations of the above significantly different amino acids (D-Pro, D-Asp, and D-Phe) were analyzed by Pearson correlation analysis (Fig. 2). The significant age-dependent increases in D-Pro level and D/T-Pro ratio were observed in HC group (log10-transformed: r = 0.516, p = 0.002, and r = 0.365, p = 0.033, respectively), but these correlations were not found in AD patients (r = –0.174, p = 0.299, and r = –0.058, p = 0.745, respectively). The correlation analysis also showed a positive correlation between D-Phe and age in HC group (r = 0.400, p = 0.021), but not in AD patients (r = 0.283, p = 0.089). Unlike D-Pro and D-Phe, the D-Asp level and D/T-Asp ratio did not significantly vary with age in both AD and HC groups.

Age-dependent changes in the serum levels of Pro, Asp and Phe enantiomers in AD and HC groups. Correlation analysis of age with (A) D-Pro level (log10-transformed) and D/T-Pro ratio (log10-transformed), (B) D-Asp level and D/T-Asp ratio (log10-transformed), and (C) D-Phe level and D/T-Phe ratio in the serum samples of HC (black) and AD (red).
Diagnostic ability of amino acid levels in AD
A forward stepwise logistic regression analysis was performed to determine the significant variables for AD diagnosis by using D-Pro, D-Asp, D-Phe, D/T-Pro ratio, D/T-Asp ratio, and age as independent variables. The Nagelkerke’s R2 = 0.599 and the model’s coefficient were significant in the omnibus goodness-of-fit test (χ2 = 39.887, df = 4, p < 0.00001). The results showed that D-Pro (log10-transformed: p = 0.004), D-Asp (p = 0.083), D-Phe (p = 0.008), and age (p = 0.019) remained in the forward stepwise method, and were significantly associated with AD diagnosis as explanatory variables in the logistic regression model (Supplementary Table 3).
Based on the above results, a receiver operator characteristic (ROC) curve analysis was performed to assess the ability of variables, including amino acids levels (D-Pro (log10), D-Asp and D-Phe) and age, to discriminate AD patients from HC. The ROC analysis for AD patients versus HC revealed that the optimal cut-off values of D-Pro (log10), D-Asp, D-Phe level, and age were –0.358, 167.90, 51.53, and 77.50, with sensitivity of 0.912, 0.882, 0.730, and 0.784, specificity of 0.432, 0.514, 0.697, and 0.706, and Area Under Curve (AUC) of 0.644, 0.723, 0.726, and 0.871, respectively. The combined use of D-Pro, D-Asp, D-Phe level, and age further improved the AUC (0.871), specificity (0.970), and sensitivity (0.838) of AD diagnosis (Supplementary Table 4) [21, 28]. The ROC curves for D-Pro, D-Asp, D-Phe, age, and their combination are shown in Fig. 3.
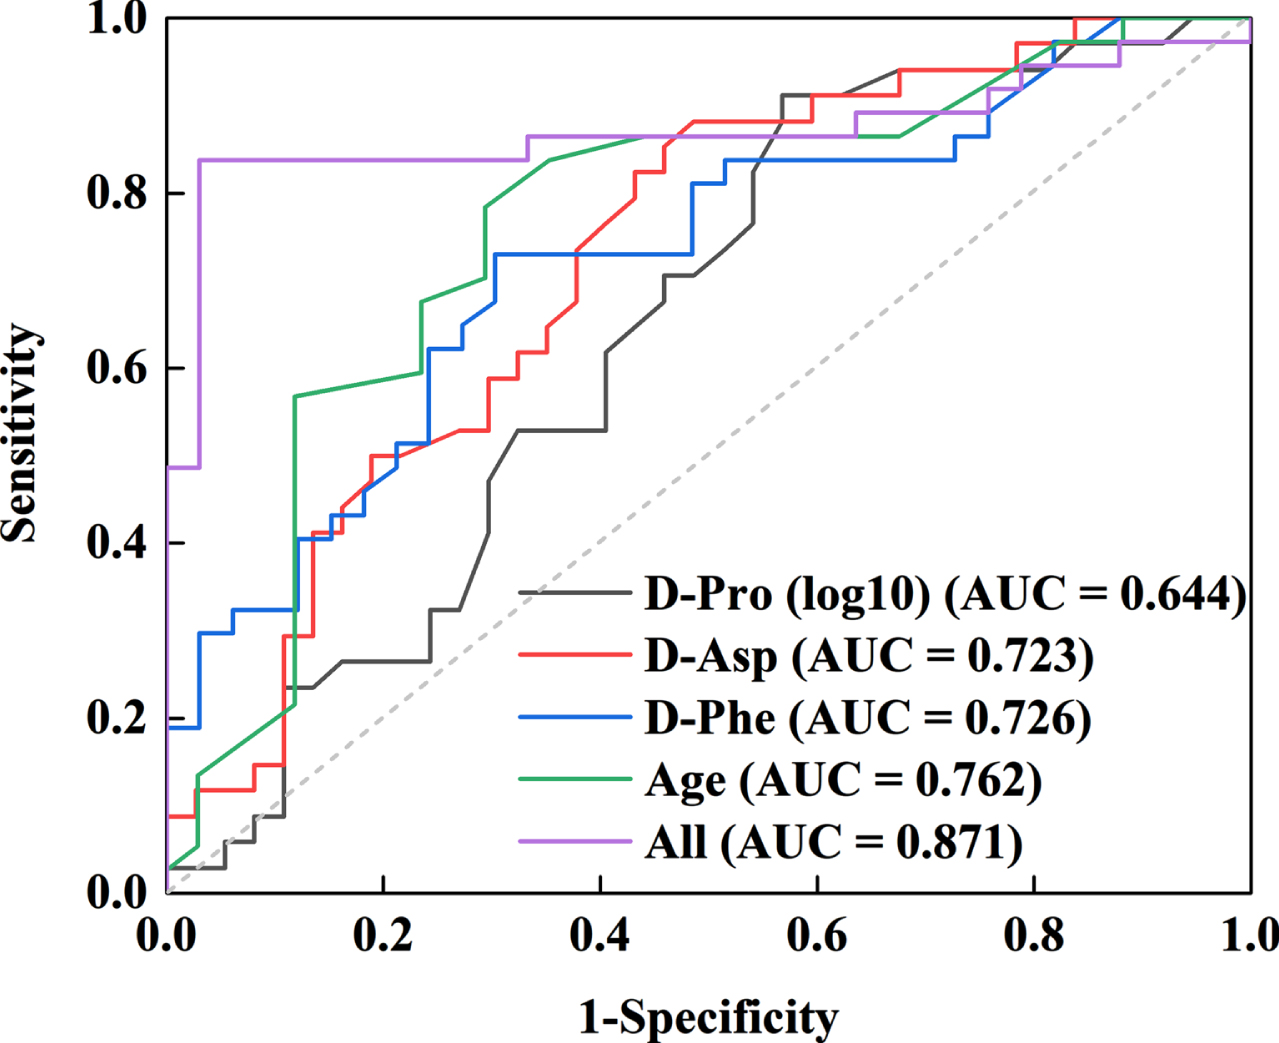
Receiver operating characteristic curve for discriminating AD from HC using D-Pro (log10-transformed), D-Asp, D-Phe, and age as the diagnostic parameters.
Relationships between AD symptom scores and D-Asp level
To assess the relationship between amino acid levels and MMSE scores, multiple linear regression analysis was conducted in this study. MMSE score was set as a dependent variable, while D-Pro, D-Asp, D-Phe, D/T-Pro ratio, D/T-Asp ratio, and age were set as explanatory variables in stepwise selection. Notably, the serum level of D-Asp was a significant explanatory variable (p = 0.001), while the other dependent variables remained not significant (Supplementary Table 5). As shown in Fig. 4A, D-Asp level was positively associated with MMSE scores (r = 0.541, p = 0.001).
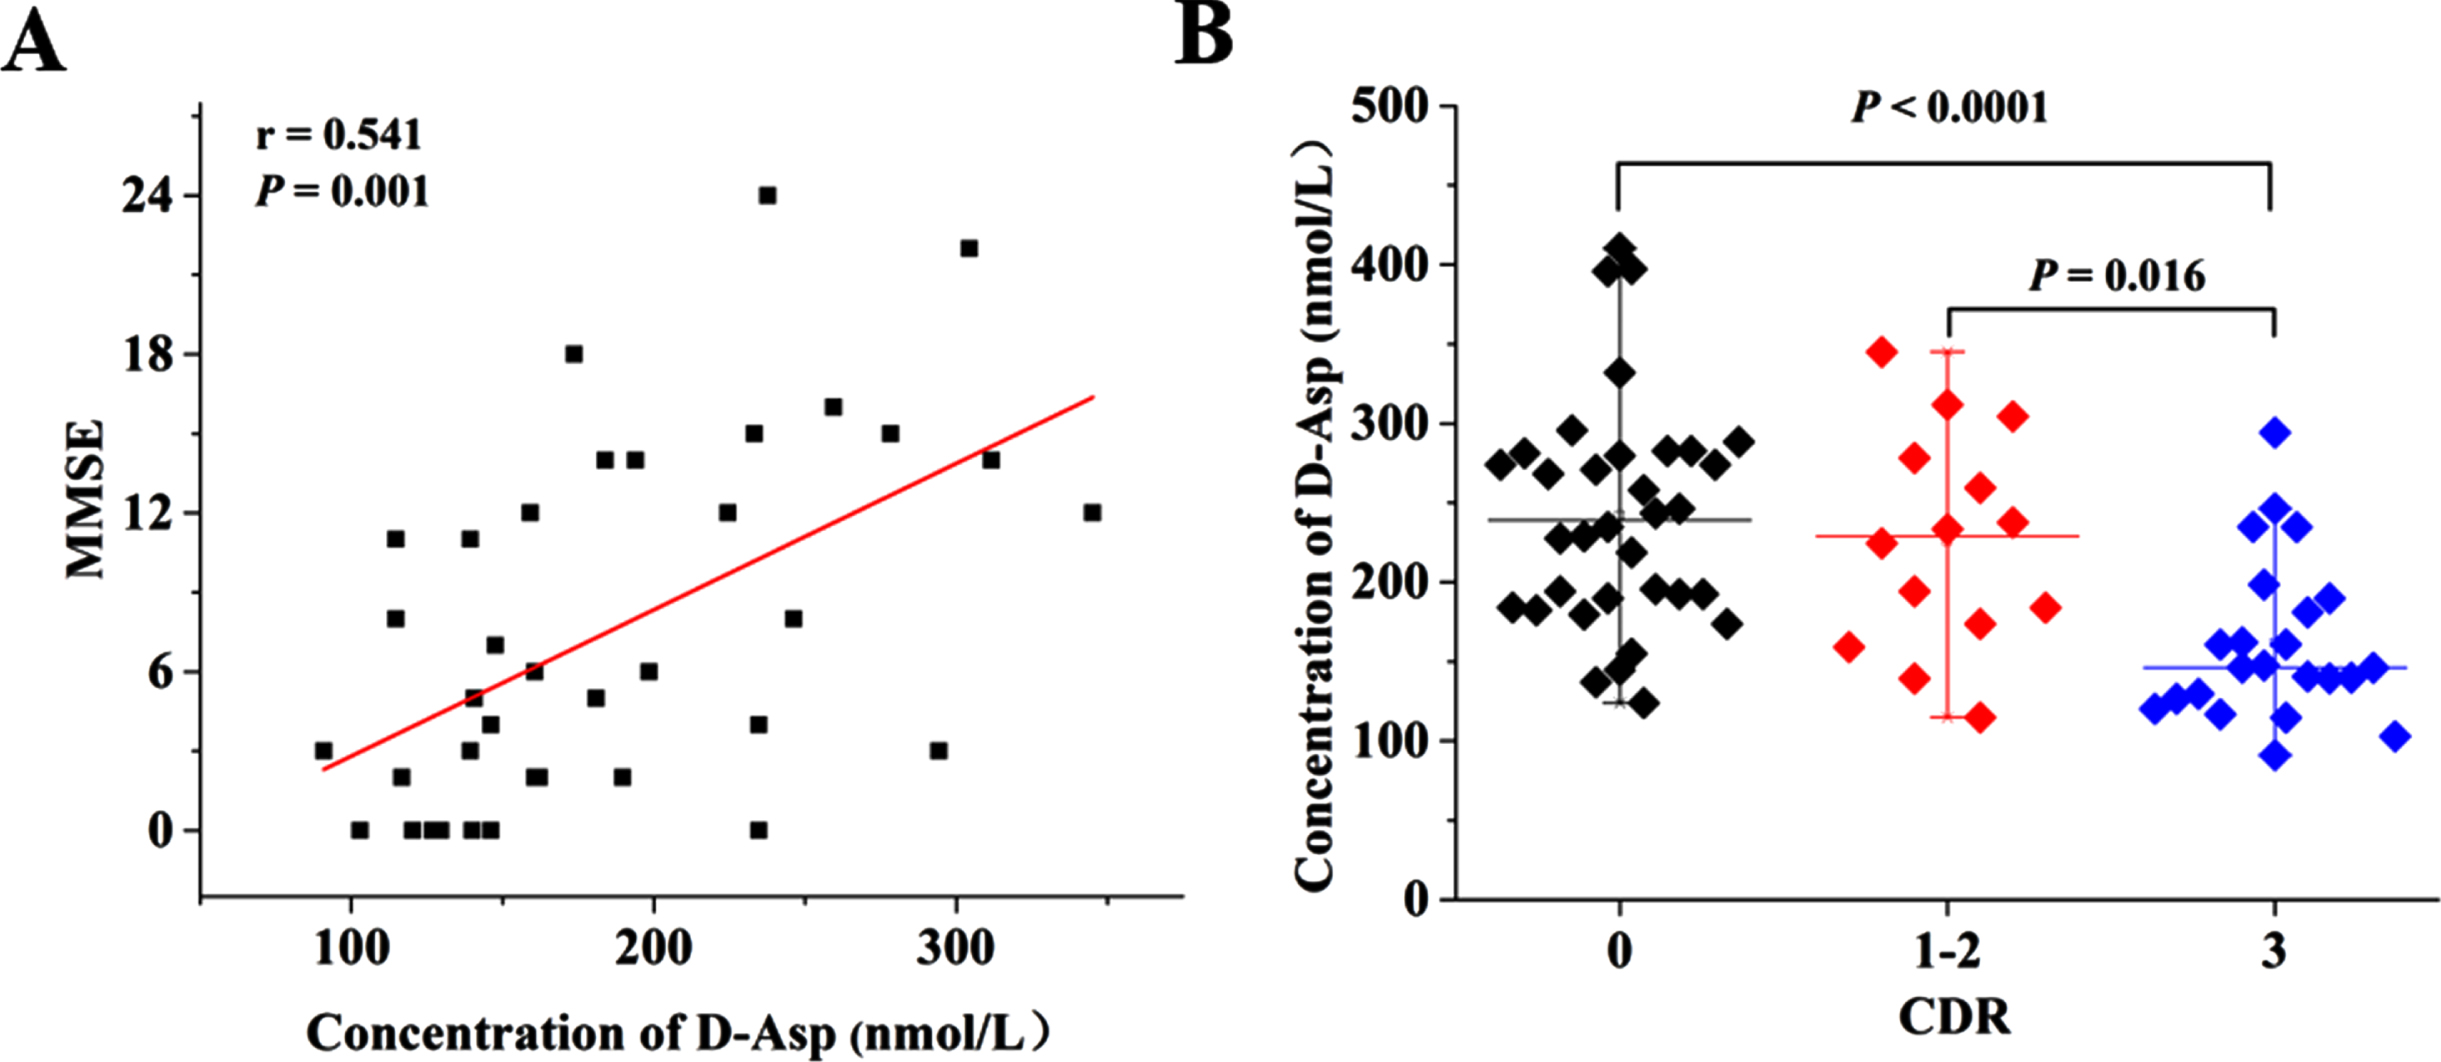
Variations of D-Asp levels in HC and AD patients at different stages of the disease. A) Correlation analysis between D-Asp level and MMSE score in AD patients. B) The serum level of D-Asp in subjects stratified by CDR 0 (n = 34), 1-2 (total, n = 14; CDR1, n = 2; CDR2, n = 12) and 3 (n = 23). CDR, Clinical Dementia Rating; MMSE, Mini-Mental State Examination.
Furthermore, the correlation between D-Asp level and dementia was investigated by dividing subjects into groups stratified by CDR scores. Since CDR1 had only two samples in this study, we combined 1 and 2 as CDR 1-2 for subsequent analysis. As shown in Fig. 4B, the reduced level of D-Asp was significantly correlated with higher severity of AD. Notably, significant differences were found between CDR 0 (n = 34) and CDR 3 (n = 23) (p < 0.0001), as well as CDR 1-2 (n = 14) and CDR 3 (p = 0.016) in AD patients.
DISCUSSION
The main findings of this study are as follows: 1) Statistical evaluation of the results revealed a significant difference (p < 0.05) in the concentrations of 3/35 amino acids between the AD and HC groups (Table 2 and Fig. 1). The serum D-Asp and D-Pro levels were significantly decreased, while the D-Phe level was significantly increased in AD group compared to HC group. 2) D-Pro, D/T-Pro ratio, and D-Phe showed significant age-dependent increases in HC, but this trend disappeared in AD (Fig. 2). 3) The ROC curve analysis indicated that the integrative value of D-Pro, D-Asp, D-Phe, and age had a satisfactory ability to discriminate AD patients from HC with the AUC, specificity and sensitivity of 0.871, 0.970, and 0.838, respectively (Fig. 3). 4) There was an association between D-Asp level and AD progression, as assessed by the MMSE and CDR scales (Fig. 4).
Recently, D-Asp has been extensively investigated for its role in the central nervous system [29]. A large amount of evidence demonstrated that D-Asp can stimulate metabotropic glutamate receptor 5 (mGlu5) [30], presynaptic α-amino-3-hydroxy-5-methylisoxazole-4-propionic acid hydrate (AMPA) [31], and most importantly postsynaptic NMDAR by binding to the glutamate site of GluN2 subunits [32]. Studies conducted in mouse models with persistent deregulation of D-Asp level showed that D-Asp could affect NMDAR-dependent processes such as synaptic plasticity, transmission, as well as cognitive functions [33], and induced changes in tau phosphorylation [34], normalized Aβ protein expression [35] and produced early oxidative stress and cell death [36]. Specifically, the D-Asp content in tissues and/or biological fluids was related to AD. Piubell and collaborators reported the serum D-Asp level and D/T-Asp ratio were slightly decreased in AD patients, although the trend did not reach statistical significance [18]. Our findings were partially consistent with the above-mentioned study, in which the serum D-Asp level and D/T-Asp ratio were decreased in AD patients compared with HC, and the variations were statistically significant. Since exogenous D-Asp can effectively pass through the blood-brain barrier [37], future studies should evaluate the contribution of peripheral D-Asp to the abnormal brain function of AD. Another important result is the obvious correlation of D-Asp with AD progression, as assessed by the MMSE and CDR scales. A positive association was found between serum D-Asp level and MMSE score, and a decreasing trend of serum D-Asp from CDR 0 (HC) to CDR 3 (severe dementia) was apparent. Significant declines were observed for D-Asp levels between CDR 0 and CDR 3 AD patients, as well as CDR 1-2 (moderate dementia) and CDR 3 AD patients. A moderately decreasing trend from CDR 0 (n = 26) to CDR 2 (n = 17) AD patients was also observed for the D/T-Asp ratio by Piubelli’s group, although the difference was not statistically significant [18, 34]. Taken together, the significant correlation between decreased serum D-Asp concentration and worse MMSE and CDR scores implies that D-Asp level can serve as a powerful diagnostic tool in conjunction with the assessment of cognitive decline.
The results of this study also showed that serum D-Pro level and D/T-Pro ratio were significantly decreased in AD patients compared with HC. However, Kimura and colleagues demonstrated higher D-Pro level and D/T-Pro ratio in the serum of MCI and dementia groups [28]. Nevertheless, this study has some limitations. Only female individuals were enrolled in this study, the number of dementia group was relatively small (n = 6), and MMSE score was used to assess cognitive function. Interestingly, the lower D-Pro level observed in our study was in line with the results of animal studies conducted by Xing and colleagues, in which the concentrations of D-Pro were significantly decreased in the plasma, hippocampus, and cerebral cortex of AD rats compared with those in normal controls [38, 39]. Regarding the reason for the decrease in D-Pro, recent studies indicated that D-Pro was the substrate of D-amino acid oxidase, which could be derived from the interconversion of L-Pro by proline racemases in addition to dietary origin [40, 41]. Thus, it can be inferred that the amount of D-Pro changes with the dysfunction of catalytic enzymes, which serves as a target for regulating the level of D-Pro [38]. Similar to D-Asp, D-Pro can also readily pass through the blood-brain barrier [42] and the correlation between peripheral D-Pro level and Aβ aggregation is worthy of attention.
To the best of our knowledge, there is no previous study regarding the difference in serum D-Phe levels between AD and HC groups. Dissimilar from the decreasing trend of D-Asp and D-Pro, serum D-Phe level was increased significantly in AD patients compared to HC. This change was confirmed in animal studies, where D-Phe level showed a dramatic increase in the plasma of AD rats compared with normal controls [38]. The work reported by Gao and co-workers is instructive for exploring the role of D-Phe in AD. They found that the D-Phe-modified surface could facilitate the co-aggregation of Aβ with insulin into integrated β-sheet-rich fibrils and cross-fibrils. Insulin can protect against the oxidative stress triggered by Aβ oligomers, but the cross-fibrillation of Aβ and insulin on the chiral surface of D-Phe made it lose bioactivity and showed pronounced cellular toxicity [43]. This report demonstrated the adverse effect of D-Phe, which was consistent with the increased D-Phe content in the serum of AD patients in our study.
D-Ser, a preferred co-agonist of NMDAR, has been postulated as a novel molecular biomarker for AD [18, 44]. Indeed, our results showed that the serum concentration of D-Ser in AD patients was slightly higher than that in HC, but the difference was not statistically significant. Consistent with the studies of Parnetti [17] and Verbeek [45], we could not reproduce the previous findings of D-Ser as a biomarker for AD, and further studies are needed to clarify the relationship between serum D-Ser level and AD.
As previous studies demonstrated that the levels of amino acids changed with age [46, 47], we subsequently determined whether the levels of different chiral amino acids and their proportions varied with age. It was found that D-Pro, D-Phe, D-Asp, and their ratios in HC group increased in an age-dependent manner, among which D-Pro, D/T-Pro ratio, and D-Phe changed significantly, while these trends were not significant or even opposite in AD group. The age-related correlations of D-Pro, D-Phe, and D-Asp in our findings were in line with the results of Pro, Phe, and Asp obtained by Yokogoshi et al. among healthy individuals [46]. As described in recent reviews by Fujii and Rensen [48, 49], the non-enzymatic or spontaneous racemization of L-amino acids into D-amino acids appeared to be associated with aging. This age-related spontaneous racemization is thought to be the result of ultraviolet beta radiation and oxidative stress. For example, the increased rate of D-Asp in elderly has been suggested to be particularly relevant to the spontaneous racemization of L-Asp to D-Asp at older ages. Therefore, the levels of D-Pro, D-Phe, and D-Asp were found to increase with age in our study. Besides, the degradation of D-amino acids was related to D-amino acid oxidase (DAO). In mammals, DAO could convert D-amino acids into their corresponding amino acids and flavin adenine dinucleotide [49]. Several studies have shown that the blood levels of DAO increase with the severity of cognitive deficits, and patients with severe AD have higher DAO levels than HC, MCI, and mild AD [19, 50]. These findings can partly explain the non-significant correlation between age and specific D-amino acids in the serum of AD patients. In summary, the differences in age-dependent amino acid levels between HC and AD groups indicate that amino acid metabolism disorders caused by catalytic enzymes can occur in AD patients.
Several limitations should be noted in this study. First, the AD group was significantly older than the HC group, although age was considered as a covariate in the statistical analysis. Second, the sample size of each group was small, especially the AD group with CDR1. Hence, the diagnostic value and predictive effect of specific D-amino acids need to be validated in further studies with a larger cohort.
Taken altogether, this is a pilot study that shows the reduced serum levels of D-Asp and D-Pro as well as the elevated level of D-Phe in AD patients. Hence, the combination of D-Asp, D-Pro, D-Phe and age can serve as a diagnostic indicator for AD, while the D-Asp level as a measure to evaluate the severity of AD.
Footnotes
ACKNOWLEDGMENTS
The authors have no acknowledgments to report.
FUNDING
This work was supported by the National Natural Science Foundation of China (No. 82171525), Hygiene and Health Development Scientific Re-search Fostering Plan of Haidian District Beijing (No. 2022-03-505001), and R&D Program of Beijing Municipal Education Commission (KM202310025007).
CONFLICT OF INTEREST
The authors have declared no conflict of interest.