
Abstract
Background:
Assessments of Alzheimer’s disease pathology do not routinely include lower brainstem, olfactory bulb, and spinal cord.
Objective:
Test if amyloid-β (Aβ) and paired helical filament (PHF) tau-tangles outside the cerebrum are associated with the odds of dementia.
Methods:
Autopsies were obtained in decedents with cognitive testing (n = 300). Aβ plaques and PHF tau-tangles were assessed in 24 sites: cerebrum (n = 14), brainstem (n = 5), olfactory bulb, and four spinal cord levels. Since spinal Aβ were absent in the first 165 cases, it was not assessed in the remaining cases.
Results:
Age at death was 91 years old. About 90% had Aβ in cerebrum and of these, half had Aβ in the brainstem. Of the latter, 85% showed Aβ in the olfactory bulb. All but one participant had tau-tangles in the cerebrum and 86% had brainstem tau-tangles. Of the latter, 80% had tau-tangles in olfactory bulb and 36% tau-tangles in one or more spinal cord levels. About 90% of adults with tau-tangles also had Aβ in one or more regions. In a logistic model controlling for demographics, Aβ and tau-tangles within the cerebrum, the presence of Aβ in olfactory bulb [OR, 1.74(1.00, 3.05)]; tau-tangles in brainstem [OR, 4.00(1.1.57,10.21)]; and spinal cord [OR, 1.87 (1.21,3.11)] were independently associated with higher odds of dementia.
Conclusion:
Regional differences in Aβ and tau-tangle accumulation extend beyond cerebrum to spinal cord and their presence outside the cerebrum are associated with a higher odds of dementia. Further studies are needed to clarify the extent, burden, and consequences of AD pathology outside of cerebrum.
INTRODUCTION
Alzheimer’s disease (AD) is a chronic disorder whose underlying pathology includes extracellular deposition of amyloid-β (Aβ) and hyperphosphorylated paired helical filament (PHF) tau-tangles, the structural constituents of neurofibrillary tangles (NFTs) that may accumulate in neurons and its processes (neurites) years before impaired cognition manifests [1, 2]. Regional differences in the accumulation of AD pathology within central nervous system (CNS) tissues may inform on the heterogeneity of AD. For example, there has been increasing recognition that AD adversely affects not only cognition, but also many non-cognitive phenotypes as well as other clinical syndromes related to tauopathies [3 –6].
Antemortem brain imaging and postmortem collection of AD pathology employed for conventional staging of pathologic AD have focused on cerebrum and upper brainstem structures [7 –14]. Accumulating evidence over the past decade has suggested that brainstem tau-tangles may accumulate at the earliest stages of AD [15 –20]. Nonetheless, few studies have examined regional differences of Aβ and tau-tangles or reported their clinical consequences in tissues outside the cerebrum including more caudal brainstem, olfactory bulb or spinal cord [21].
Both the location and burden of AD pathology may contribute to its varied clinical consequences. Yet, given the paucity of prior data, a systematic survey of preselected sites sampling different levels of the neuroaxis outside the cerebrum can be justified to demonstrate that Aβ and tau-tangles accumulate outside the cerebrum. These data are crucial for justifying the need for further more time-consuming studies to assess the full extent and burden of AD pathology that accumulates outside the cerebrum [23, 24].
We studied 300 older adults who enrolled without known dementia and were followed with annual cognitive testing until death. A structured autopsy was performed to collect postmortem indices of Aβ and tau-tangles from conventional AD staging sites in the cerebrum and to assess their presence in preselected sites in brainstem, olfactory bulb, and spinal cord from the same individuals. We report the regional distributions of AD pathology within and outside the cerebrum. Then we tested the hypothesis that AD pathology outside the cerebrum is associated with a higher odds of AD dementia proximate to death when adjusting for AD pathology within the cerebrum.
METHODS
Participants
Older adults were participants in the Rush Memory and Aging Project (MAP), an ongoing community-based cohort studies with autopsy at the time of death [22]. MAP started in 1997, and participants are older persons from continuous care retirement communities, subsidized housing facilities and local churches throughout northeastern Illinois.
The study was approved by the Institutional Review Board of Rush University Medical Center. Written informed consent was obtained from all study participants as was an Anatomical Gift Act for organ donation. Participants enrolled without known dementia, and all agreed to annual evaluations and autopsy after death that includes brain, spinal cord and select muscles and nerve. The follow-up rate was about 90% among the survivors and the autopsy rate among decedents exceeded 80%.
There were 364 decedents who had Aβ assessments in brain, brainstem and olfactory bulb. In the first 165 individuals, we examined four levels of the spinal cord (Table 1). While about 5% of 364 showed amyloid angiopathy in spinal meningeal vessels we found no evidence of spinal cord Aβ (see below) [23]. There were 313 who had completed tau-tangles data collection in brain, brainstem, olfactory bulb, and spinal cord. Data from 300 of 364 decedents with both complete Aβ and tau-tangle data in all regions was used for further analyses in this study.
Clinical and postmortem characteristics of the analytic cohort
^ t-test or Chi-square significance <0.001; **median, interquartile range (IQR); #Aβ and tau-tangles indices collected from 8 sites within the cerebrum as described in the methods.
Brain autopsy
At autopsy, the brain was removed and weighed, and the brainstem and cerebellum were separated from the cerebrum by a transverse cut across the midbrain above the superior colliculus. The cerebral hemispheres were separated by a cut along the longitudinal fissure. And one hemisphere was cut into 1 cm coronal slabs on a plexiglass jig. One cerebral hemisphere, the brainstem, spinal cord segments obtained from each level and one olfactory bulb were placed in 4% paraformaldehyde for 72 h. All blocks obtained were processed using routine techniques, embedded in paraffin, and sectioned at 6μm thickness for diagnostic purposes and for histochemistry and at 20μm thickness for tau immunohistochemistry.
Assessment of AD pathology
A modified Bielschowsky silver stain was used to visualize neuritic plaques, diffuse plaques, and NFTs in five cortical areas (hippocampus, entorhinal, midfrontal, middle temporal, and inferior parietal). Neuritic and diffuse plaques and NFTs were counted in the region that appeared to have the highest density of each pathology as previously described [24]. A standardized score was created for each neuropathology in each region by dividing the raw count by the standard deviation of that same neuropathology in that region. This standardization procedure puts the pathologic indices on a relatively common scale [24]. The NIA-AA National Institute criteria were used, with intermediate and high likelihood cases indicating a pathologic diagnosis of AD [25].
Aβ plaques were quantified using immunohistochemistry and image analysis. Specifically, Aβ was labeled using 1 of 3 monoclonal antibodies: 4G8 (Covance Labs, Madison, WI; 1:9000 dilution), 6F/3D (Dako North America Inc., Carpinteria, CA; 1:50 dilution), and 10D5 (Elan Pharmaceuticals, San Francisco, CA; 1:600 dilution). Following an automated multistage image analysis, percent area positive for Aβ was computed [26].
Mean Aβ score was calculated based on eight regions including hippocampus, entorhinal cortex, midfrontal, inferior temporal, angular gyrus, calcarine cortex, anterior cingulate, and superior frontal cortex.
PHF tau-tangles (tau-tangles) was labeled with an antibody specific for phosphorylated tau (AT8; Thermo Fisher Scientific, Rockford, IL, USA; 1:2000 dilution). Quantification was accomplished via the stereological mapping station.
Tau-tangles per mm2 were computed in each of eight regions including hippocampus, entorhinal cortex, midfrontal, inferior temporal, angular gyrus, calcarine cortex, anterior cingulate, and superior frontal cortex and a mean tangle score was calculated.
Sites examined for Aβ and tau-tangles
As illustrated in Fig. 1, the presence or absence of Aβ and tau-tangles based on immunohistochemistry (described above) were quantified in 24 sites including
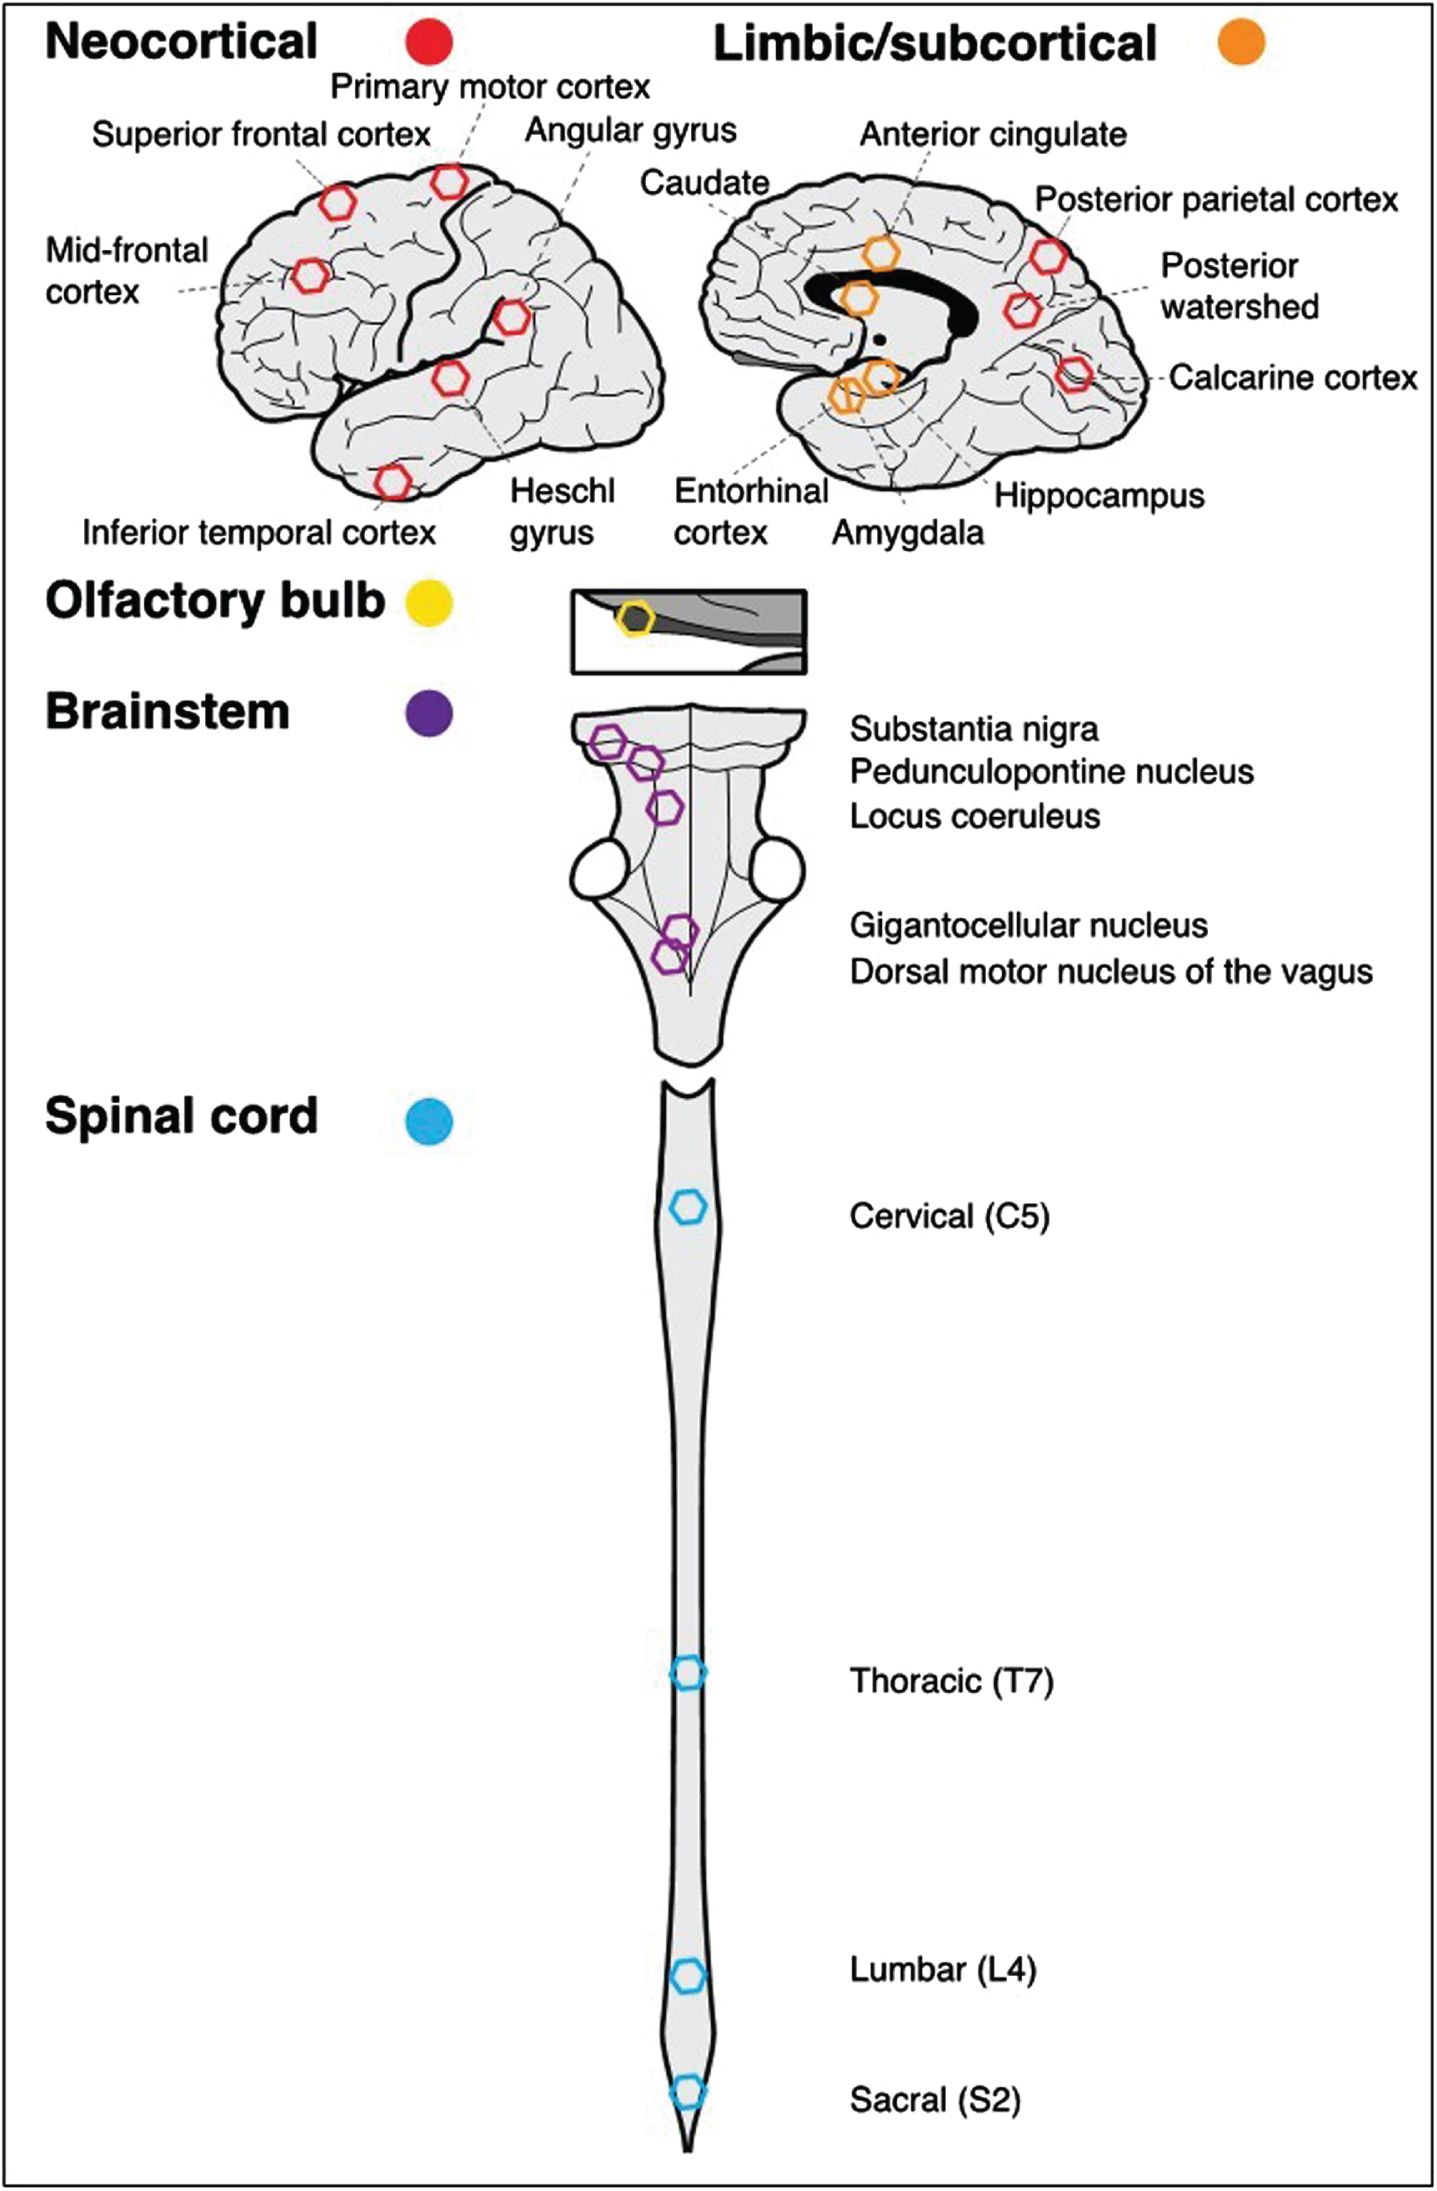
CNS sites and regions assessed for the presence of Aβ and tau-tangles within and outside the cerebrum. Analyses detailed in the methods grouped the 24 sites from which Aβ and tau-tangles were assessed into five regions. The schematic figure below shows the approximate location of each of these sites within each of the regions projected into two dimensions. The five regions were: Neocortical (n = 9, red hexagons); Limbic/subcortical (n = 5, orange hexagons); Olfactory bulb (n = 1, yellow hexagon); Brainstem (n = 5, purple hexagons) and Spinal cord (n = 4, blue hexagons).
Spinal Aβ was not observed (exact 95% upper confidence limit: 1.8%) in the first 165 cases, which implies that the 95% upper confidence for the proportion with Aβ in the spinal cord is 1.8%. Given the rarity of spinal Aβ, we did not continue to collect Aβ in the remaining 135 spinal cords.
Summarizing Aβ and tau-tangles data
The goal of this study was to assess the presence of AD pathology in preselected sites in different levels of the neuroaxis outside the cerebrum. Then we analyzed if the presence of AD pathology in these sites increase the odds of dementia. To demonstrate the latter, it is crucial to adjust models for AD pathology within the cerebrum. Therefore, we assessed the presence of AD pathology in sites within (n = 14) and outside (n = 10) the cerebrum.
Given our goal, we reasoned that based on the known functional differences between the varied CNS regions we planned to examine (Fig. 1) that we might be able to reduce the 24 sites to a smaller number of regions that would be easier to analyze. We sought to obtain empiric support for our groupings by using principal component analyses, using all available data.
We used MPLUS (version 8.7) for an exploratory principal component analysis, where factors were estimated based on a correlation matrix using diagonally weighted least squares method, goemin an oblique rotation and probit as the link function for binary variables [27, 28].
Factor analyses were performed separately for Aβ and tau-tangles [27]. The first 5 eigenvalues of the correlation matrix for tau-tangles were greater than 1.0 (14.3, 2.7, 2.0, 1.32, and 1.12 and accounted for 89% of the total variance. These analyses showed that the measurements for demonstrated patterns of correlation corresponded to five factors of variation for tau-tangles. Figure 1 shows the sites within the five regions from which tau-tangles were collected: 1) neocortical (9 sites), 2) limbic/subcortical (5 sites), 3) brainstem (5 sites), 4) olfactory bulb, and 5) spinal cord (4 sites). The RMSEA was 0.032, a value well within the conventional acceptable range (RMSEA <0.08). Each factor gave large positive and similar weights to a set of sites in a specific region and low weights to the other four regions. That is, we could use binary summaries of tau-tangles for each of its regions. The leading eigenvalue of the correlation matrix for the 20 Aβ site measures was 15.7; the corresponding RMSEA is 0.054, also in the range suggesting good fit and accounted for 77.9% of total variance. We observed a single dominant Aβ factor with similar weights for all twenty sites for all four regions. So, we constructed a single overall Aβ measure for all 20 sites with Aβ.
To summarize and contrast the distribution of tau-tangles with Aβ we computed binary positivity (presence at any site in each of the five regions) and the fraction of the sites showing AD pathology within each region. For Aβ we constructed four measures excluding spinal cord, where no Aβ was observed. The percentages of cases with Aβ and tau-tangles positivity in each region are included in Supplementary Table 1. The inter-correlation of the regional factors of Aβ and tau-tangles positivity is shown in Fig. 2.

Associations of different CNS regions summarizing tau-tangles and Aβ positivity in different tissues within and outside the brain. Heatmap showing the correlation of the tau-tangles and Aβ regions summarizing the percentage of sites (Table 1) within each of the regions that showed tangle and Aβ positivity. Regional Aβ positivity was strongly related (black box, bottom left). Regional tau-tangle positivity was strongly related in brain and brainstem but weaker compared to the olfactory bulb and spinal cord (blue box).
Conventional staging of AD pathology
Cognitive testing and diagnosis of dementia
Trained technicians administered 21 cognitive tests as described previously from which we computed a composite measure of global cognition [29]. Cognitive diagnoses were made in a three-step process. Cognitive testing was scored by a computer program and the results were reviewed by a neuropsychologist to diagnose cognitive impairment. Then participants were evaluated by a physician who used available cognitive and clinical data to classify cognitive status at each visit. Individuals with cognitive impairment who did not meet dementia criteria were diagnosed with mild cognitive impairment (MCI). Individuals without dementia or MCI were classified as having no cognitive impairment (NCI) [30 –32]. At the time of death, select clinical data from the entire study were reviewed by a neurologist, blinded to postmortem data, who rendered a final cognitive status diagnosis [22].
Other covariates
Demographics: Age, sex, and education were based on self-report at study entry. APOE genotyping: The presence of the ɛ4 allele of APOE gene was based on sequencing rs429358 (codon 112) and rs7412 (codon 158) at exon 4 of the APOE gene, as described previously [33]. Other clinical covariates: The presence of self-reported history of head injury and the sum of chronic health conditions including head injury with loss of consciousness, hypertension, diabetes, heart disease, cancer, thyroid disease, and stroke were used as covariates in these analyses.
Statistical methods
We used Spearman correlation to examine the associations of regional frequencies of Aβ and tau-tangles in the defined regions. To compare frequencies of tau-tangles in the spinal cord, we compared adjacent levels with McNemar’s tests.
Annual cognitive testing was performed prospectively from study entry till the time of death. A final cognitive status diagnosis was based on review of all the cognitive data collected during the study. For the current analyses our primary clinical outcome measure was the final cognitive status diagnosis of dementia (Yes Dementia). Adults with NCI and MCI were included in the No Dementia group. The neuropathology data were obtained from consecutive decedents at the time of death.
To determine if Aβ and tau-tangles that accumulate in tissues outside the cerebrum have a separate effect on the odds of dementia, it was necessary to adjust for Aβ and tau-tangles that was collected in the cerebrum (Fig. 1). Aβ and tau-tangles accumulated in many regions and could have separate and joint negative effects on odds of dementia. So, our analyses proceeded in three stages to examine these different effects on the odds of dementia.
In the first stage we examined each of the different regions accumulating Aβ and tau-tangles in separate models, to determine the contributions of each of the regions alone with the odds of dementia (Table 2, Stage 1. Aβ Models A-D; tau-tangles: Models E-H). The second stage used a single model to examine the association of all the regions in which Aβ or tau-tangles accumulated with the probability of dementia. By including all the regions in which Aβ accumulated, this model shows which regions with Aβ have a separate effect with the probability of dementia (Stage 2. Table 2, Model I). Similarly, the single model including all the regions in which tau-tangles accumulated, showed which regions with tau-tangles have a separate effect with the probability of dementia (Stage 2. Table 2, Model J). In the third stage of our analyses, we examined which regions contributed independently to the probability of dementia when both Aβ and tau-tangles regions were included together in a single model (Stage 3. Table 2, Model K).
Multistage analysis of location of Aβ and tau-tangles with odds of a final diagnosis of dementia

This table summarizes the three stages of our primary analysis. All cells refer to logistic regression models in which dementia is the outcome and terms were included to control for age at death, years of education and sex (not shown but are included in Supplementary Table 4). Each column represents a single model with the terms shown on the left. Each cell contains an estimated odds ratio for the presence of Aβ or tau-tangles in each of the regions (Left column) and the corresponding 95% confidence interval, as well as the fitted coefficient (logit) and the p-value. Stage 1: Models A-D and E-H provide results from a separate model for Aβ or tau-tangles in each region group shown in the left column and illustrated in Fig. 1. Stage 2: Models I & J show the associations of either Aβ or tau-tangles for all the region groups in a single model, Stage 3: Model K shows the results for the probability of dementia when we included the single dominant Aβ factor
To determine the associations of the odds of AD dementia proximate to death with the presence of regional Aβ or tau-tangles, we employed separate logistic regression models with the diagnosis of AD dementia as the outcome regressed on the presence of regional Aβ or tau-tangles with terms controlling for age at death, sex, and years of education. Since all but one person had tau-tangles in at least one site within the limbic/subcortical factor, this region was not included in models with terms for tau-tangles to avoid model overfitting.
In similar logistic regression models, we then considered Aβ and tau-tangle terms together in a single model. When we included all regions with Aβ and tau-tangles in the same model (Table 2, Model K), we employed the single summary measure for Aβ because including more than one region with Aβ in a single model demonstrated multicollinearity (Table 2, Model I).
The relative contributions of location and burden of AD pathology with the probability of dementia cannot be entirely disentangled. We reasoned that adults with a higher burden of AD pathology might show Aβ and tau-tangle positivity in more sites within each of the regions that were examined. For example, the brain stem region included 5 sites. In the primary analyses (Table 2), the brainstem region was examined as a binary variable. So, the presence of Aβ was recorded as positive if 1 or more of the 5 regions showed Aβ. In this secondary analysis, the brainstem region had a scale ranging from 0 to 1 indicating how many of the 5 sites showed Aβ. If a participant had Aβ in 2 of 5 site, i.e., the locus coeruleus and substantia nigra, the brainstem fraction score for Aβ was 2/5 = 0.4. To test this hypothesis, in supporting analyses, we examined models similar to those models described above using the fraction of sites within each region in which Aβ or tau-tangles were observed (Supplementary Table 4 versus Table 2).
Statistical analyses were programmed in SAS 9.4 for Linux; An Upset plot to display several combinations of binary variables were obtained in R using the upSetR package [34]. Statistical significance was set as p < 0.05.
RESULTS
Clinical and postmortem characteristics of the analytic cohort
Three hundred participants were included in these analyses and their clinical and postmortem characteristics are included in Table 1.
Distribution of AD pathology within and outside the cerebrum
Distribution of Aβ alone
The majority (n = 266, 89%) had Aβ in the cerebrum. An additional two individuals had Aβ only in the olfactory bulb. About half (136 of 266, 51%) had Aβ in the brainstem and more than half (151 of 266, 57%) in olfactory bulb [27]. The remaining 32 (11%) with Aβ in neither cerebrum nor olfactory bulb had no evidence of Aβ in any of the regions. No Aβ was seen in the spinal cord in any of the first 165 consecutive cases [26]. Therefore, we did not examine the remaining 135 spinal cords for the presence of Aβ. Supplementary Figure 1 shows a flow chart for the distribution of Aβ in cerebrum and brainstem described above. Figure 3 illustrates the different combinations of Aβ accumulation in CNS tissues within and outside the cerebrum.

Aβ was observed outside the cerebrum in many older adults. The figure highlights the heterogeneity of Aβ accumulation in different regions of aging brains. The bar chart (red) in the lower left corner shows the frequency of Aβ positivity in each of the different regions. Connected dots on the x-axis indicate the most frequent combinations of regions in which Aβ was observed. The bar plot shows the frequencies of the combinations of regions in the participants with (yellow) and without dementia (blue), ordered by their frequency. The height of each bar corresponds to the number of participants with the varied regional combinations of Aβ positivity.
Distribution of tau-tangles alone
Next, we describe the distribution of tau-tangles within and outside the cerebrum. Nearly all individuals (n = 299, 99.7%) had tau-tangles in the cerebrum, 284 (95%) having tau-tangles in the neocortical region (and not the limbic/subcortical cerebrum), 258 of 299 (86%) having brainstem tau-tangles, and 208 (70%) olfactory tau-tangles. About 1/3 (n = 103, 34% of 300) had tau-tangles in spinal cord. There were no cases with isolated tau-tangles in the spinal cord as all of these cases had tau-tangles in the limbic/subcortical region and 92 (89%) had tau-tangles in both cerebrum and brainstem.
Tau-tangles were observed throughout the spinal gray matter with decreasing frequency from rostral to caudal levels [cervical (n = 81, 79%); thoracic (n = 26, 26%), lumbar (n = 24, 24%), and sacral (n = 13, 15%)]. Tau-tangles were more common in the cervical than in the thoracic cord (p < 0.001); tangle frequencies for the thoracic versus lumbar cord sections and lumbar versus sacral cord sections were not different (all p > 0.10; Supplementary Table 1). At all cord levels, tau-tangles were most commonly observed in the ventral horn (n = 97, >94%).
Figure 4 illustrates that tau-tangles were observed outside the cerebrum (a) in multiple tissues including olfactory bulb (b), different sites in the brainstem (c & d) and in the anterior horn of the spinal cord. Figure 5 illustrates the different combinations of tau-tangles accumulation in the different tissues within and outside the cerebrum.
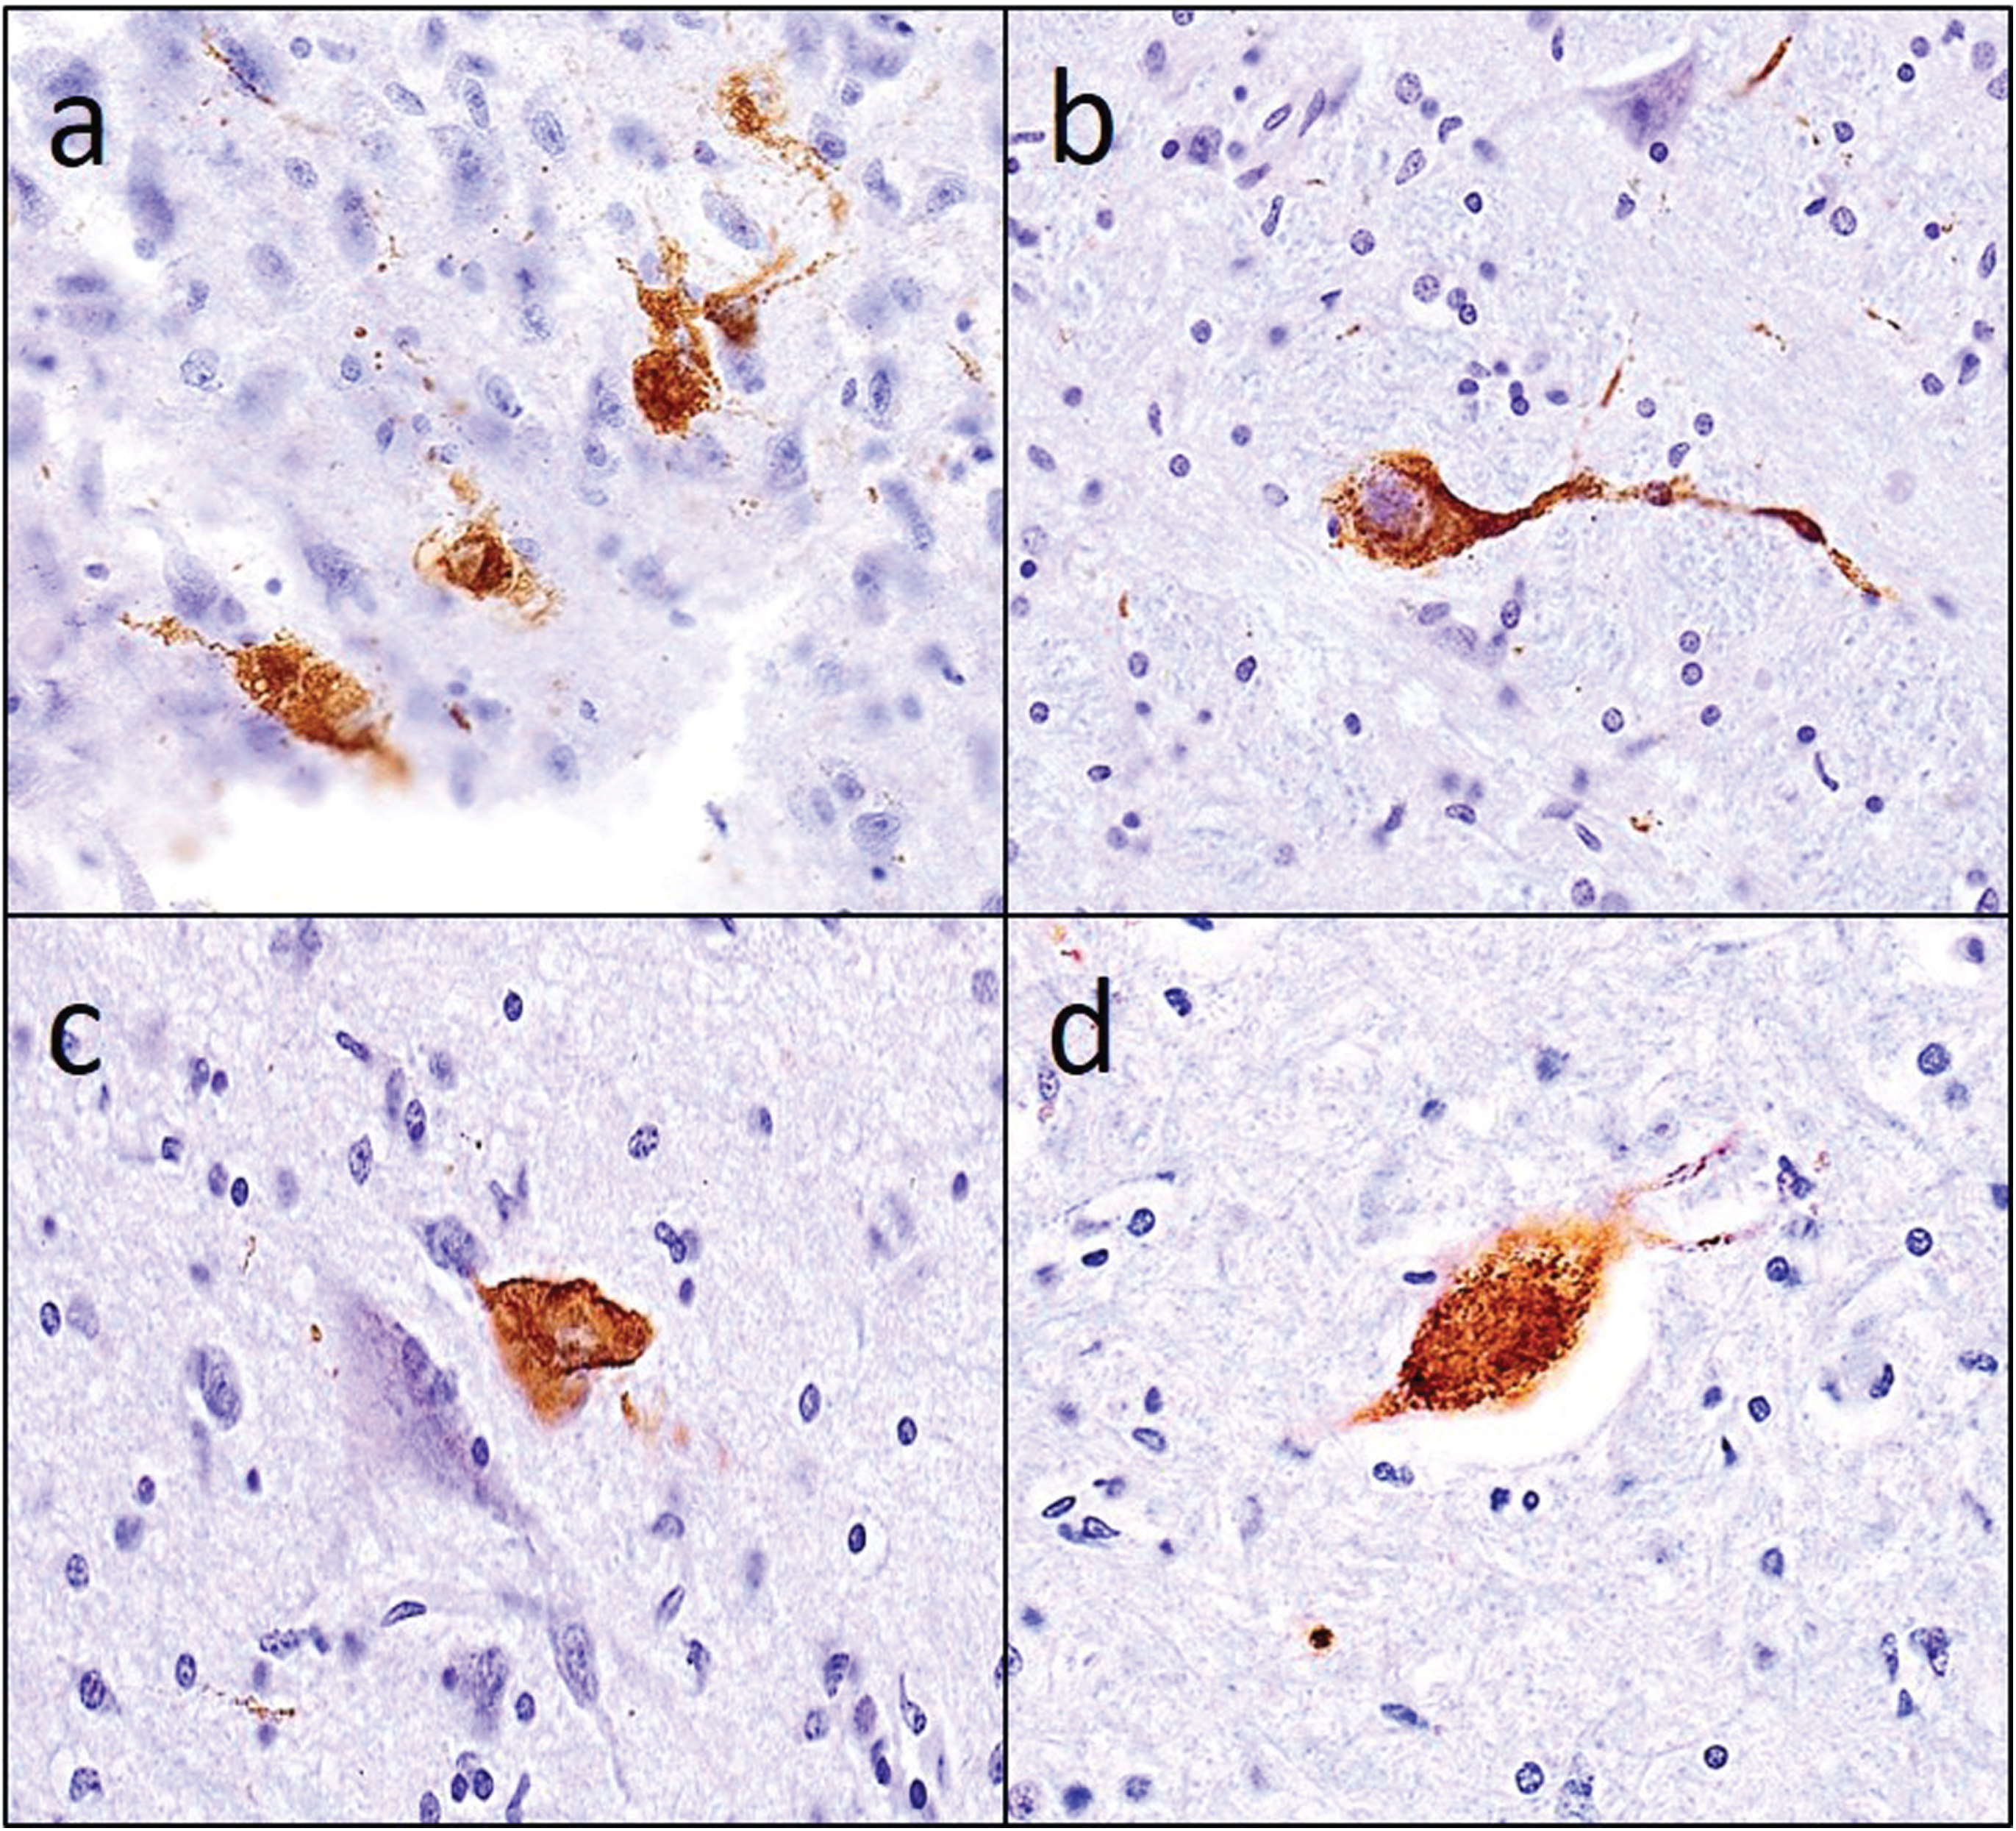
Tau-tangles were observed in diverse CNS tissues outside the cerebrum. PHFtau-tangles observed in a) olfactory bulb, (b) nucleus gigantocellularis, (c) dorsal nucleus of vagus, and (d) the anterior horn of cervical spinal cord.
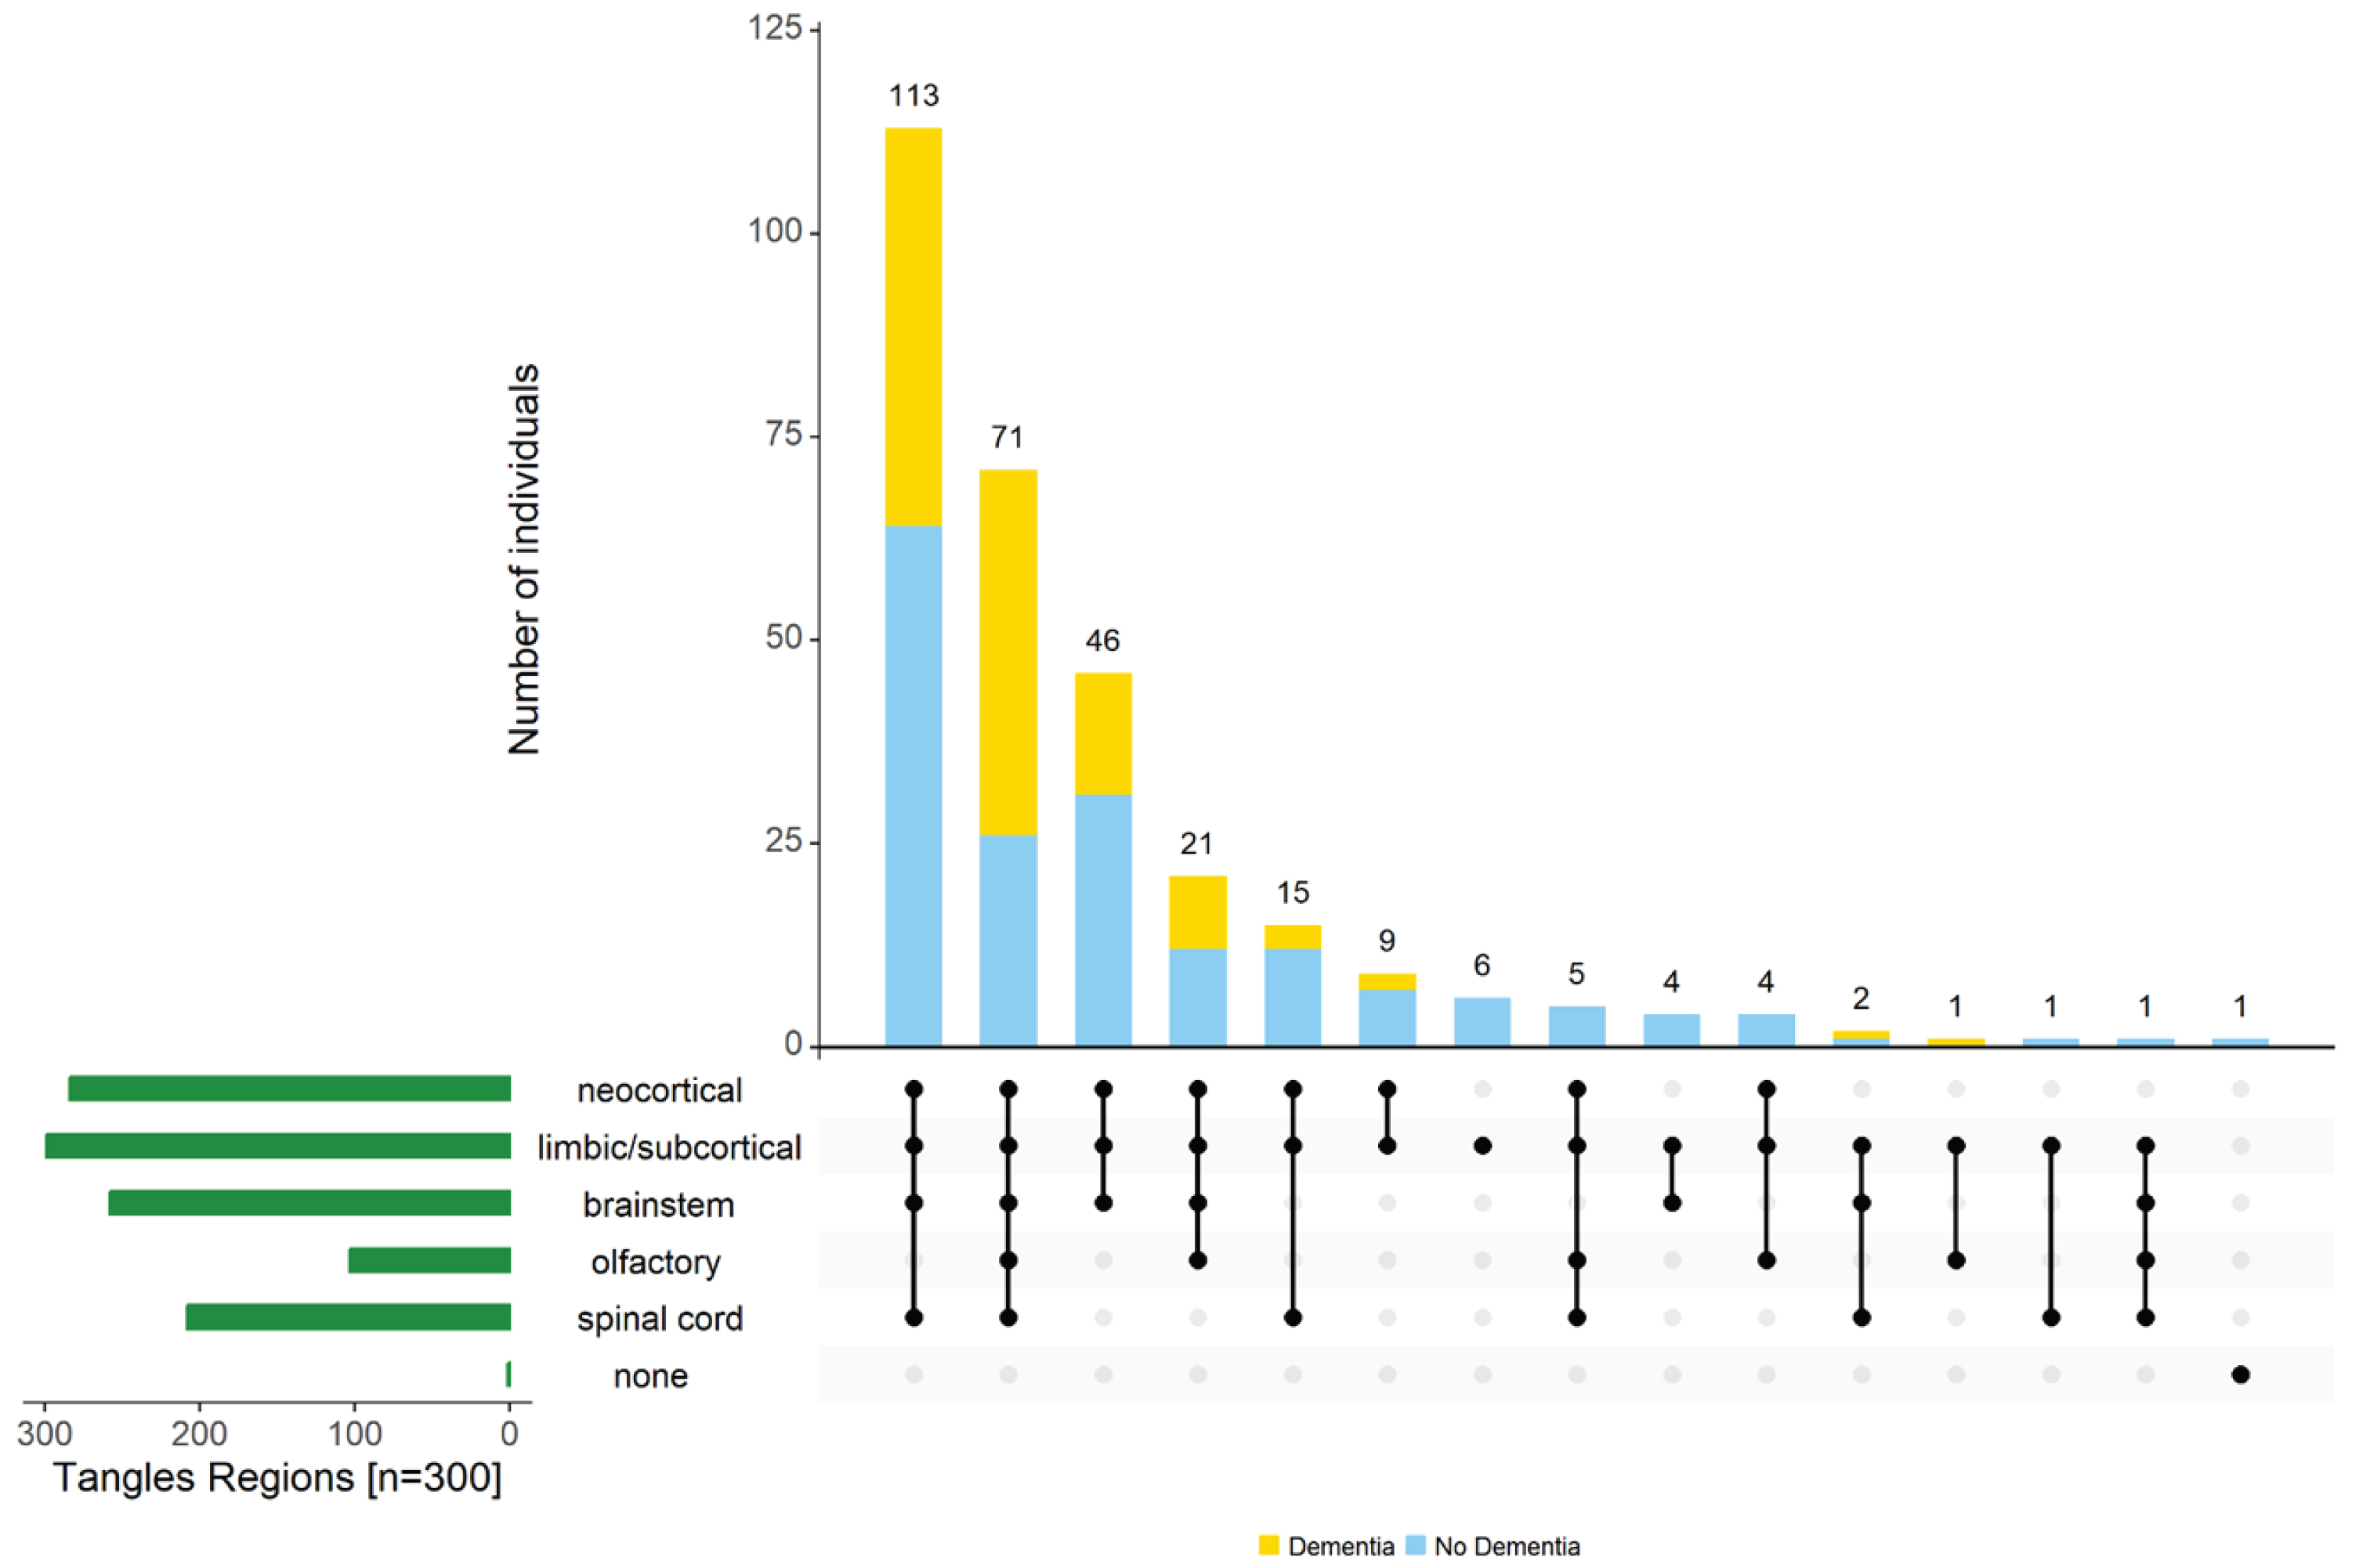
Varied combinations of regions in which tau-tangles are found outside the cerebrum. The figure highlights the heterogeneity of tau-tangles in different regions of aging brains. The bar chart (green) in the lower left corner shows the frequency of tau-tangle positivity in each of the different regions. Connected dots on the x-axis indicate the most frequent combinations of regions in which tau-tangles was observed. The bar plot shows the frequencies of the combinations of regions in the participants with (yellow) and without dementia (blue), ordered by their frequency. The height of each bar corresponds to the number of participants with the varied regional combinations of tau-tangle positivity.
Distribution of both Aβ and tau-tangles
The majority of individuals with tau-tangles had Aβ (267 of 299, 89%) in one or more regions; as previously published in this cohort, about 11% (n = 32, 10.7%) showed evidence of only tau-tangles [35]. One individual showed evidence of Aβ in olfactory bulb without evidence of tau-tangles (Fig. 6).
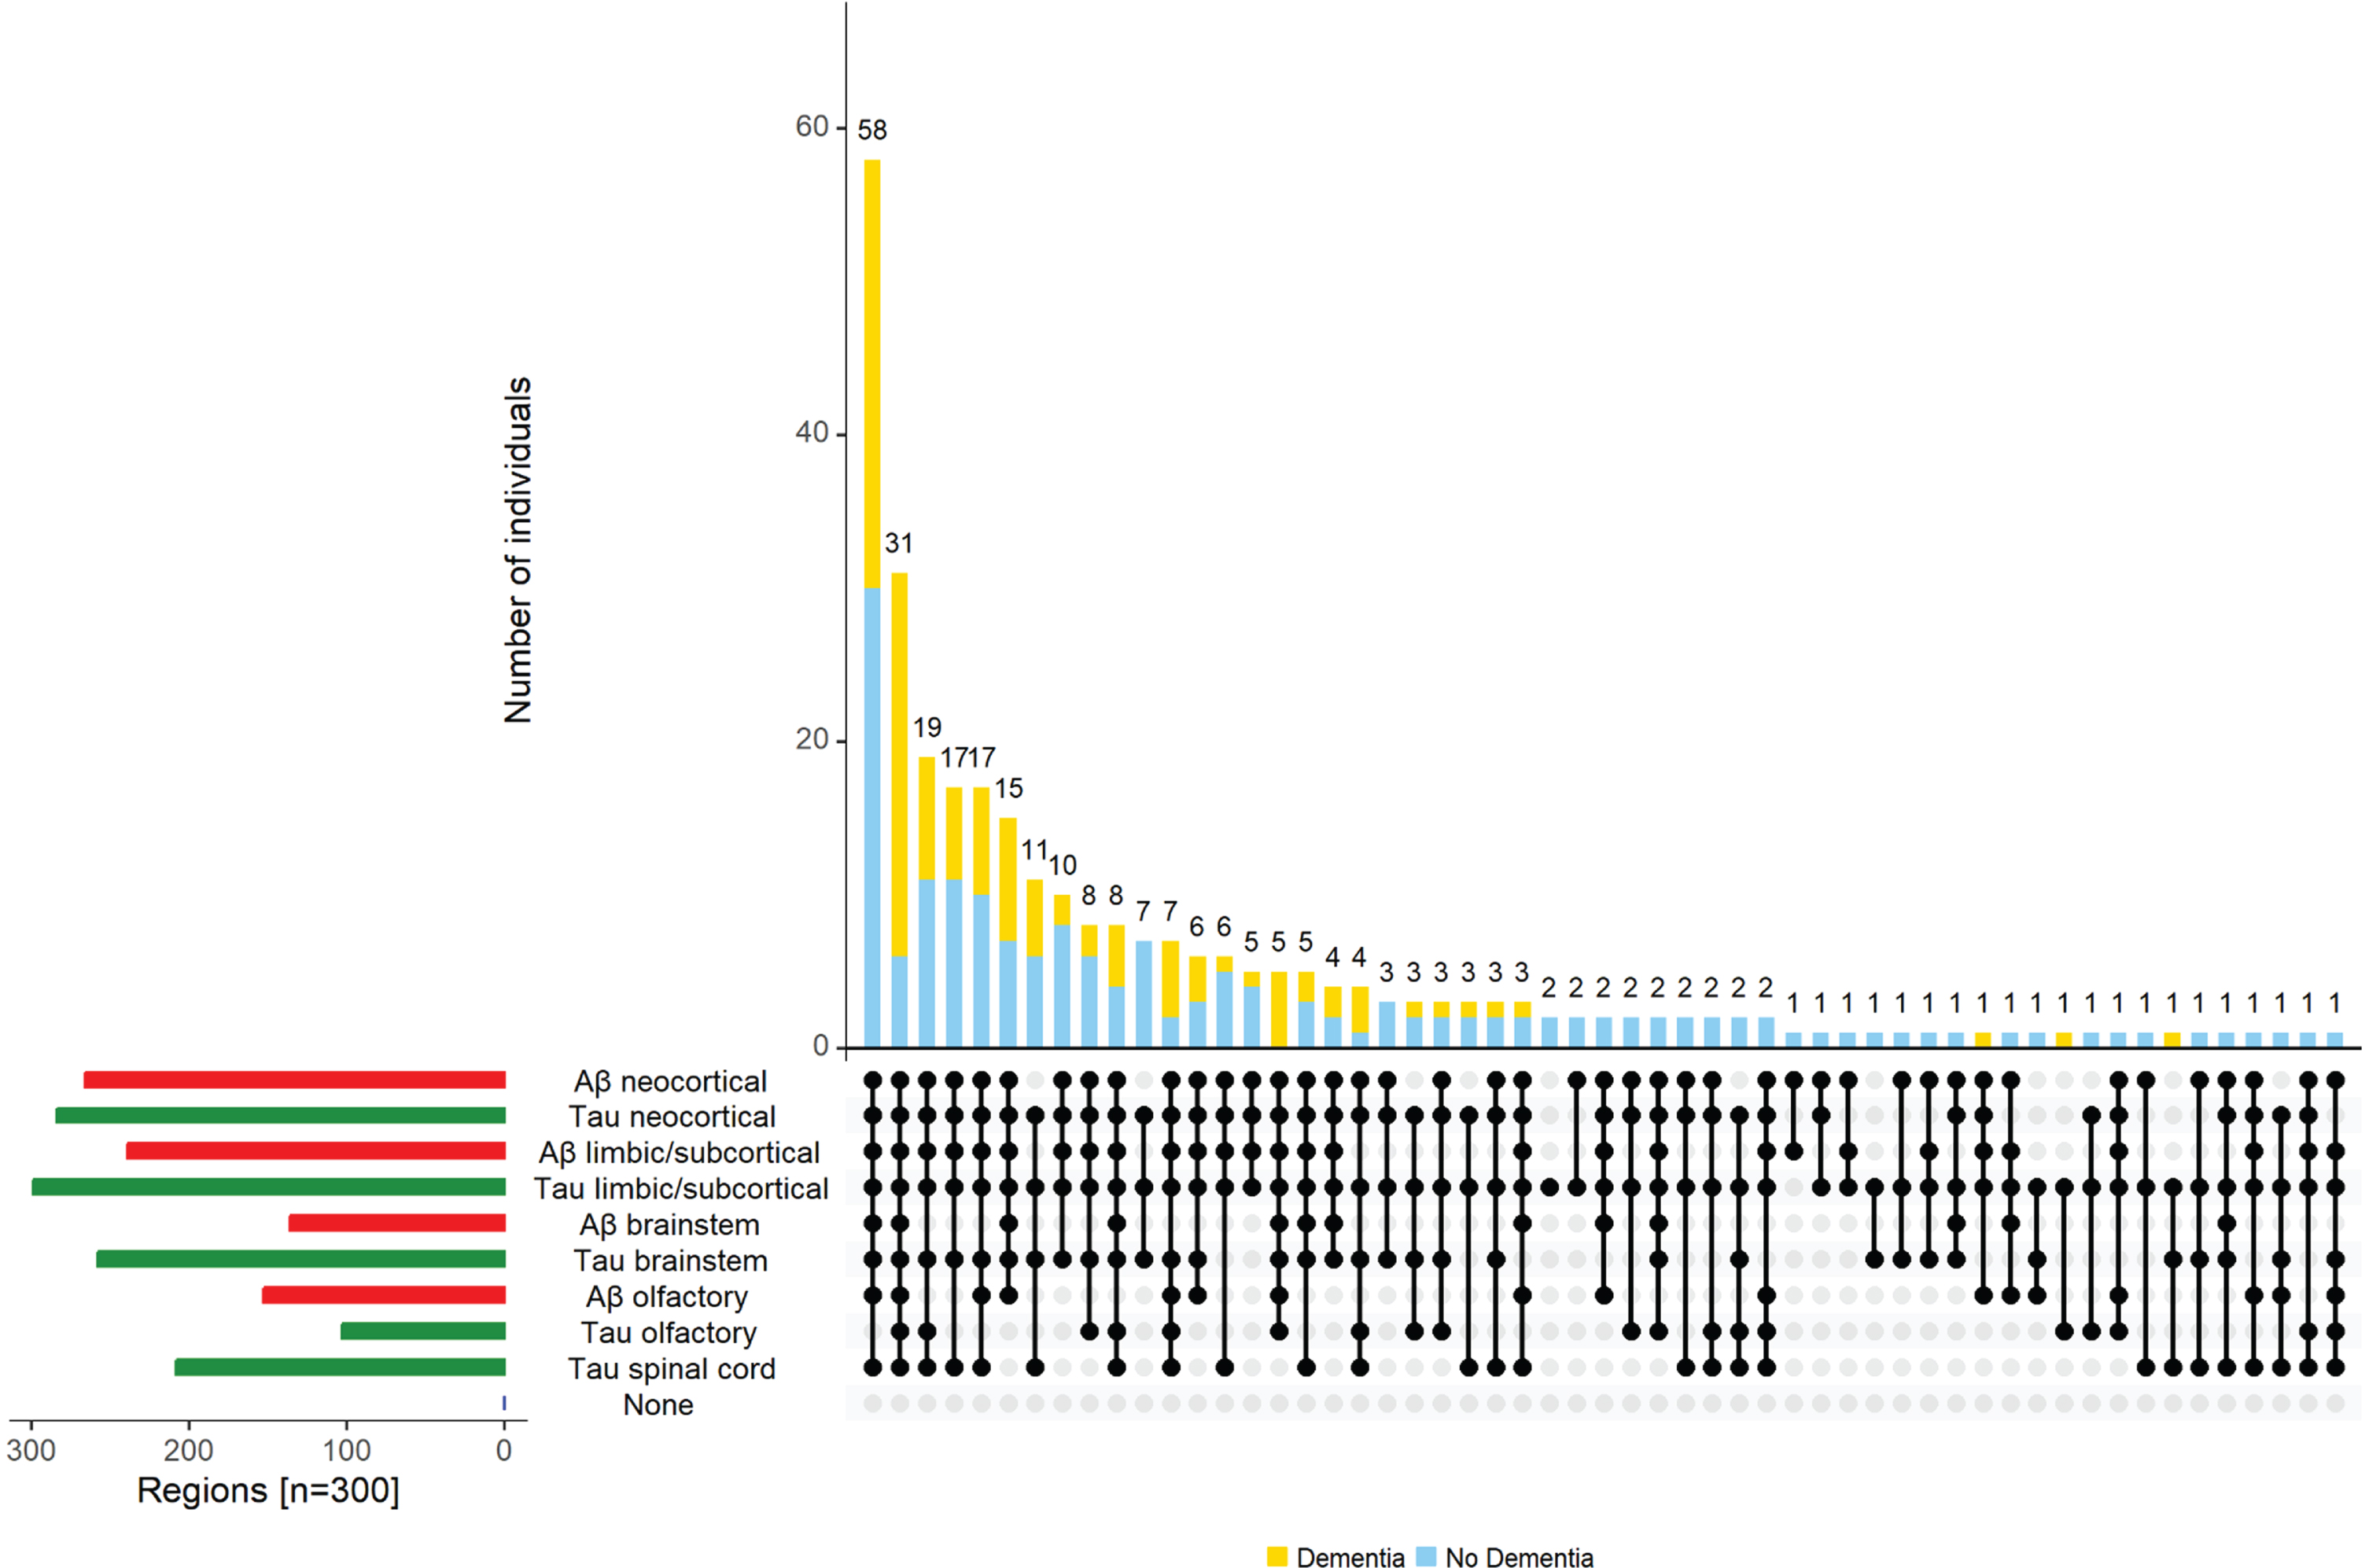
Combinations of Aβ and tau-tangles observed in the current study. The figure highlights the heterogeneity of Aβ and tau-tangles presence in different regions within and outside the cerebrum in aging brains. The bar chart in the lower left corner shows the frequency of Aβ (red) and tau-tangles (green) positivity in each of the different regions. Connected dots on the x-axis indicate the most frequent combinations of regions in which tau-tangles was observed. The bar plot shows the frequencies of the combinations of regions in the participants with dementia (yellow) and without dementia (blue), ordered by their frequency. The height of each bar corresponds to the number of participants with the varied regional combinations of Aβ and tau-tangles positivity.
Decedents with spinal tau-tangles showed more extensive Aβ with 60% showing amyloid in both brain and brainstem and 40% showed amyloid restricted to cerebrum. Tau-tangle positivity did not vary in different regions in adults with and without APOE4 allele, but was higher in adults with the APOE4 allele (Supplementary Table 2).
Distribution of Aβ and tau-tangles and odds of AD dementia
In further analysis, we examined if the presence of AD pathology outside the cerebrum was related with the probability of a final diagnosis of AD dementia. Our analysis proceeded in three stages to determine which regions showing Aβ and tau-tangles were independently associated with the odds of AD dementia.
Distribution of Aβ alone and odds of AD dementia
The presence of Aβ in each of the individual four Aβ region groups was associated with a 2-fold increase in the odds of dementia (Table 2, Models A-D). Demographics terms for all the models in Table 2 are included in Supplementary Table 4. Yet, when all the Aβ region groups are included together in a single model, none of the four region groups demonstrated independent associations with AD dementia i.e., none of the terms show significant associations (Table 2, Model I). That is, the presence of Aβ in different regions is too correlated to disentangle regional effects.
Distribution of tau-tangles alone and odds of AD dementia
The presence of tau-tangles in each of the four individual tau-tangles region groups was associated with more than a 2-fold increase in the odds of dementia (Table 2, Models E-H). The 95% confidence interval for the model examining tau-tangles in the cortical region is very wide, suggesting that there are insufficient individuals without cortical tau-tangles (Table 2, Model E) to estimate this term accurately; so, this term was not included in further modeling. The presence of tau-tangles in the other three region groups outside of the cerebrum showed independent associations with odds of AD dementia (Table 2, Model J).
This study examined the associations of the CNS regions in which Aβ and tangles were present within and outside the cerebrum with dementia. Nonetheless, we reasoned that adults with a higher burden of AD pathology were likely to show an increased number of sites with Aβ and tau-tangles positivity within each of the regions that were examined. We employed similar models using regional measures which summarized the fraction of sites within each region that showed Aβ or tau-tangles positivity. These models showed similar findings to models using binary measures (Table 2 versus Supplementary Table 5).
Distribution of both Aβ and tau-tangles and odds of AD dementia
As reported above, when Aβ in different regions are considered together, none of the regions were associated with AD dementia (Table 2, Model I). This result is consistent with our factor analysis and led us to construct a single dominant Aβ factor. In a final model, we examined the tau-tangles region groups together with the single dominant Aβ factor. We found that tau-tangles in the brainstem and spinal cord remained associated with an increased risk of AD dementia proximate to death (Table 2, Model K).
Secondary analyses
The results in Table 2 were unchanged in a sensitivity analysis excluding two individuals with non-AD dementia (results not shown).
We repeated models C and F in Table 2 adding terms to adjust for a history of head trauma or chronic health conditions. The increased probability of dementia associated with the presence of brainstem AD pathology was not attenuated by these adjustments (Supplementary Table 6).
Aβ and tau-tangles outside the cerebrum and risk of pathologic AD
We used similar regression models to examine if the presence of AD pathology in the brainstem, olfactory bulb and spinal cord was associated with an increased probability of more severe score for three conventional AD pathology staging instruments for pathologic diagnosis of AD. The presence of Aβ and tau-tangles in the brainstem, olfactory bulb and spinal cord were associated with an increased odds of a higher conventional staging score for the presence of pathologic AD (Supplementary Table 7).
DISCUSSION
The current clinical-pathologic study assessed dementia status annually until death in 300 community-dwelling older adults and at death, we measured the presence of Aβ and tau-tangles within and outside the cerebrum including preselected sites in brainstem, olfactory bulb, and spinal cord. The distribution of Aβ and tau-tangles in these regions differed. The most striking difference observed was that spinal cord Aβ was not observed while about 1/3 showed spinal tau-tangles. There were marked rostral-caudal reductions of both Aβ and tau-tangles from cortex to spinal cord. The presence of AD pathology in regions outside the cerebrum including tau-tangles in brainstem, olfactory bulb and spinal cord were independently associated with a higher odds of a final diagnosis of dementia. These results justify further studies to probe the accumulation patterns, beyond the preselected sites outside the cerebrum examined in this study. Moreover, to advance our understanding these studies will need to determine the full extent, burden and mechanisms underlying the regional differences in Aβ and tau-tangles accumulation outside the brain and how these differences may contribute to the clinical heterogeneity and course of AD.
Aggregates of misfolded proteins are the hallmarks of AD. The pathologic features of AD have been known for many years, but silver-staining techniques have been replaced with molecularly specific immunohistochemistry for Aβ and tau-tangles [8 , 36]. Due to the heterogeneity of the accumulation of AD pathology, the assessment of Aβ and tau-tangles has always required assessment of multiple sites in the cerebrum. Several staging protocols have been employed to summarize different features of AD pathology [8 , 36]. These protocols usually focus on different stages based on sites within the cerebrum [37]. The topography of Aβ and tau-tangles deposits vary with the disease stage and there is little evidence to suggest that both are spatially related so their distributions may be considered independent [38, 39].
Several smaller studies have documented tau-tangle positivity in spinal cord in older adults with and without AD dementia [21, 40]. As there is increasing recognition that AD pathology can also affect non-cognitive phenotypes like motor function it is crucial to document the full extent and distribution of AD pathology that occurs outside of the cerebrum since this may account in part for the varied non-cognitive phenotypes affected by AD pathology.
The current study extends prior reports in several important ways. We assessed indices of Aβ and tau-tangles in multiple sites within and outside the cerebrum including brainstem, olfactory bulb, and spinal cord. Focusing on cerebrum, tau-tangles were seen in nearly all cases while Aβ was seen in about 90% as previously reported [35]. Differences between the distribution of Aβ and tau-tangles were more striking in regions outside of the cerebrum.
The most striking difference between the distributions of Aβ and tau-tangles was the absence of spinal Aβ and the presence of spinal tau-tangles in one-third of decedents. One prior smaller study provided sufficient data about spinal tau-tangles for comparison to our results [21]. Spinal tau-tangles were observed in older adults with and without dementia, but the prior study showed a higher percentage of cases with spinal tangle positivity with nearly all cases with dementia showing positivity and more than 40% of controls. Spinal tangle positivity was highest in the ventral horn of the cervical spinal cord but tau-tangles were also seen in thoracic, lumbar, and sacral spinal cord. The prior study reported no cases of isolated spinal tau-tangles, but details about the supraspinal regions examined for Aβ and tau-tangles were not included. Although spinal tau-tangles were observed in 1/3 of adults in the current study there were no instances of isolated spinal tau-tangles and tau-tangles were observed at one or more regions rostral to the spinal cord (Fig. 4).
The rostral-caudal gradient of tau-tangles from cortical to spinal levels as well as of the absence of any cases of isolated spinal tau-tangles suggests that spinal tau-tangles may originate from an as yet undetermined site rostral to the spinal cord where tau-tangle pathology may begin. To determine the site where the earliest stages of AD begin is difficult to do from conventional autopsy data which is obtained at a single point in time and especially when using binary terms for the presence or absence of Aβ and tau-tangles.
Over the past decade, studies focusing on preclinical AD have suggested that tangle accumulation in the brainstem structures particularly the locus coeruleus might be the site of the earliest of accumulation of AD pathology [20 , 41–43]. Yet, few of these studies have also examined caudal brainstem and spinal cord tissues. It is unclear if the presence of AD pathology in the lower brainstem and spinal cord in the current study is an early or late finding. Yet, these data from the current study suggest that further studies are needed about the relationship of tau-tangles in lower brainstem, olfactory bulb, and spinal cord before concluding that the locus coeruleus is the primary site for the initiation of tau-tangles within the CNS.
The striking regional differences observed in the current study of the accumulation of Aβ and tau-tangles especially in spinal cord as compared to other CNS tissues, extends findings from prior studies in this cohort that have also reported regional differences in the accumulation of other ADRD pathologies including Lewy bodies and microvascular pathologies in spinal cord as compared to the cerebrum [23, 44]. The biology underlying these differences is unknown and may derive from altered cellular vulnerability in CNS tissues or reflect features underlying the pathogenesis of Aβ and tau-tangles [45]. Finally, since the description of primary age-related tauopathy (PART) there has been increasing evidence about the important synergy between Aβ and tangles in AD. Nonetheless, nearly all of the work about these interactions have focused on cerebrum. It is unclear how the regional differences in Aβ and tau-tangles observed in regions outside the cerebrum in the current study might affect clinical classification of individuals showing both Aβ and tau-tangles in cerebrum but not in other regions outside the cerebrum or the reverse [46].
To more easily summarize and identify regional distributions of Aβ and tau-tangles, we applied factor analyses to the data collected to obtain a smaller number of regional groupings of the multiple sites examined. The factor analysis lent empiric support to anatomic groupings used in prior AD studies and staging protocols. Yet, we found that in addition to different distributions Aβ and tau-tangles, summary terms for these traits behaved differently in our analyses. Binary regional terms for the presence of tau-tangles showed that combinations of terms for different groups of tau-tangles added information when modeled together. By contrast, combinations of terms for Aβ do not add information, but rather a single dominant term best captures Aβ variation. This does not mean that the presence or absence of Aβ in different regions is unimportant, but rather that different analytic approaches may be needed to analyze the regional contributions of Aβ in different CNS tissues with different aging phenotypes. Further work is needed to determine to what extent more granular continuous measures of the burden of these pathologic traits or more extensive sampling of different locations may yield different findings.
Our results may also have clinical consequences. The widespread accumulation of AD pathologic traits outside the cerebrum in adults without dementia supports the growing recognition that AD does not only affect cognition, but can adversely affect non-cognitive phenotypes like motor function, BMI, and sleep disturbances [3]. Yet, our analyses showed that the presence of AD outside the cerebrum in regions that do not subserve cognitive function including Aβ in olfactory bulb and tau-tangles in brainstem and spinal cord were independently associated with a higher odds of dementia prior to death. It is likely these findings may not be causal, but rather indicate that individuals with accumulation of AD pathology outside the cerebrum may have more severe disease and a higher burden of AD pathology. This possibility is supported by our findings that accumulation of AD pathology outside the cerebrum was associated with an increased odds of more severe conventional staging scores for pathologic AD (Supplementary Table 7). Yet, prior work in this cohort has reported that locus coeruleus neuronal density and brainstem tangles had independent associations with the rate of cognitive decline [47]. Spinal cord injury has frequently been reported to be associated with poor cognition [48]. Spinal cord AD pathology may also affect muscle-brain secretion of myokine thought to affect cognition [49]. These studies suggest that other indirect routes to cognitive impairment via sleep and autonomic nervous system dysfunction or muscle-brain cross talk may result from AD pathology accumulating in brainstem or spinal cord. Thus, our results highlight the need for further studies that also measure the burden of AD pathology in sites within and outside the cerebrum.
There are several limitations to the current study. The cases we studied are from a selected cohort that differs in important ways such as age and education from the general population. It will be important to investigate these findings in more diverse cohorts. The current study was not powered to identify differences in the regional distributions of tau-tangles in different regions between adults with and without Aβ [35]. A larger sample may also be needed to determine whether the regional distributions of Aβ or tau-tangles vary with APOE genotype as the current smaller sample size replicated prior findings for Aβ but not for tau-tangles as reported in a larger sample from the current cohort [35]. Despite the large numbers of individuals and findings of AD pathology outside the cerebrum, this study was underpowered to model associations with the rate of cognitive decline or with non-cognitive phenotypes. So, studies with larger samples are needed. While history of head trauma was available, history of spinal cord injury was not available and should be considered in future studies.
Another limitation of the current study is that our finding that AD pathology outside the cerebrum may increase the probability of dementia prior to death may be confounded by the burden of tau-tangles in the cerebrum. This study was intended as a survey of AD pathology traits in locations outside the cerebrum that have been examined infrequently. The current study met its descriptive goal and lays out the groundwork for a further study to examine additional locations outside the cerebrum for the presence of AD pathology and emphasizes the necessity of quantifying the burden of AD pathology to address the limitation of the current analyses. Finally extending these studies to the periphery may yield biomarkers of early Aβ and tau-tangles that may obtained in living older adults [50].
There are several strengths to the study, including the prospective study of large numbers of community-dwelling women and men without clinical dementia at study entry coming to autopsy that examined sites in conventional AD pathology staging sites as well as lower brainstem, olfactory bulb and spinal cord following high rates of clinical follow-up and high autopsy rates. Uniform structured clinical procedures were used that included a detailed cognitive assessment that have been widely used in other studies.
Footnotes
ACKNOWLEDGMENTS
We are deeply indebted to all participants who contributed their data and biospecimens. We are thankful to the staff in the Rush Alzheimer’s Disease Center.
FUNDING
This work was supported by National Institute of Health R01AG17917, R01AG47976, R01AG56352; the Illinois Department of Public Health. The funding organizations had no role in the design or conduct of the study; collection, management, analysis, or interpretation of the data; or preparation, review, or approval of the manuscript.
CONFLICT OF INTEREST
The authors have no conflict of interest to report.