
Abstract
Background:
Alzheimer’s disease (AD) is the most prevalent neurodegenerative disease. The detection of early-stage AD is particularly desirable because it would allow early intervention. However, a minimally invasive, low-cost, and accurate discrimination or diagnostic method for AD is especially difficult in the earliest stage of AD.
Objective:
The aim of this research is to discover blood plasma spectral digital biomarkers of AD, develop a novel intelligent method for the discrimination of AD and accelerate the translation of Fourier transform infrared (FTIR) spectral-based disease discrimination methods from the laboratory to clinical practice.
Methods:
Since vibration spectroscopy can provide the structure and chemical composition information of biological samples at the molecular level, we investigated the potential of FTIR spectral biomarkers of blood plasma to differentiate between AD patients and healthy controls. Combined with machine learning technology, we designed a hierarchical discrimination system that provides reagent-free and accurate AD discrimination based on blood plasma spectral digital biomarkers of AD.
Results:
Accurate segregation between AD patients and healthy controls was achieved with 89.3% sensitivity and 85.7% specificity for early-stage AD patients, 92.8% sensitivity and 87.5% specificity for middle-stage AD patients, and 100% sensitivity and 100% specificity for late-stage AD patients.
Conclusions:
Our results show that blood plasma spectral digital biomarkers hold great promise as discrimination markers of AD, indicating the potential for the development of an inexpensive, reagent-free, and less laborious clinical test. As a result, our research outcome will accelerate the clinical application of spectral digital biomarkers and machine learning.
Keywords
INTRODUCTION
Alzheimer’s disease (AD) is the most common type of dementia, causing severe cognitive decline, irreversible memory loss, and unavoidable death. Due to complex physio-pathological features and the uncertainty in the exact mechanism of AD, a combination of more than one test is usually necessary to provide a reliable AD diagnosis. In other words, the diagnosis of AD requires a comprehensive system-level evaluation. Thus, ATN biomarkers (Aβ deposition [A], pathologic tau [T], and neurodegeneration [N]) have the potential to revolutionize the clinical practice of AD diagnosis and risk monitoring [1, 2]. However, the high expense (positron emission tomography, PET), invasiveness (cerebrospinal fluid, CSF), and dependence on relevant complex equipment (ultra-performance liquid chromatography tandem mass spectrometry) severely limit the utility of ATN-related methods for standard clinical practice or large-scale AD discrimination. Recently, metabolites in blood plasma associated with ATN biomarkers have been used to identify biochemical pathway alterations linked to AD and provide a more complete picture of the metabolomics basis of dementia pathology [3, 4–6]. Plasma is a complex body fluid containing proteins, peptides, lipids, and metabolites that reflect physiological activity and pathology in various body organs, including the central nervous system. Encouragingly, Fourier transform infrared (FTIR) spectroscopy, as a potential tool to identify metabolic changes in dementia patients, has been explored in clinical diagnosis, shedding light on realizing comprehensive and systematic AD discrimination with a high-throughput, low-cost, low-complexity, reagent-free and minimally invasive nature [7–9]. FTIR spectroscopy employs the interaction of light with biological matter, upon which characteristic vibrational motions are created and allows the generation of a unique biological fingerprint for each biological sample by providing information at the molecular level. Specifically, FTIR spectroscopy simultaneously investigates functional groups, bonding types, and molecular conformations corresponding to the presence of different compounds, such as proteins, amino acids, lipids, carbohydrates, and nucleic acids [10–12]. Diseases and other pathological anomalies lead to chemical and structural alterations at the molecular level that also change the FTIR spectra. These spectral changes form a unique fingerprint for each sample and can be used as sensitive and phenotypic markers of diseases, known as spectral digital biomarkers. Then, these signatures can be analyzed by machine learning algorithms to distinguish between a pathological and healthy sample.
From a machine learning perspective, disease discrimination or diagnosis at different stages is essentially a multiclassification problem. Accurate AD discrimination remains a challenge due to subtle differences and severe overlap of spectral information between AD patients with different stages and healthy controls (HCs). The traditional discrimination method based on flat multiclassification directly classifies samples into four classes: early-stage AD, middle-stage AD, late-stage AD, and HCs. The disadvantage of flat multiclassification discrimination is that it depends on a single decision from all the possible outputs without an inherent connection between them. Thus, it cannot accurately distinguish between the different stages of complex diseases, such as AD. Using hierarchies of classes is one of the standard methods to solve multiclassification problems, and selecting the right hierarchy is considered to play a key role in improving classification performance [13]. A hierarchical multiclassification scheme has been proven to be more suitable for the classification of different AD stages [14]. To accurately distinguish between the different AD stages, we developed a blood plasma spectra-based AD discrimination method under a novel hierarchical discrimination framework to solve low-cost, less invasive, and accurate discrimination problems at different stages of AD.
METHODS
Participants and sample processing
A total of 323 patients with AD and 348 age- and sex-matched HCs were recruited from December 2018 to December 2021 at cognitive impairment clinics of Tianjin Huanhu Hospital, Tianjin, China. All protocols and methods described in this study were approved by the Medical Ethics Committee of Tianjin Huanhu Hospital (Project number 2020-60) and were conducted in accordance with the Declaration of Helsinki. Informed consent was obtained from all participants following a thorough explanation of all test procedures. The patients in the AD group fulfilled the National Institute on Aging and Alzheimer’s Association core clinical criteria for probable AD dementia and had 11C-PIB PET scans showing positive Aβ deposition [15]. The exclusion criteria were as follows: diagnosis of any neurological disease except AD; uncorrected dysfunctions of vision, hearing loss, aphasia, or an inability to complete a clinical examination or scale assessment; history of mental disorders and illicit drug abuse; acute or chronic liver and kidney dysfunction, blood disease, malignant tumors, or other serious underlying diseases; and any medication (such as anti-Aβ antibody, anti-cholinesterase drug, NMDA receptor antagonist) that might affect the results within 2 weeks before blood collection. HCs had no history of psychiatric or neurological illness or evidence of cognitive decline, as well as Mini-Mental State Examination (MMSE) and Montreal Cognitive Assessment (MoCA) scores within the normal range (adjusted for age, sex, and education). All participants received a routine clinical evaluation, including collecting basic information, detailed medical history, neurological examination, laboratory examination and neuroimaging. Each participating patient had undergone cognitive assessment via the MMSE, MoCA, activities of daily living (ADL), and Clinical Dementia Rating (CDR). Due to limited conditions, healthy control groups were not confirmed to be PIB negative. Therefore, the control subjects are likely contaminated by presymptomatic AD pathology. To minimize this interference, all clinical diagnoses of AD were made by consensus agreement of at least two experienced neurologists. AD patients were classified into three groups: early-stage AD (n = 182), middle-stage AD (n = 96), and late-stage AD (n = 45). Early-stage AD subjects had an MMSE score ranging between 22 and 26 (inclusively) and a CDR of 0.5 or 1. Middle-stage AD subjects had an MMSE score ranging between 10 and 21 (inclusively) and a CDR of 2. Late-stage AD subjects had an MMSE score of at least 9 and a CDR of 3. The age range of the AD group was 45–89 years, and the mean age was 66.42±5.17 years. The age range of the HC groups was 21–87 years, and the mean age was 65.86±6.18 years. Patient demographics are provided in detail in Table 1. We specifically selected 12 samples from the 21–50 young age group of HCs to test whether they have an impact on early AD discrimination.
Demographic information for the cohort included in the study
Considering the impact of dietary structure and collection time on the composition of plasma, we standardized blood collection procedures with regard to prandial state and time of day. After a 12–14 h overnight fast and between 07:30 and 08:30 am before breakfast, peripheral blood from each participant was collected by venipuncture into 6-mL EDTA-containing test tubes. Immediately (within 2 h) after collection, blood was centrifuged (2,200 rpm, 10 min) and stored at–80°C until measurement. Smoking, alcohol consumption and vigorous activity were prohibited 24 h before the study. Samples were thawed at room temperature when necessary for experiments. According to the ratio of 7:1.5:1.5, the participants were divided into three parts: training set, validation set and test set by the KS method [16]. The training set and validation set were used to extract spectral biomarkers related to AD and build the AD discrimination system. The test set was used to evaluate the discrimination performance, and the number of samples in each dataset is shown in Table 2.
The results of AD sample dataset division
Spectral data of blood plasma sample acquisition
The spectra of blood plasma samples were obtained using an Alpha FTIR spectrometer with an attenuated total reflection (ATR) attachment (Bruker Optics Ltd) operated by OPUS 5.5 software. After the frozen samples were thawed, 10βL from each sample was deposited on the sampling area of the ATR. Water molecules strongly absorb in the mid-infrared region. To extract information from the spectra of biological samples, water signals should be eliminated. The drying process is time-consuming but requires fewer computational manipulations and was shown to be capable of eliminating the water spectral contribution, maintaining a reasonable signal-to-noise ratio (SNR). The ATR-FTIR spectra of blood plasma samples were scanned 32 times and recorded in the range 4000–950 cm-1 at 4 cm-1 resolution. The diamond crystal of ATR was cleaned with distilled water and dried every time before moving to the next sample, and a background spectrum was also taken after the analysis of each sample to reduce the impact of environmental or ambient condition changes.
AD discrimination process in spectral ATN(X) information space
AD has a long preclinical phase that is characterized by accumulating pathology in the brain [17]. It has been widely recognized that a single theory of pathogenesis cannot reflect the complete picture of AD. Even the ATN system is intended to dynamically evolve with our knowledge of the pathophysiological mechanisms underlying AD. ATN is now expanding toward an ATN(X) system, where X represents novel candidate biomarkers for additional pathophysiological mechanisms [18]. For instance, vascular, inflammatory, gut microbiota, vitamins, and noncoding RNAs have been extensively studied as novel pathogenic factors [4, 18]. In our study, the ATN(X) system was completely transformed into the spectral information space by measuring the spectra of blood plasma samples, that is, the ATN(X) spectral information space. Our discrimination strategy was to maximize the discovery and use of spectral digital biomarkers associated with AD in ATN(X) spectral information space. As mentioned above, the essence of disease discrimination is classification problems. Combined with machine learning methods, such as the random forest (RF) classifier, the designed AD discrimination system utilizes all discovered spectral biomarkers of AD and allows for rapid and accurate discrimination of patients with different stages of AD. The main steps of the discrimination process (Fig. 1) are as follows: construct the ATN(X) spectral information space of blood plasma samples; design a hierarchical discrimination framework and extract AD spectral digital biomarkers as input variables of the AD discrimination system; and collect new samples, conduct tests, and complete AD discrimination.
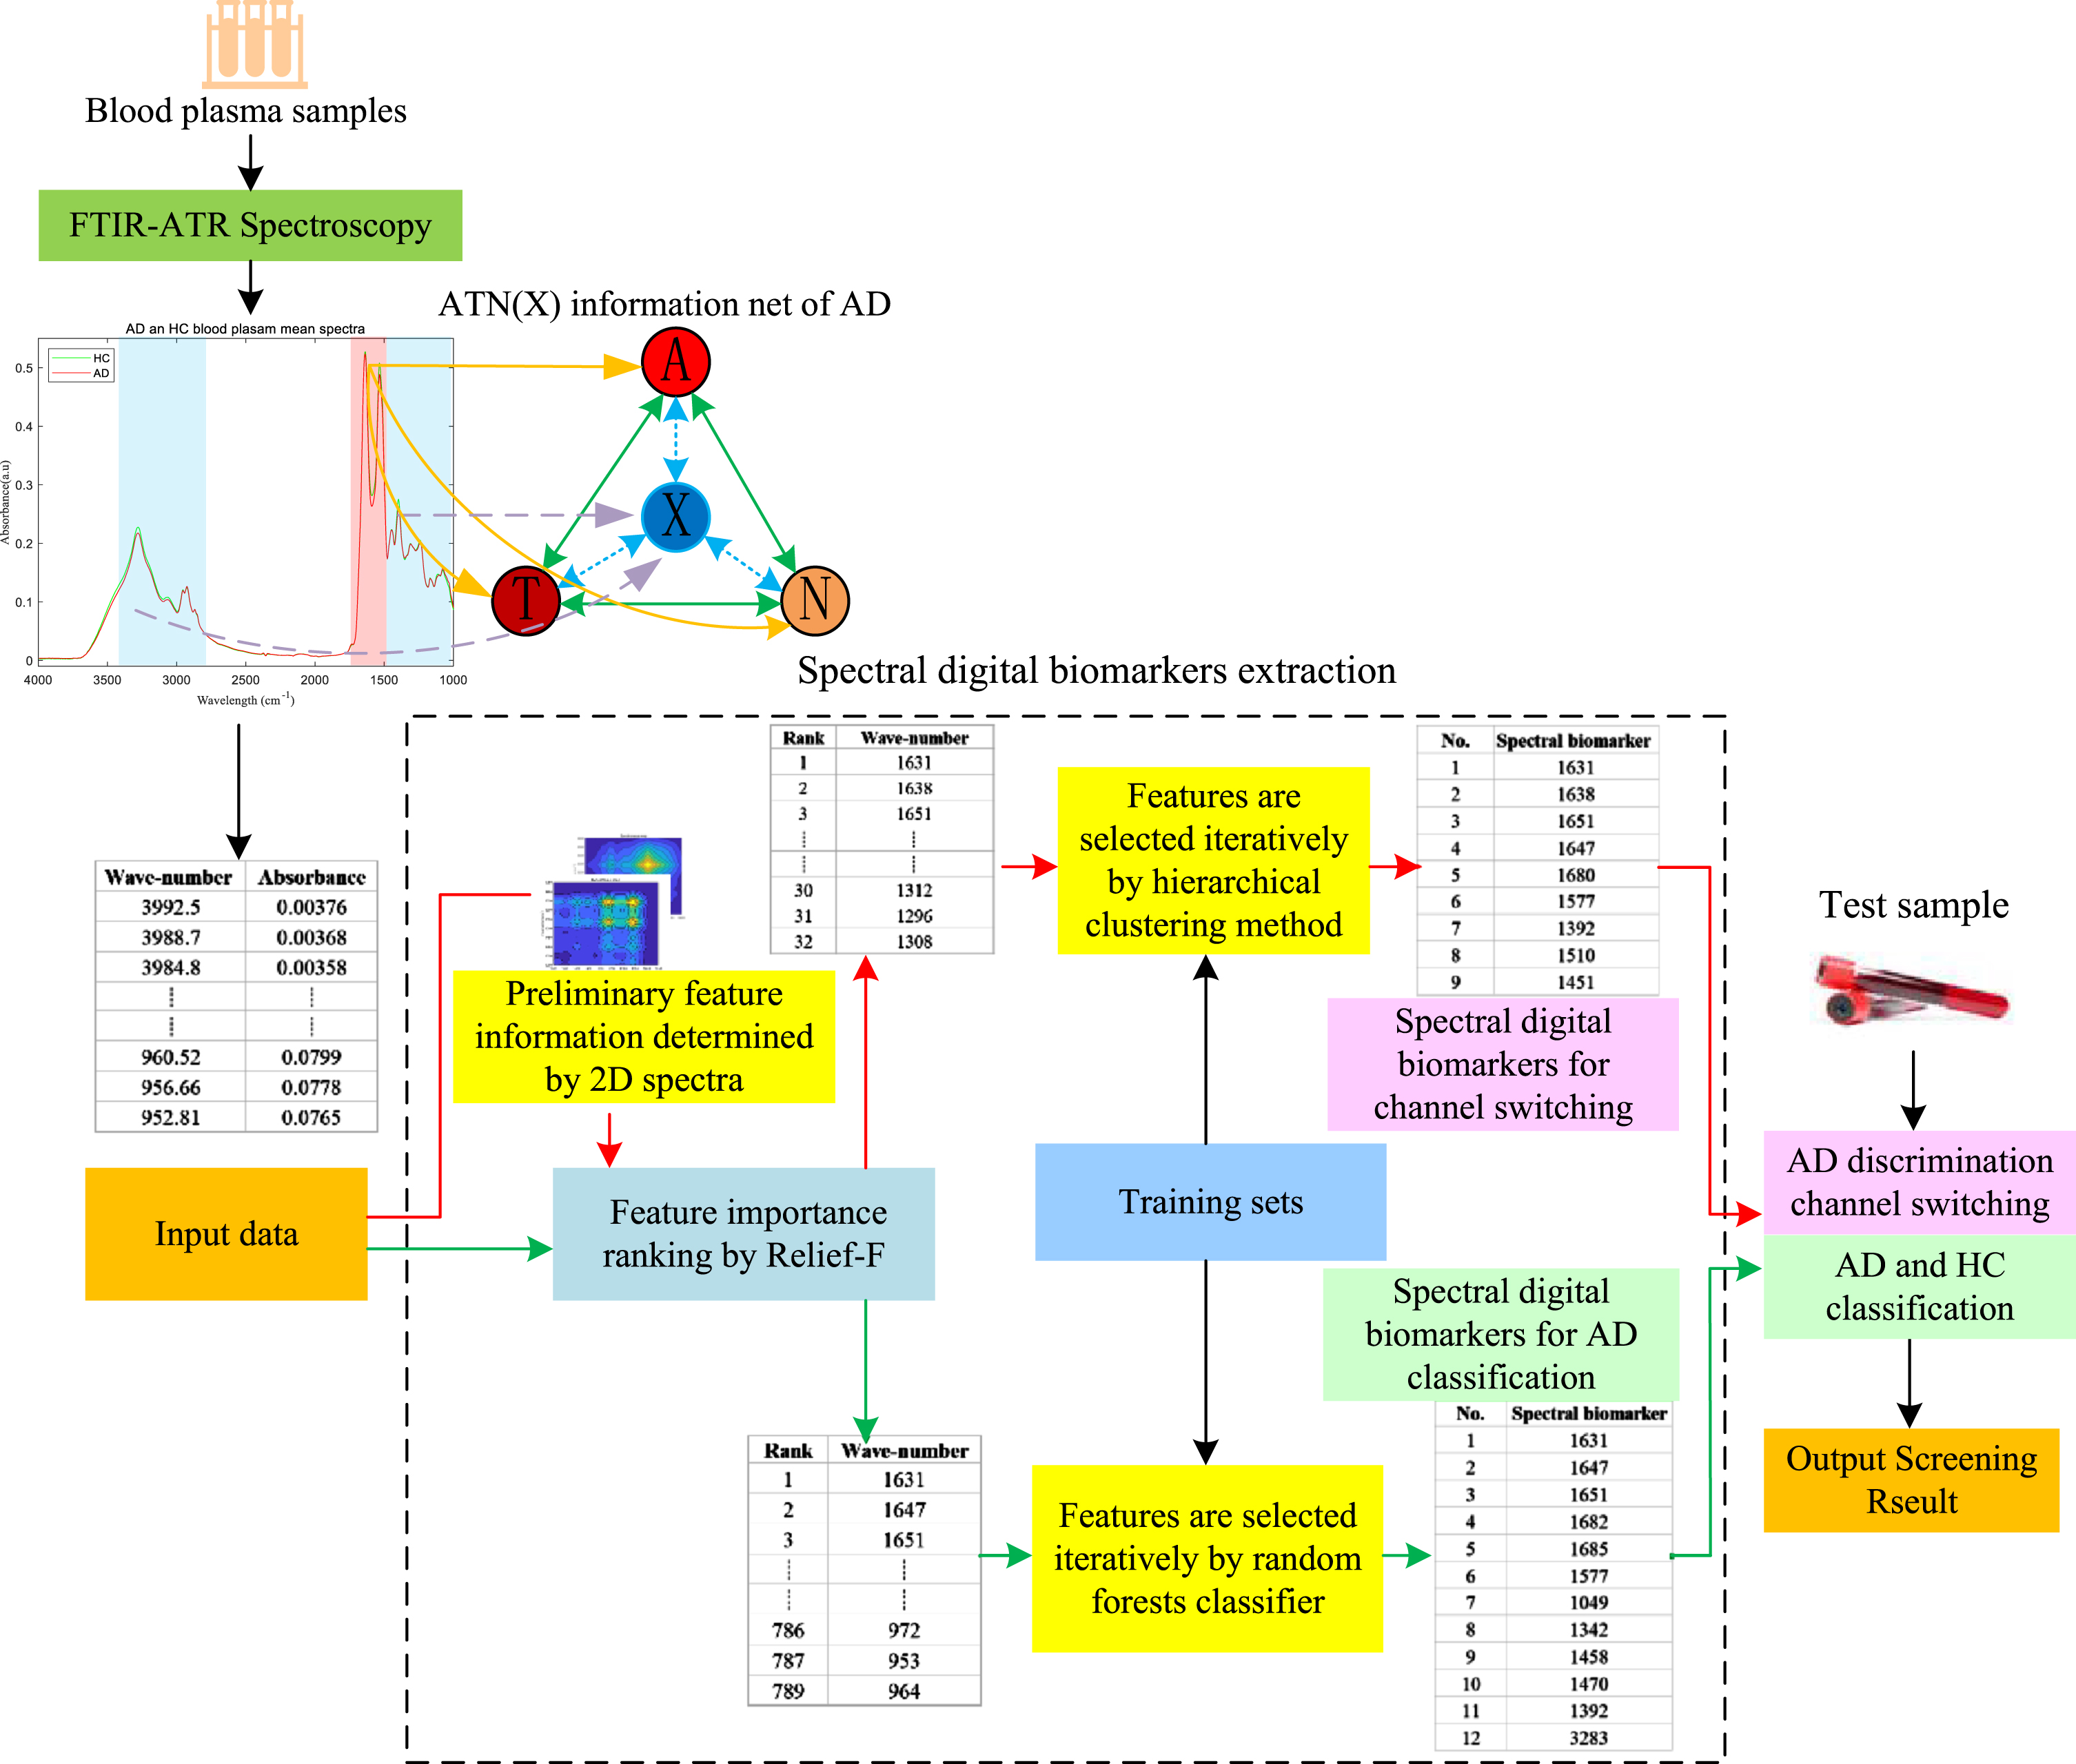
Blood-based AD discrimination process in the spectral ATN(X) information space. First, plasma samples were collected, and the spectra of the test samples were obtained. Then, the extraction of spectral biomarkers was carried out in the ATN(X) system. Finally, the discrimination of AD was completed by a hierarchical discrimination system based on the extracted spectral digital biomarkers.
Design of hierarchical discrimination system
In response to the need to improve the discrimination performance for AD, we designed a hierarchical discrimination framework (Fig. 2). The key to the hierarchical discrimination framework is that the sample of HCs was first tentatively identified as an AD patient. In this way, the discrimination between patients with different stages of AD and HCs was transformed into a simple discrimination of different stages of AD. The framework of the hierarchical discrimination system includes two levels. The first level includes both the discrimination of patients with different stages of AD and the temporary assignment of healthy control (HC) samples to different stages of AD. In essence, it is a distance-based multidiscrimination channel (ADearly, ADmiddle, and ADlate) switching mechanism. The metric distance vector between test samples to the subclass centers of different-stage AD obtained in the hierarchical clustering process is used to determine which discrimination channel the sample switches to. These vectors are constructed from peaks of spectral digital biomarkers (feature wavenumbers) corresponding to the switching mechanism. In the spectral information space, the center vectors of early, middle, and late AD are denoted as
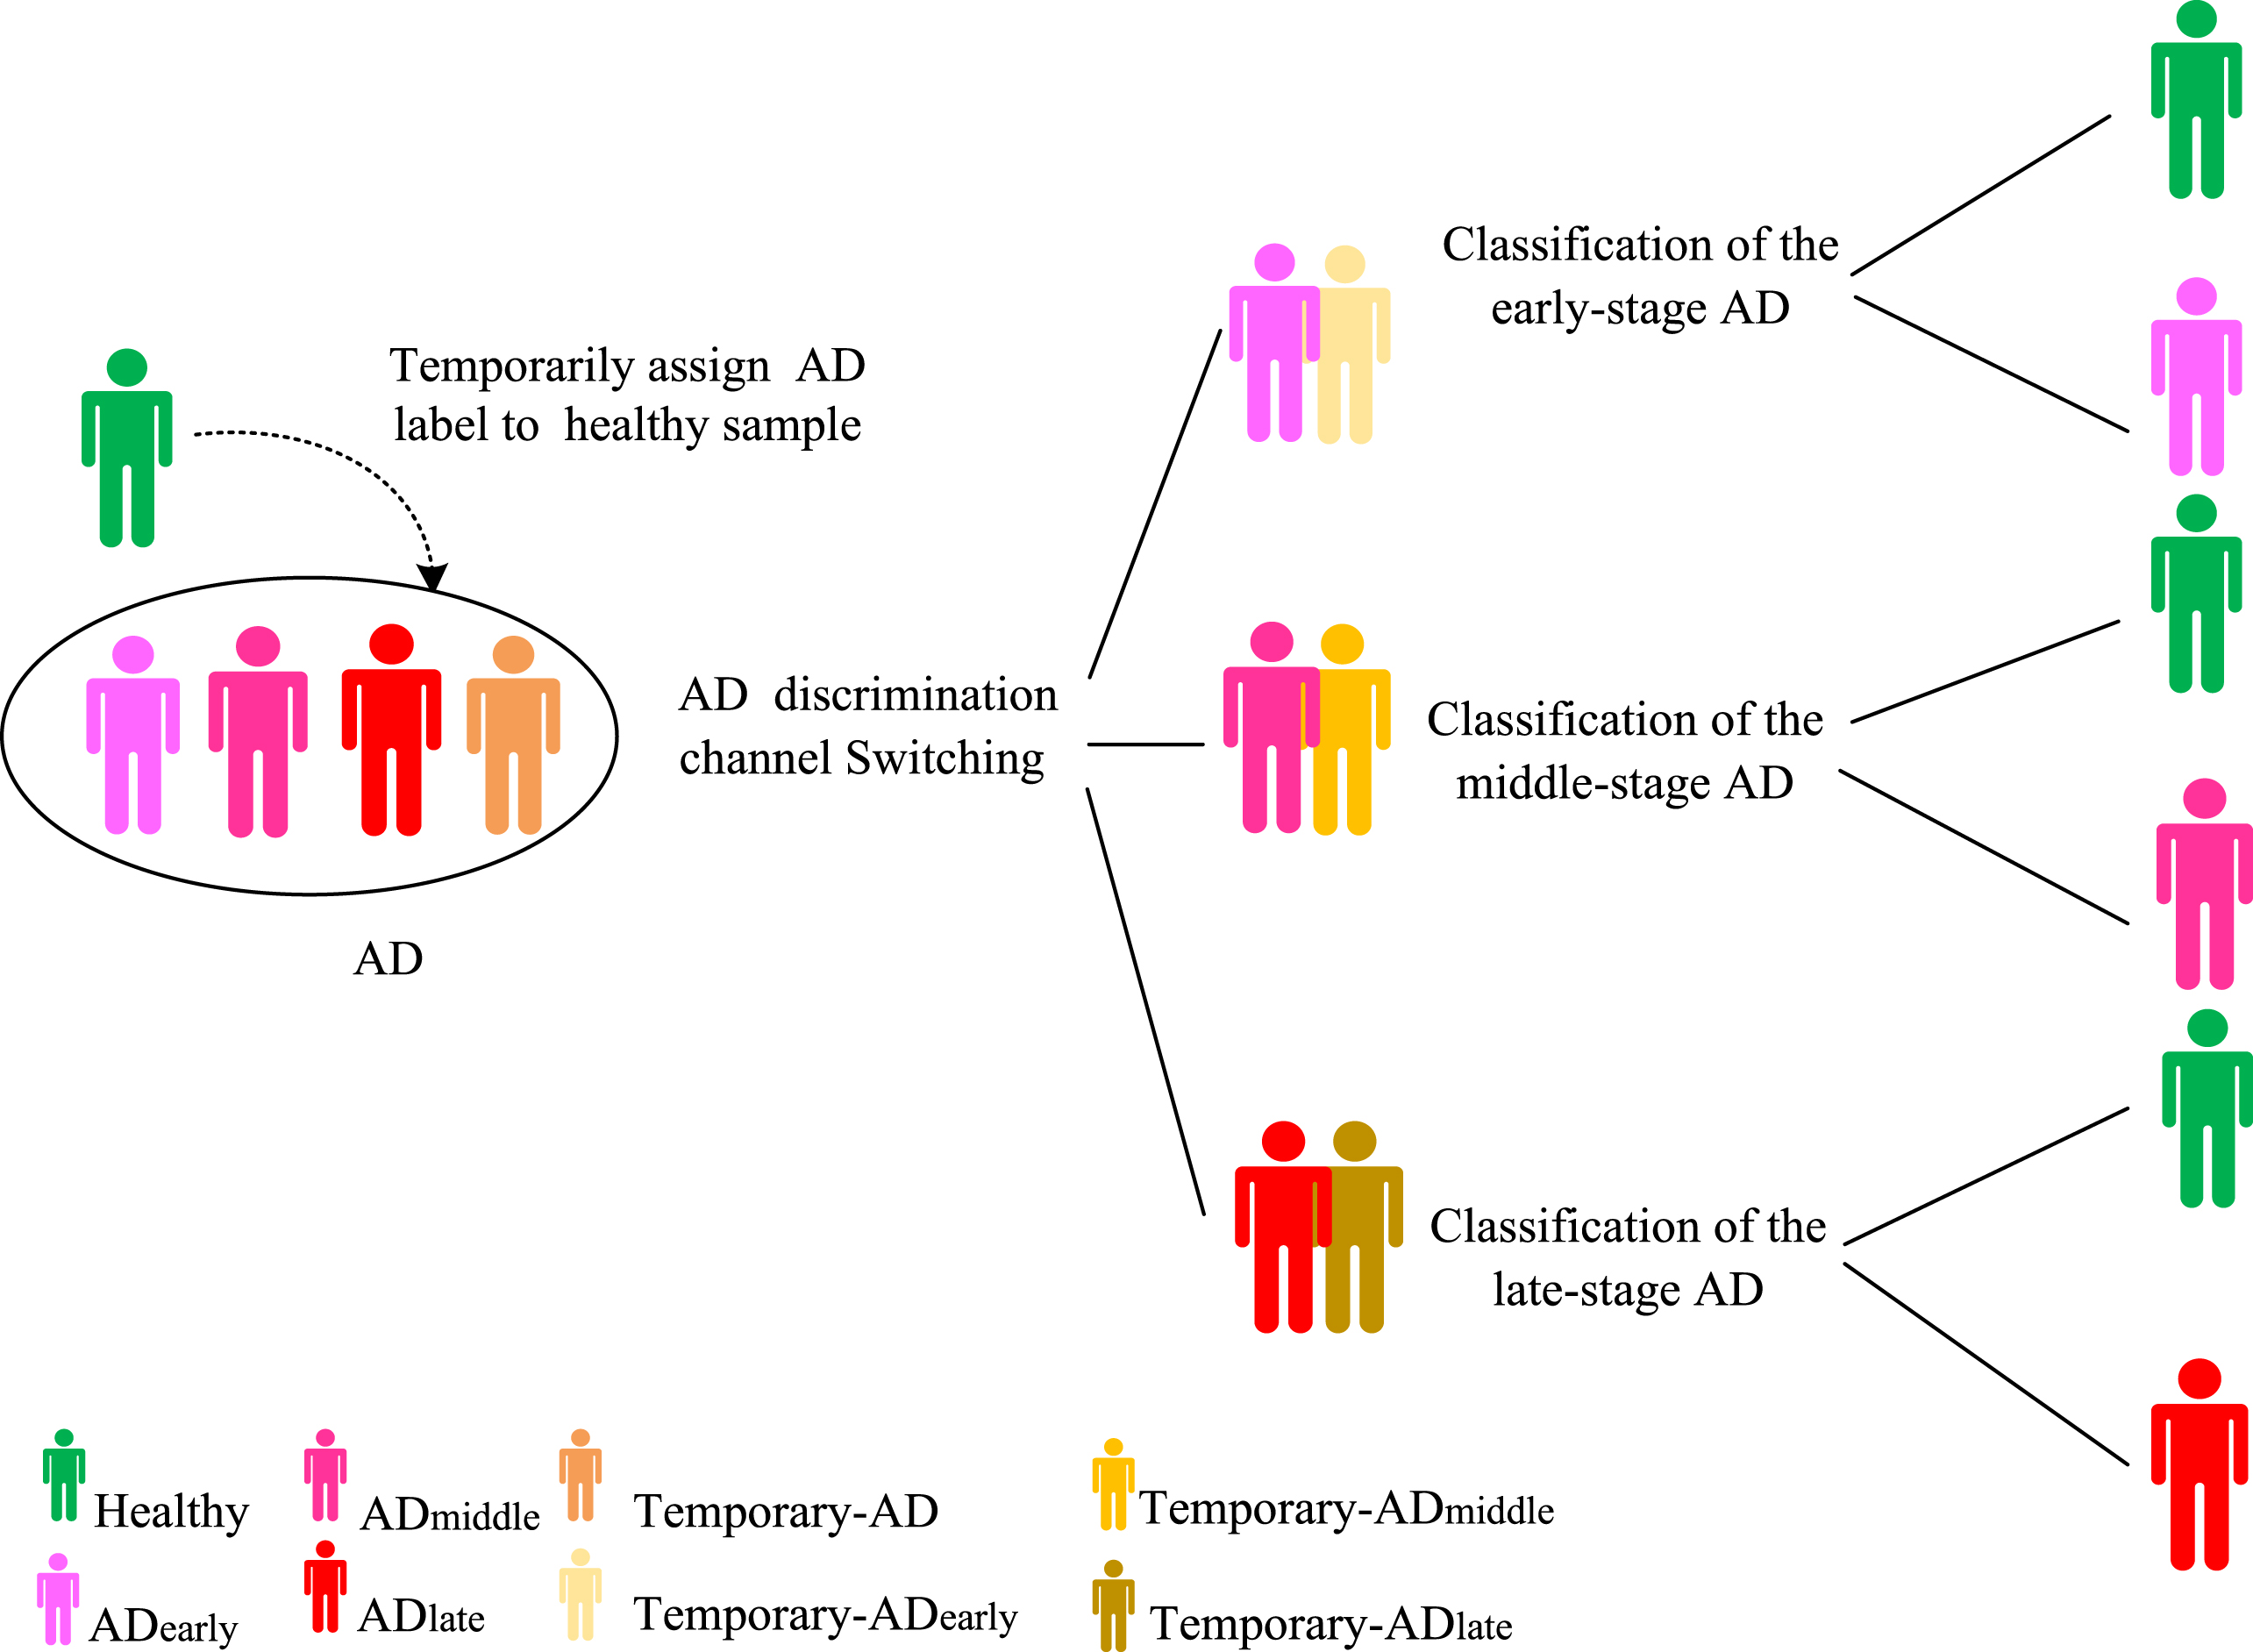
The hierarchical discrimination framework. The framework of the hierarchical discrimination system includes two levels. The first level includes both the discrimination of patients with different stages of AD and the temporary assignment of HC samples to AD with different stages. The core idea of removing the interferences caused by individual differences in HCs is to temporarily assign AD labels to healthy people in the first level and to distinguish AD from HCs in the second level through an RF-based classifier to remove the temporary AD label of healthy people.

The operation process of hierarchical discrimination. The discrimination of AD at different stages is performed based on the two-level discrimination structure of classification. The operation process of hierarchical discrimination is a data-driven discrimination channel switching mechanism.
At the second level, the random forest classifier of the respective discrimination channels determines whether the test samples are AD or HCs based on spectral digital biomarkers corresponding to disease classification. Thus, the second level can remove the temporary AD labels of HCs to achieve accurate AD discrimination. The RF classifier, a robust tree-structured machine learning algorithm, has been widely used for feature extraction and classification in medical studies [19, 20]. We trained an RF-based classifier on the training set of blood plasma spectra samples, and both processing and computational analysis were performed with MATLAB R2016a software (Mathworks). Sensitivity (recall rate) and specificity are used to evaluate discrimination performance. In addition, the receiver operating characteristic (ROC) curve is typically used to evaluate clinical utility for both diagnostic and prognostic models [21]. ROC curve and area under the curve (AUC) analyses were used to quantify how well each discrimination channel discriminated AD from HCs.
Metabolomic spectral digital biomarker detection for the discrimination of different stages of AD
Metabolomics has been used to identify biochemical pathway alterations and to be applied to biomarker discovery in neurodegenerative disorders. The information related to AD in the blood plasma is weak and complex. The overlap of plasma spectral information between AD patients with different stages and HCs is severe. An appropriate discovery strategy for spectral digital biomarkers related to AD is the key to successful discrimination between AD and HCs. Under the hierarchical discrimination framework, AD spectral digital biomarkers include both spectral digital biomarkers used to assign samples to different stages of the AD discrimination channel and spectral digital biomarkers used to classify different-stage AD and HCs. Two-dimensional correlation spectroscopy (2D-COS), the Relief-F algorithm and the hierarchical clustering method were applied to the blood plasma spectra of samples to discover these important spectral digital biomarkers.
2D-COS is very powerful for unraveling the highly complicated FTIR spectral bands of complex biological systems and can reveal more detailed spectral information changes closely related to metabolism, especially for proteins and lipids [3, 23]. In our study, synchronous 2D-COS analysis was used to determine preselected spectral regions, and the autopeaks in the 2D-COS infrared spectra represented the vibrational modes that have been perturbed by all types of factors associated with AD (Fig. 4).
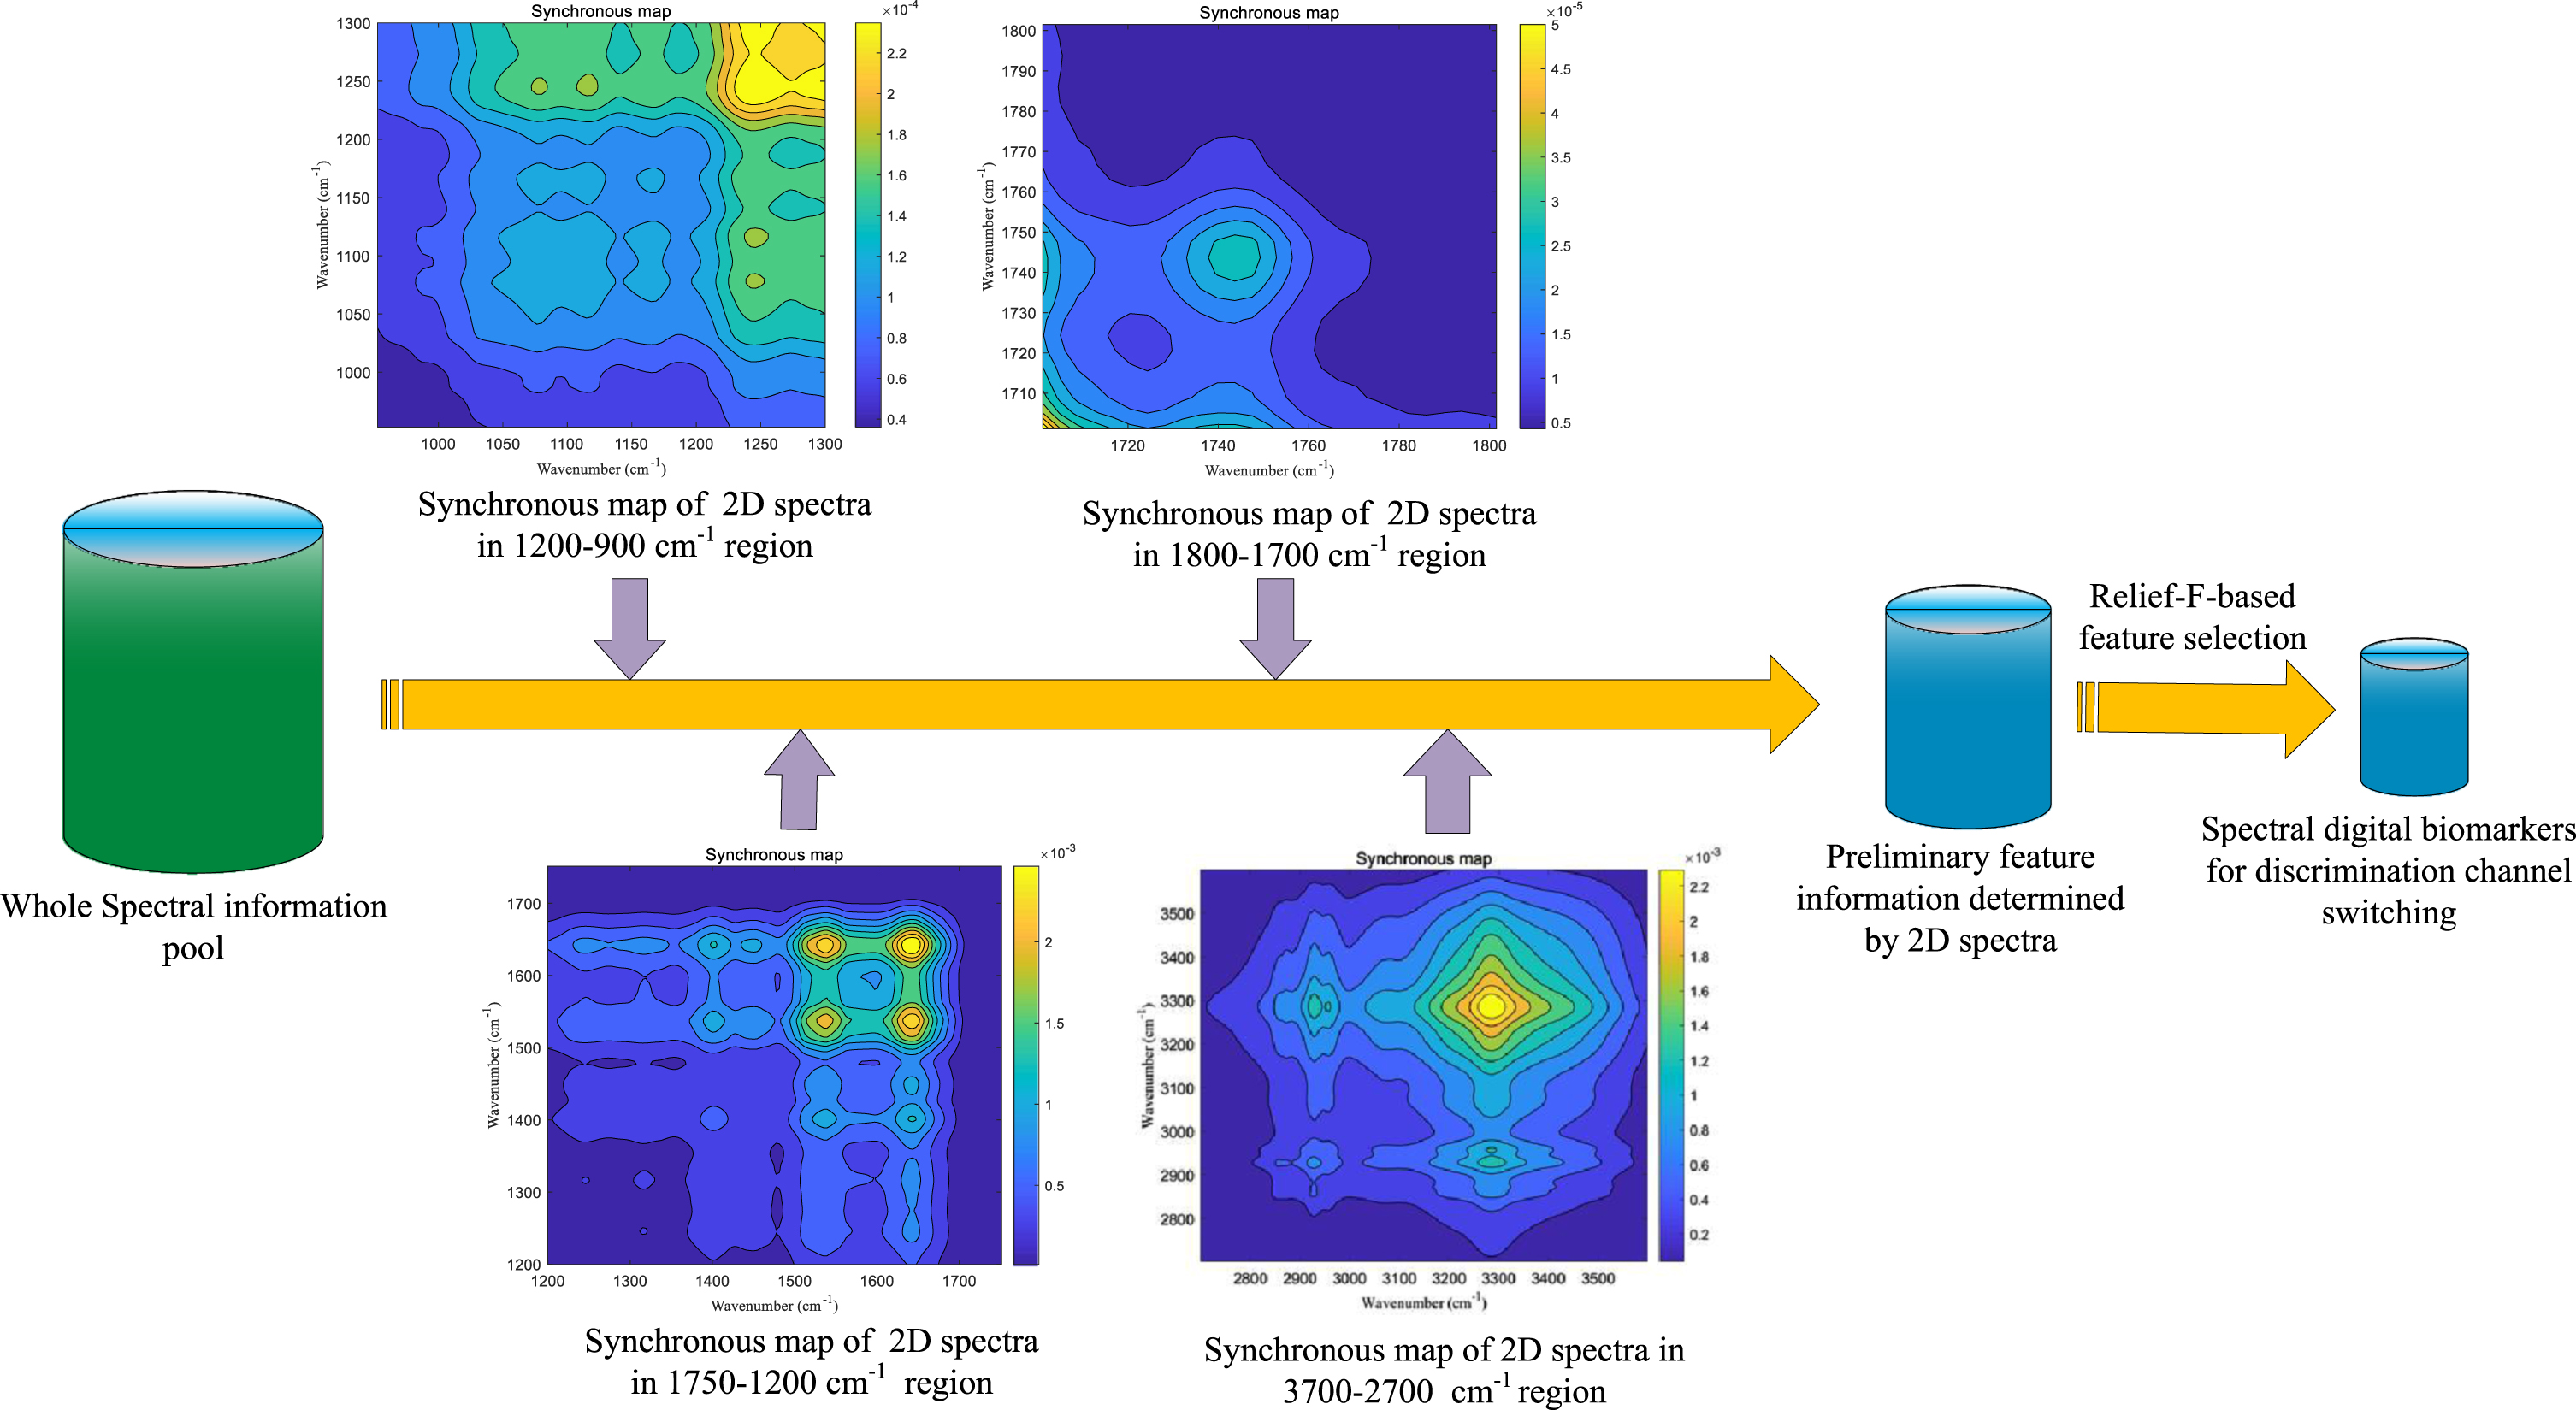
Process of extracting digital biomarkers for hierarchical discrimination system in ATN(X) spectral information space. First, synchronous 2D-COS analysis was used to determine four digital biomarker preselected spectral regions associated with AD. Then, the spectral digital biomarkers for switching between different discrimination channels were iteratively extracted by the Relief-F method based on the samples of the training set and validation set.
From the 2D-COS analysis, FTIR spectral regions are relevant for extracting important information at 3500–2700 cm-1, 1800–1700 cm-1, 1750–1200 cm-1, and 1200–900 cm-1. For 3500–2700 cm-1, there is an unbalanced content of saturated and unsaturated lipids, leading to a high potential brain damage [7]. The absorption at 1800–1700 cm-1 was mainly assigned to the stretching vibration of lipid C = O. At the range of 1750–1200 cm-1, the two amide I (1600–1700 cm-1) and amide II (1500-1560 cm-1) bands are prominent features of typical protein spectra and are associated with the presence of protein aggregates and the change in protein conformation for highly stable parallel β-sheet, which agrees with the presence of Aβ fibrils [7]. The 1200–900 cm-1 region showed the presence of lipid peroxidation products related to impairment of membranes and oxidative damage of nucleic acids [7].
Relief-F is a well-known filtered feature selection strategy created by Kononenko based on the Relief algorithm [24]. Depending on the relevance of the category, each feature is given a weight that represents its contribution to the classification of instances. A feature whose weight is less than a certain threshold will be deleted. The hierarchical clustering method can divide samples into several groups such that samples in the same groups are more similar to other samples in other groups and has shown success in the detection and diagnosis of different diseases [25].
In the discrimination process, to eliminate redundancy and interference, the stronger autopeaks in the entire spectral range were selected as a preselected feature region of spectral digital biomarkers used for AD discrimination channel switching. The extraction process is as follows: Define and compute the 2D-COS spectra of the AD training set; Select the features (wavenumbers) corresponding to the autopeaks as preliminary feature information; Compute feature importance in the preselection range by Relief-F; Sort by feature importance index in descending order; According to the ranked feature importance, iteratively extract the features as spectral digital biomarkers of AD discrimination channel switching by a hierarchical clustering approach until the clustering results of different stages of AD are consistent with the classification labels of the AD training set.
The discovery of classification spectra digital biomarkers has a similar process. The feature variable (wavenumber) importance used to distinguish AD from HCs was first ranked by the Relief-F technique in the blood plasma spectral ATN(X) full information space. Then, according to the ranked feature importance, the spectral digital biomarkers used to discriminate between different-stage AD and HCs were iteratively extracted among all the feature variables by the random forest algorithm until the discrimination results met the preset index values of the discrimination system.
RESULTS
Spectral digital biomarkers and biochemical connection
FTIR spectra of blood plasma provide a snapshot of metabolism and a unique fingerprint of each sample based on overall biochemical composition, thus enabling AD discrimination. It has been shown that FTIR spectroscopy has the ability to discriminate AD patients from healthy individuals by principal component analysis, and the conformation-sensitive amide remains the most intense absorption of Aβ in plaques [7, 11]. The spectral digital biomarkers discovered in the fingerprint region indicate the presence of protein aggregates and the change in protein conformation for parallel β-sheet proteins in the central nervous system for AD with characteristic misfolding protein pathology, which agrees with the presence of plaques (Aβ fibrils) [26–29]. The type and content of protein secondary structure significantly influence the intensity and shape of spectral bands. In our research, the AD group showed a slightly lower mean absorbance intensity than HC group. Meanwhile, the presence of carboxylic acids is also observed in the amide I and amide II region bands and is commonly associated with protein structural and functional disturbances in the neurodegenerative process [7, 23]. The amide II band (1600–1500 cm-1, N-H bending and C-N stretching vibrations of peptide backbone) also provides valuable structural information and is suggested for secondary structure prediction as a counterpart of amide I [27]. Therefore, the fingerprint region containing amides I and amides II corresponding to the stronger autopeaks of synchronous 2D-COS located in the range of 1720–1480 cm-1 are prominent features of a typical protein spectrum, providing the most insight into protein secondary structure [28–30]. In addition, the spectral digital biomarkers come from the stronger autopeaks of 2D-COS located in the range of 1200–900 cm-1 are associated with oxidative cellular damage in disease samples. Many direct and indirect observations suggest that oxidative stress is involved in the development of AD and have shown increased levels of oxidative markers of biomolecules in the AD brain and peripheral systems [30]. Other spectral digital biomarkers from the region of 3500–2700 cm-1 are associated with an unbalanced content of saturated and unsaturated lipids that can lead to high potential brain damage [7]. All discovered spectral digital biomarkers in our research have a direct biochemical connection to AD, and their biochemical assignments are key as potential markers (Table 3).
These spectral digital biomarkers were directly extracted by Relief-F sorting and RF training for the discrimination of different-stage AD and HCs. Overall, the biomolecules associated with the spectral digital biomarkers that we identified are in line with the findings of previous studies and have been described as potential biomarkers [7–11]. One of the major differences between the different aggregated forms of amyloid proteins is their secondary structure (antiparallel β-sheets for oligomers and parallel β-sheets for fibrils), which is related to their respective cytotoxicity [31–34]. The deposits found in AD are composed of Aβ fibrillar aggregates rich in β-sheet structure and several biomarker studies have shown that Aβ-aggregates are rich in β-sheets [34, 35]. In addition, it is remarkable that the development of a cross β-sheet arrangement with subsequent fibril formation occurs following an Aβ conformational change, in which the peptide partially loses its random coil or α-helical native structure in favor of a β-sheet secondary structure [36]. For FTIR spectra, the frequency of the amide I band is particularly sensitive to secondary structure based on different hydrogen-bonding environments for α-helix, β-sheet, turn, and unordered conformations and is frequently used to study the process of protein misfolding and aggregation [37]. In line with the above conclusions, some spectral digital biomarkers are associated with β-sheet structures that define aggregates in a fibrillar or oligomeric state, some spectral digital biomarkers are associated with α-helices, which are capable of triggering the formation of aberrant tau protein aggregates [38], and the rest are related to β-turns or random coils or membrane lipids, which are also factors related to AD protein deposition.
Discrimination of different AD stages and HCs
Based on blood-based vibrational spectra, we conducted AD discrimination comparative experiments between the hierarchical discrimination system and the flat multiclassification discrimination method. For the AD discrimination experimental results of the hierarchical discrimination system (Table 4), the sensitivity and specificity of early-stage AD discrimination in the test set were 89.3% and 85.7%, respectively, indicating the potential to detect both early AD patients and healthy controls effectively; the sensitivity and specificity of middle-stage AD discrimination in the test set were 92.8% and 87.5%, respectively. Late-stage AD was segregated from HCs in the test set with 100% sensitivity and 100% specificity.
The experimental results of the hierarchical discrimination system
The comparison discrimination experiment results (Fig. 5A) also indicate that the recall rate of each subclass discrimination in the hierarchical discrimination system also has a significant advantage. Specifically, the sample distributions of actual stages and discrimination stages provides information that can directly and in detail reflect the performance of the discrimination methods (Table 5).
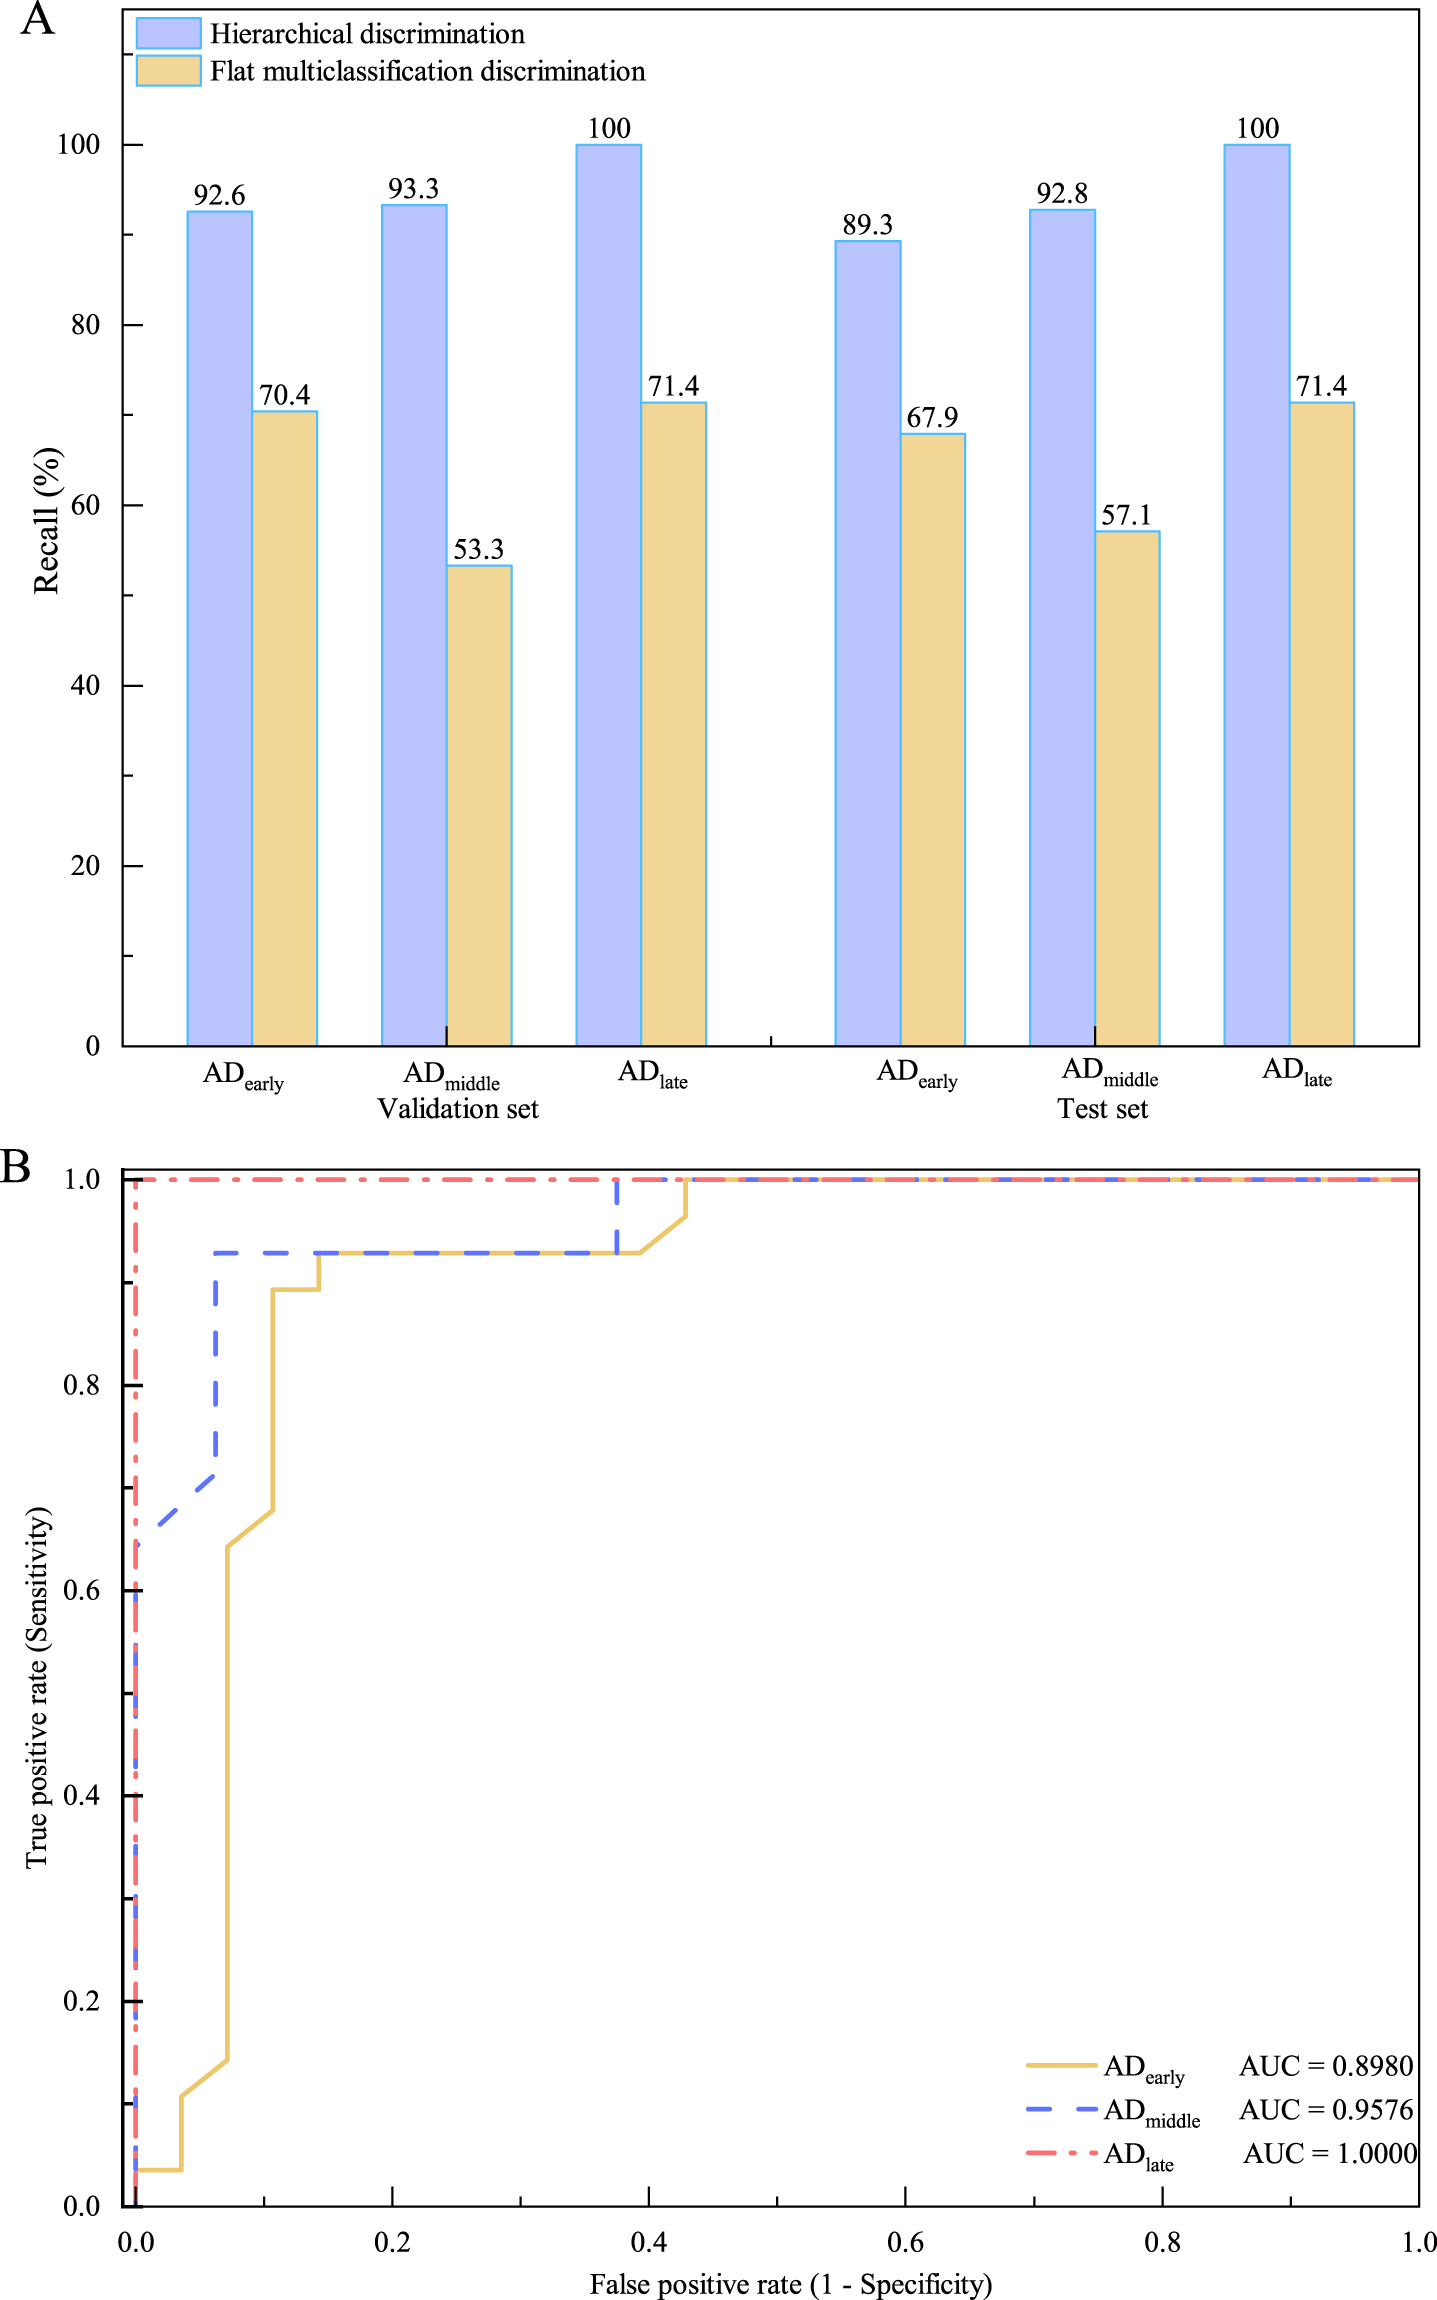
The experimental results of AD discrimination. A) Recall rate comparison of AD discrimination in the validation set and test set. The hierarchical discrimination for AD with different stages has higher recall rates than the flat multiclassification discrimination. B) ROC curve of the AD discrimination system. Generally, if ROC = 0.5, it suggests no discriminatory power; if 0.70≤ROC < 0.80, it stands for acceptable discriminatory power; if 0.80≤ROC < 0.90, it is considered excellent discriminatory power; and if ROC≥0.90, it is considered outstanding discriminatory power.
Sample distribution of actual stages and discrimination stages
① Numbers of training set, validation set and testing set represents the number of sample in different discrimination stages; ② Numbers in parentheses indicate the number of sample in actual stages.
The data show that the hierarchical discrimination system has significant advantages over flat multiclassification discrimination. Compared with the discrimination method based on flat multiclassification, apart from the classification error, the hierarchical discrimination system increases the switching error of discrimination channels. However, the total error of the hierarchical discrimination system still remains much smaller than that of the flat multiclassification discrimination. Furthermore, the ROC curves were used to analyze the test performance, and the AD hierarchical discrimination system was considered to have outstanding discriminatory power (Fig. 5B). In summary, sensitivity, specificity and AUC all prove that a reagent-free discrimination method for AD using blood plasma spectral digital biomarkers and machine learning can significantly improve the discrimination performance and meet the indicators of clinical application.
DISCUSSION
For biomarkers, because a variety of pathogeneses and pathological changes occur in AD, individual biomarkers have a common disadvantage, that is, they are usually not specific to AD. The joint evaluation of multiple biomarkers can compensate for this defect [18]. However, blood-based biomarker tests require expensive antibodies or assays. For instance, the cost of ELISA with three kits to quantify Aβ, T-tau, and P-tau, three core biomarkers of AD, is approximately $1,000 [10, 39]. Moreover, there is still a relative paucity of blood-based biomarkers to reflect the complexity of AD pathologies [40]. In fact, the discerning ability of FTIR is such that biomarker research can be extended to small molecule metabolites. In other words, spectral digital biomarkers focus on revealing the structure and chemical composition of biological samples at the molecular level. Instead of evaluating morphological differences as in current histopathology methods, FTIR is an exquisite technique to allow an almost continuous structural view of protein/peptide conversion during the aggregation process [31]. Blood plasma FTIR spectra-based discrimination approaches simultaneously utilize all molecular structure and chemical composition information associated with disease instead of using isolated molecules as in conventional molecular ELISA tests, enabling the utilization of all sensitive spectral biomarkers of the pathology to improve the discrimination level of complex diseases and reduce cost [13]. Although individual identifying discriminatory peaks may be nonspecific for AD, similar to a combined use of ‘omics’-like technologies, different spectral digital biomarkers formed a specific fingerprint for discriminating AD in our research. Thus, low-cost and reliable joint evaluation of multiple AD biomarkers can be accomplished by a unique fingerprint composed of spectral digital biomarkers. The study of discrimination AD using blood plasma vibrational spectroscopy has proven that 2DCOS has the ability to extract spectral biomarkers of AD in infrared regions of 1700–1600 cm–1 (protein secondary structure) and 1150–1000 cm–1 (oxidative stress) [3]. These two ranges are basically in line with our research results. Furthermore, the oligomer-to-fibril transition was also depicted using ATR-FTIR in recent Aβ studies and demonstrated that the misfolding process for wild-type Aβ42 and Aβ40 peptides is supported by β-sheet reorganization [34]. From a structural perspective, at the early stages of aggregation, the amide I region in FTIR spectra is characterized by Aβ42 and Aβ40 peptides appears as the 1630 and 1695 cm–1 bands reported for antiparallel β-sheet organization. When fibril formation takes place, the peak 1695 cm–1 disappears, resulting in only one β-sheet contribution at approximately 1630 cm–1, assigned to a parallel β-sheet structure [31]. In our study, the intensities of absorption peaks in the spectral range (4000–900 cm-1) show a sustained downward trend with increasing severity of AD (Fig. 6). The decrease in the intensity in amide I region (1650–1630 cm–1) could presumably be caused by decreasing levels of plasma Aβ 42 [41]. The 1578 cm-1 band may represent structural changes in lipids [9]. The significant decrease in the area value of the amide A peak and amide B peak suggests an alteration in the protein profile and lipid levels because of disruption of phospholipid cell membranes and free radicals [10]. The decrease in lipids (1750–1735 cm–1 to 1470–1430 cm–1), between AD patients and HCs could be attributed to damaged cell membranes caused by increased free radicals, implicated in the pathogenesis of AD [42]. Overall, some spectral digital biomarkers that we identified have been previously described as potential biomarkers of AD [7–11]. Other spectral digital biomarkers of AD in our research and their relationships require further research under the ATN(X) framework in the future.
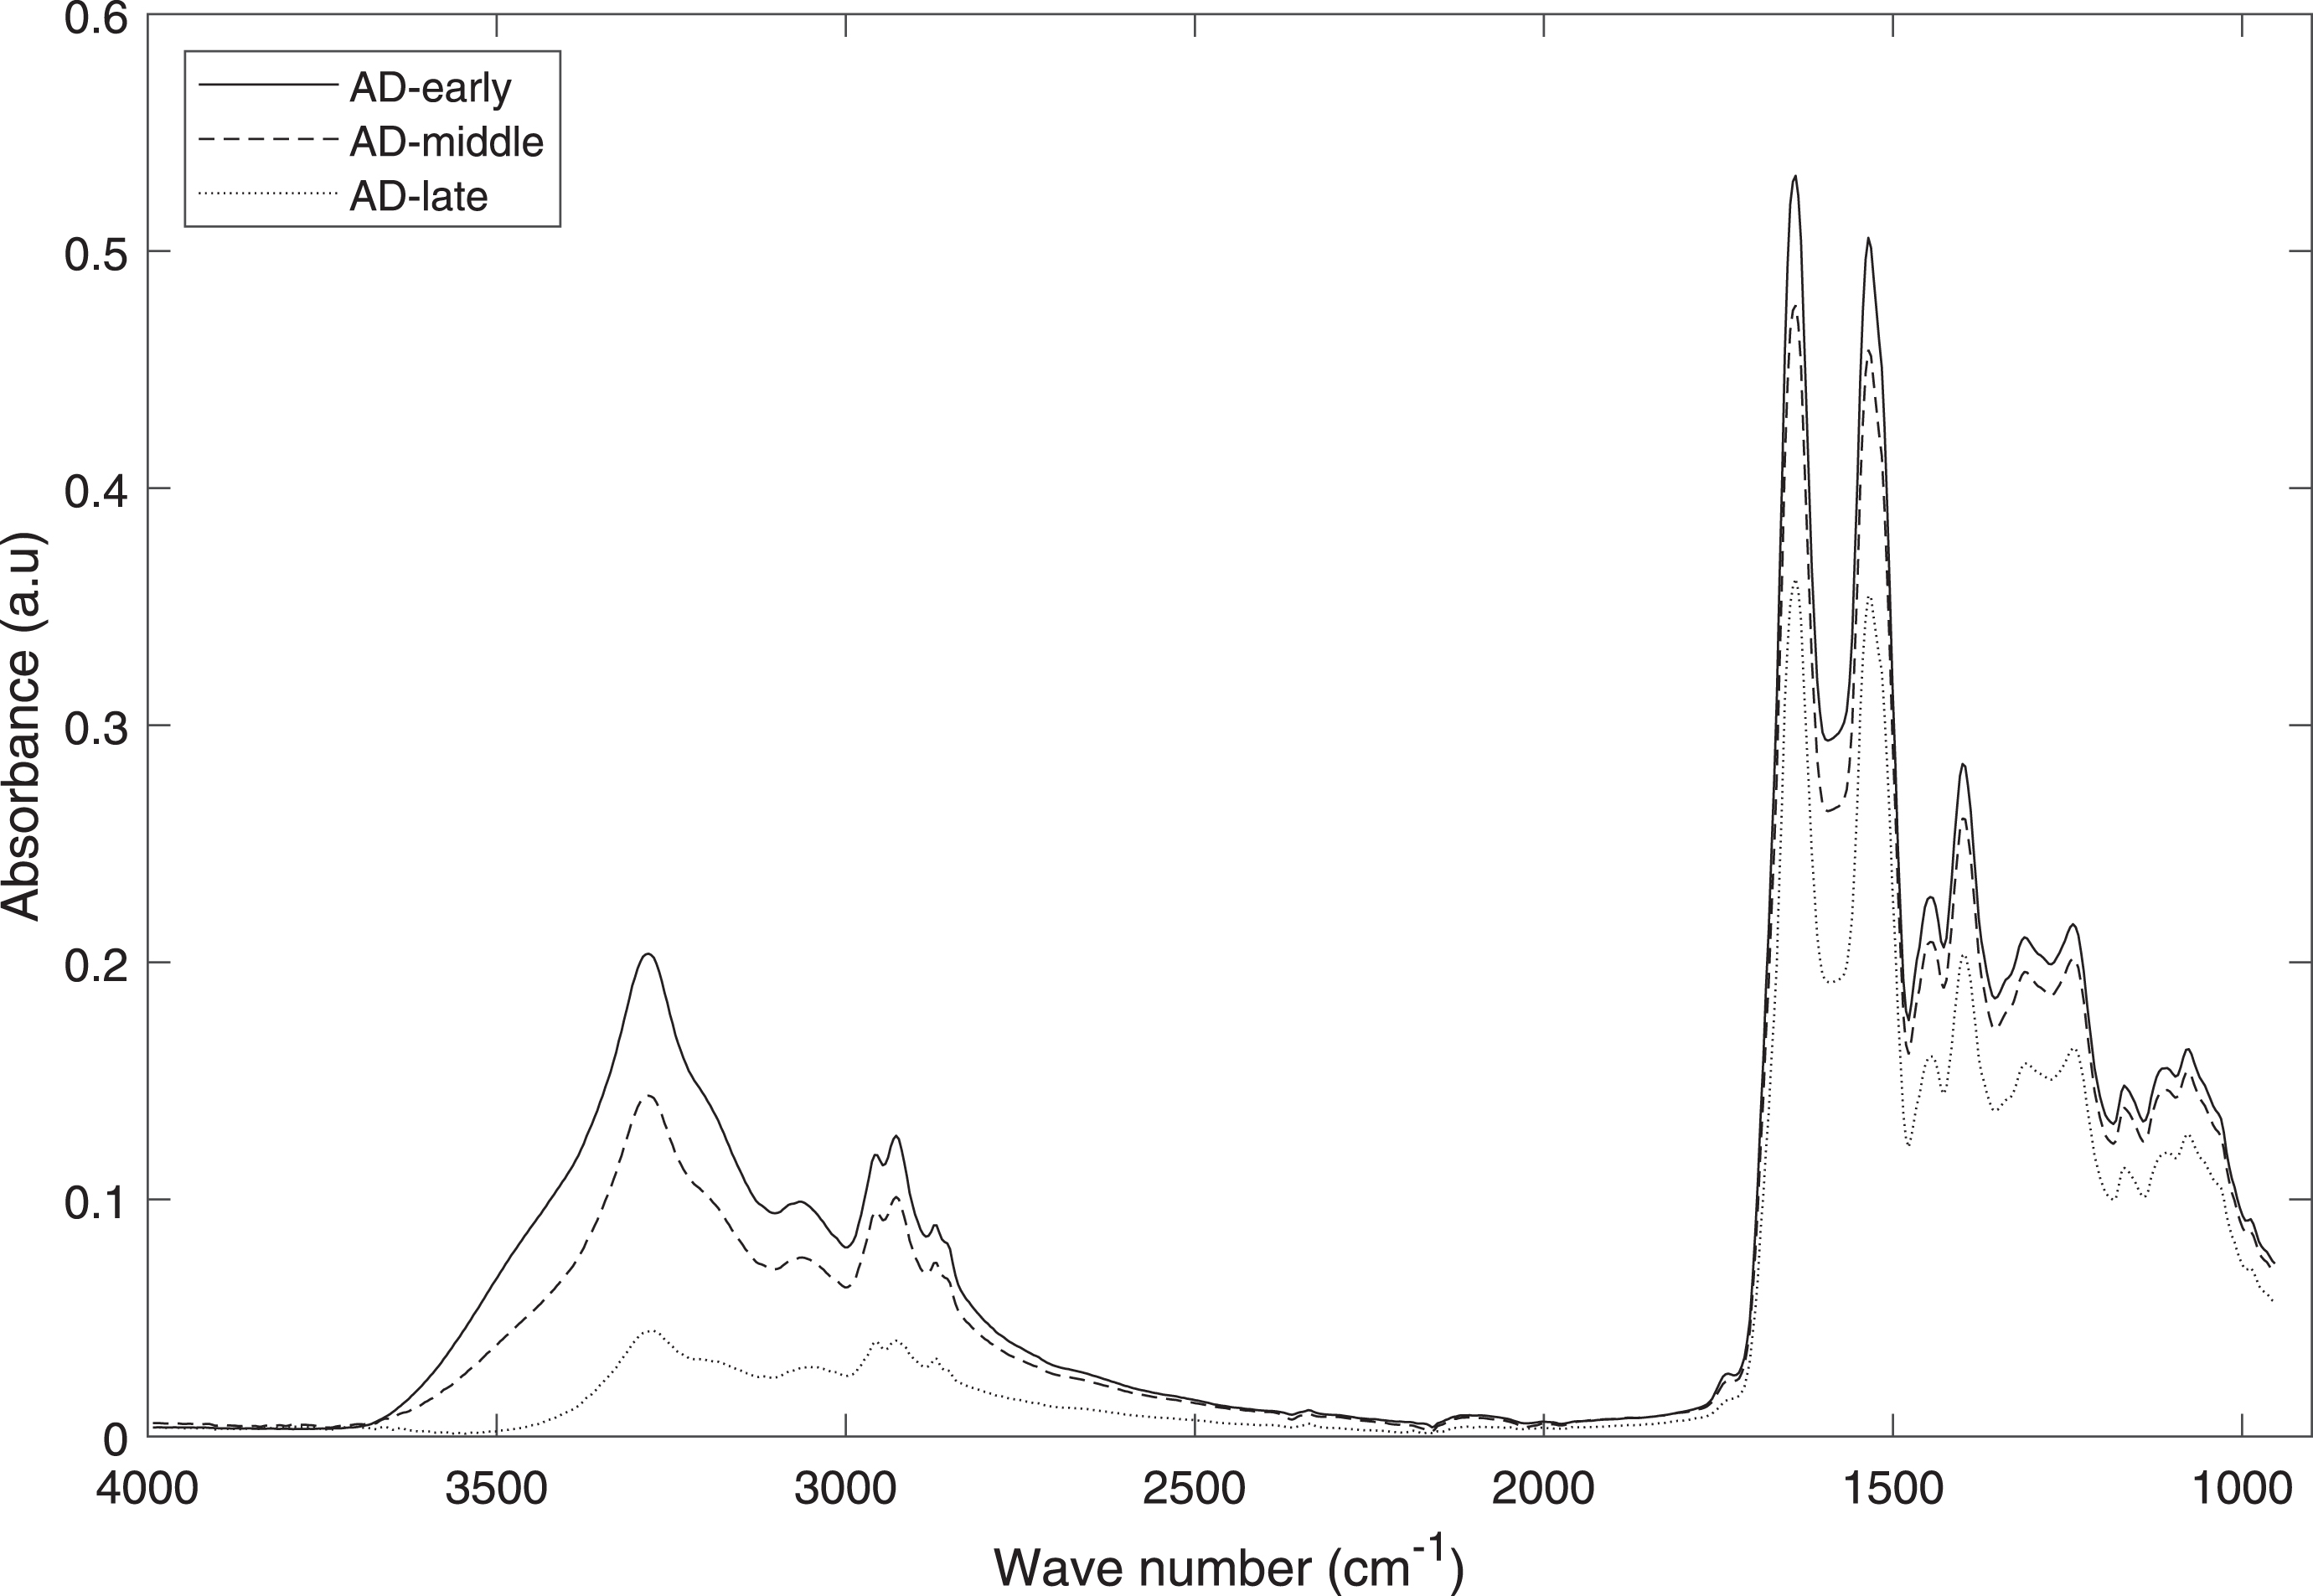
Mean spectra of AD with different stages. As AD progresses, the intensities of the absorption peaks in the spectral range (4000–900 cm-1) show a sustained downward trend.
For the flat multiclassification discrimination method, because of the interference simultaneously caused by early-stage AD, late-stage AD and HCs, the spectral digital biomarkers of mid-stage AD are the most difficult to discover, and the recall rate is lowest in middle-stage AD. The hierarchical discrimination system can eliminate the interferences caused by individual differences in HC samples and hierarchically match the HC samples with different-stage AD subclasses. Meanwhile, a multimodel channel switching mechanism of the hierarchical discrimination system also effectively removes the interferences between different-stage AD. For the above reasons, more accurate spectral digital biomarkers of different-stage AD can be discovered.
In summary, the experimental results prove that the AD discrimination system based on spectral digital biomarkers and a hierarchical framework can effectively discriminate patients with different stages of AD from HCs. The hierarchical AD discrimination system can serve as a rapid powerful AD discrimination tool with high sensitivity and specificity. We believe that the potential metabolites identified as spectral digital biomarkers could be taken forward in clinical research on AD and may show utility as new biomarkers for clinical chemistry research after being validated in a larger population of patients and healthy volunteers. The clinical application of spectral digital biomarkers and machine learning is expected to be first realized in the field of discrimination or diagnosis of neurodegenerative diseases.
Footnotes
ACKNOWLEDGMENTS
We wish to thank all the patients and caregivers who took part in this study. We also would like to thank all clinicians working at the participating memory clinics for their efforts in referring participants and Karlijn Visser in her assistance in recruitment and data acquisition.
FUNDING
This work was supported in part by Tianjin Science and Technology Plan Project, Grant/Award Numbers: 22ZYCGSY00840; Tianjin Health Research Project, Grant/Award Numbers:ZC20121 and TJWJ2023QN060; National Natural Science Foundation of China, Grant/Award Number: 61601104 and 82171182; Tianjin Key Medical Discipline (Specialty) Construction Project, Grant/Award Number: TJYXZDXK-052B; Hebei natural Science Foundation Grant Number: F2020501040; Fundamental Research Funds for the Central Universities, Grant/Award Number: N2023021.
CONFLICT OF INTEREST
Yong Ji is an Editorial Board Member of this journal but was not involved in the peer-review process nor had access to any information regarding its peer-review.
All other authors have no conflict of interest to report.
DATA AVAILABILITY
The data supporting the findings of this study are available on request from the corresponding author. The data are not publicly available due to privacy or ethical restrictions.