
Abstract
Background:
Alzheimer’s disease (AD) is the leading cause of dementia, with its prevalence increasing as the global population ages. AD is a multifactorial and intricate neurodegenerative disease with pathological changes varying from person to person. Because the mechanism of AD is highly controversial, effective treatments remain a distant prospect. Currently, one of the most promising hypotheses posits mitochondrial dysfunction as an early event in AD diagnosis and a potential therapeutic target.
Objective:
Here, we adopted a systems medicine strategy to explore the mitochondria-related mechanisms of AD. Then, its implications for discovering nutrients combatting the disease were demonstrated.
Methods:
We employed conditional mutual information (CMI) to construct AD gene dependency networks. Furthermore, the GeneRank algorithm was applied to prioritize the gene importance of AD patients and identify potential anti-AD nutrients targeting crucial genes.
Results:
The results suggested that two highly interconnected networks of mitochondrial ribosomal proteins (MRPs) play an important role in the regulation of AD pathology. The close association between mitochondrial ribosome dysfunction and AD was identified. Additionally, we proposed seven nutrients with potential preventive and ameliorative effects on AD, five of which have been supported by experimental reports.
Conclusions:
Our study explored the important regulatory role of MRP genes in AD, which has significant implications for AD prevention and treatment.
INTRODUCTION
Alzheimer’s disease (AD) is considered one of the most common causes of dementia [1], with hallmark pathological features including amyloid plaques containing amyloid-β (Aβ) and neurofibrillary tangles composed of hyperphosphorylated tau proteins. Neuroimaging often reveals temporal and medial parietal cortices accompanied by brain atrophy, and reduced glucose utilization typically manifests in in the posterior regions of the brain in the early stages [2]. The current diagnostic criteria for AD, proposed by the National Institute on Aging and Alzheimer’s Association (NIA-AA), rely on the observation of pathological markers during life or after death [3]. A recent statistic shows that current AD drug development is focused on the targets of inflammation, amyloid, neurotransmitter receptors, synaptic plasticity, tau pathology, oxidative and protein homeostasis/protein lesions [4]. However, the safety and efficacy of these therapies remain controversial [5]. In recent years, it has become apparent that some changes in the aging process, such as increased use of medications, decreased appetite, and impaired nutrient absorption, can prevent older adults from meeting their nutritional requirements. This ultimately leads to malnutrition, which increases the risk of frailty and reduces the quality of life [6]. Therefore, attention has been paid to the therapeutic effects of nutrients in AD, thus reducing the side effects of conventional medications. Recent studies have highlighted the importance of improving the intake of certain nutrients to slow the progression of non-communicable diseases, including dementia [7]. For example, recent studies have shown for the first time that vitamin D receptor can regulate mitochondrial DNA transcription. In the human brain, it can interact with mitochondrial transcription factor A, demonstrating its important role in energy metabolism [8].
The slow progress in drug development for traditional targets prompted new perspectives to explore the pathogenesis of AD. Mitochondria are maternally inherited organelles with the primary role of energy metabolism and signaling programmed cell death through second messengers [9]. The mitochondrial theory of aging suggests that aging-associated accumulation of mitochondrial oxidative damage and decreased repair efficiency lead to deficiencies in cellular bioenergetics [10]. Recently, researchers have identified mitochondrial dysfunction as a major deficiency contributing to the pathophysiology of AD, referring to it as the “mitochondrial cascade hypothesis” [2]. Our previous work further supports this theory by uncovering important mitochondrion-associated genes involved in AD pathological processes from a systems genetics perspective [11].
However, the mechanism of mitochondria in AD pathogenesis remains largely unknown. Gene dependency is a common phenomenon in biological processes. For example, the activity of many transcription factors that regulate their targets is dependent on other regulators. Therefore, identifying gene dependencies following phenotypic changes can provide a better understanding of the biological regulatory mechanisms of phenotypes. To address this issue, several methods have been proposed to construct Gene Regulatory Network (GRN) based on gene expression data. However, these GRNs can only represent static regulatory relationships and cannot identify gene dependencies based on phenotypic changes, which are crucial for us to investigate the biological mechanisms behind a specific phenotype/disease [12]. In our previous work, we proposed a regulatory network construction method that can reveal the gene dependence during phenotypic changes. This strategy has been successfully applied in breast cancer precision medicine [13, 14]. In this study, transcriptomic data from AD patients and controls were used to construct gene dependency networks for dissecting the mitochondrial related mechanisms in AD.
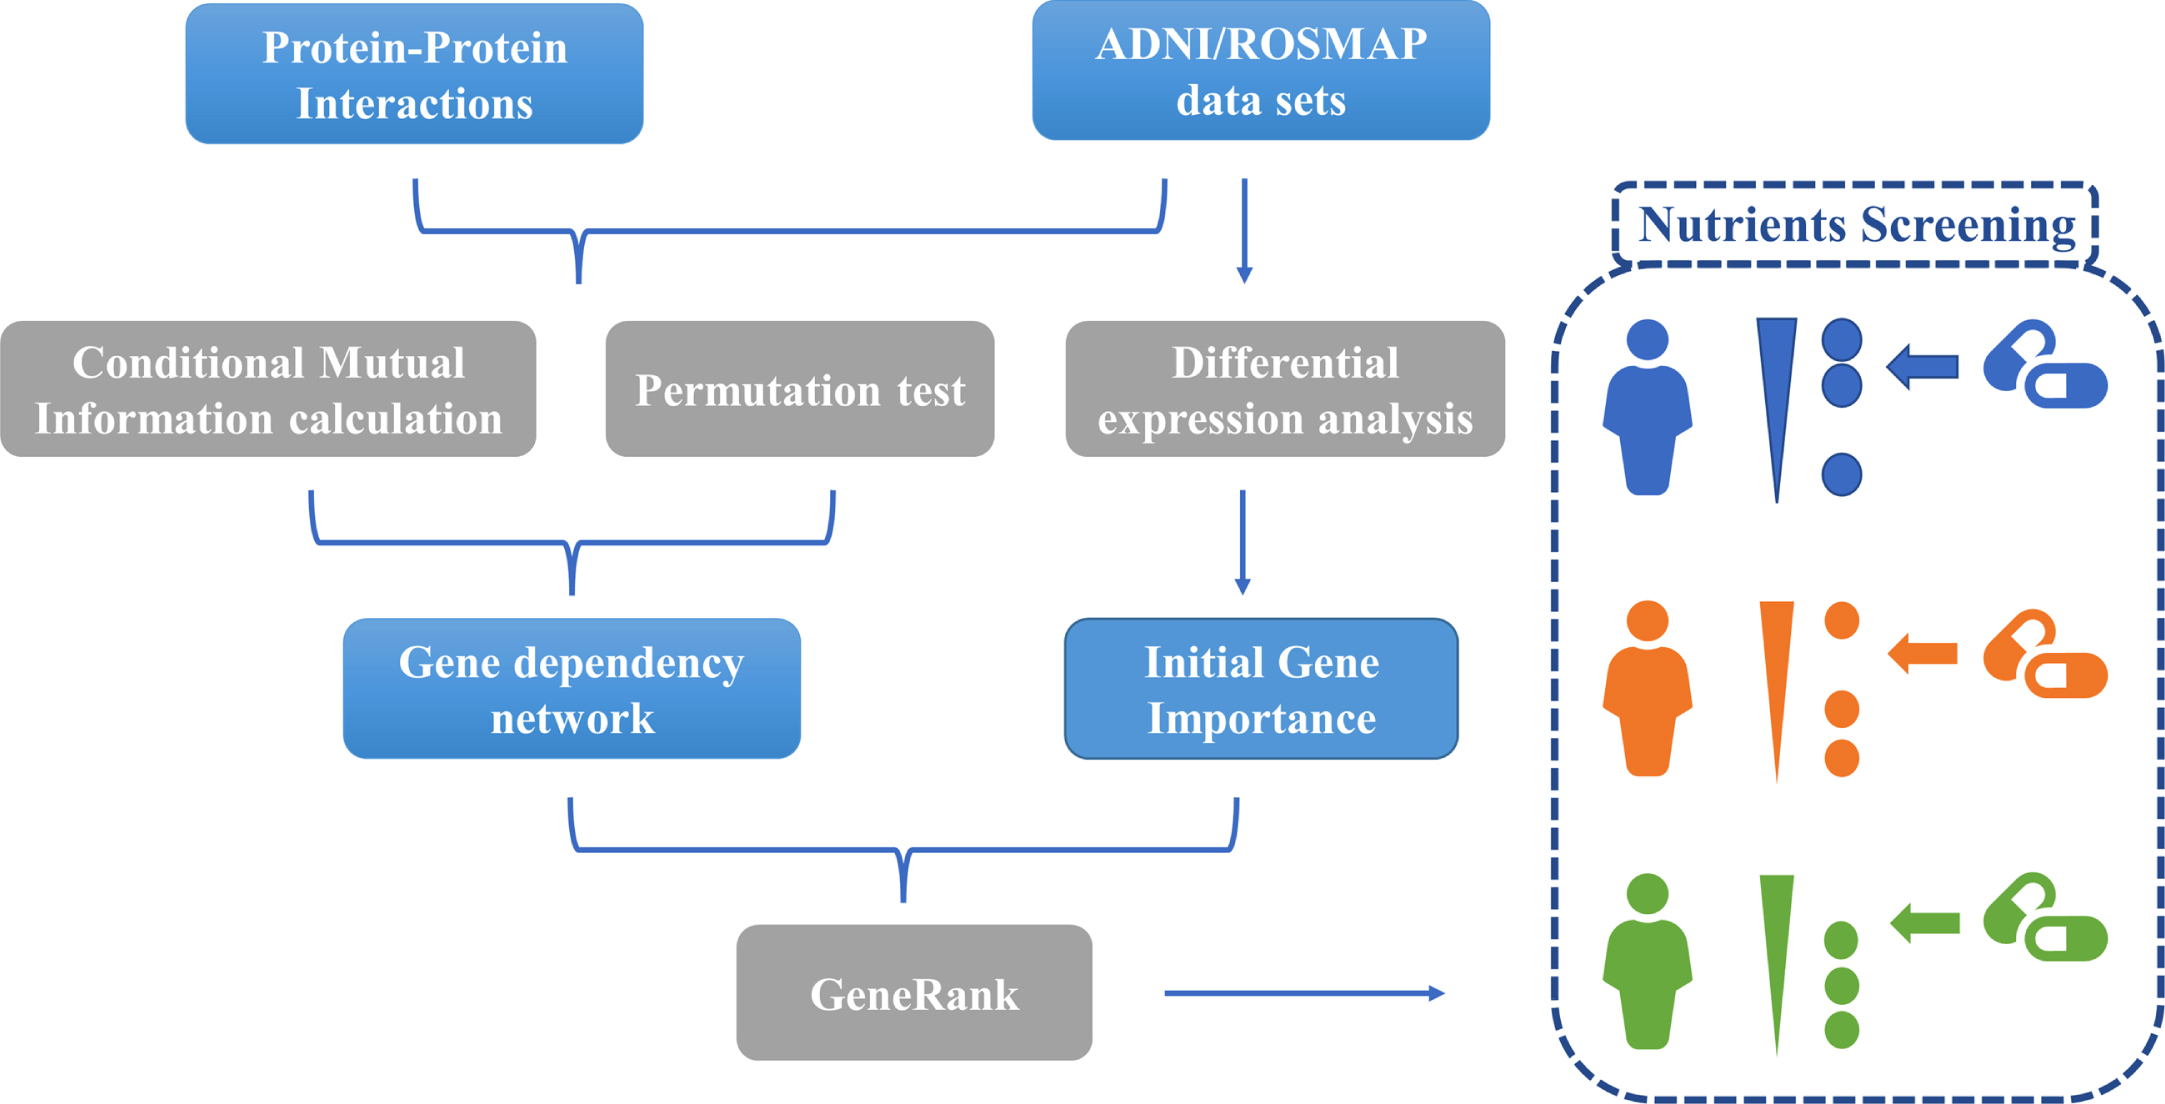
The gene dependency networks were first constructed by calculating conditional mutual information (CMI) and permutation tests to identify the gene dependent pairs during the phenotypic changes. The GeneRank [15, 16] algorithm was then used to rank the gene importance ranking for each AD patient based on gene expression levels and gene dependencies. Based on the gene importance ranking results, we screened out nutrients targeting important genes as potential AD preventive and therapeutic interventions. Figure 1 illustrates our analysis process.
MATERIAL AND METHODS
Study subjects
Transcriptome and phenotype data were obtained from Alzheimer’s Disease Neuroimaging Initiative (ADNI) and the Religious Orders Study and Rush Memory and Aging Project (ROSMAP). ADNI is a longitudinal, multicenter study, that has collected multiple biomedical data from cognitively normal elderly, mild cognitive impairment (MCI) individuals, and AD patients since 2004. Resources are available for exploring new clinical, imaging, genetic, and biochemical biomarkers for the early diagnosis and monitoring of AD [17].
ROSMAP consists of two projects, the Religious Communities Study (ROS) and the Rush Memory and Aging Project (MAP). The ROS project, initiated by Rush University in 1994, is a comprehensive longitudinal study that focuses on aging and AD. The study recruited individuals from religious groups for longitudinal clinical analysis and brain donation [18]. MAP is a longitudinal epidemiological clinicopathology study of dementia and other chronic diseases of aging. Since the study began in 1997, participants undergo detailed annual clinical evaluations and donate their brains, spinal cords, and muscles after death [19].
The ADNI sample used in this study followed the ADNI data use protocol (adni.loni.usc.edu/wpcontent/uploads/how_to_apply/ADNI_Acknowledgement_List.pdf). The ROSMAP data used were under the terms of the data use agreement of Rush University Medical Center (RUMC). All data from ROSMAP are available on the AMP-AD knowledge portal. The data access requirements followed for use can be found at https://adknowledgeportal.synapse.org/DataAccess/Instructions. All participants provided written informed consent, autopsy consent, and data use consent.
Data processing
Gene expression profiles of blood samples from ADNI participants were provided by Bristol-Myers Squibb (BMS). Gene expression measurements were performed on 811 ADNI participants in the ADNI WGS cohort. The Affymetrix Human Genome U219 array (Affymetrix, Santa Clara, CA) was used for expression profiling. For more information, please see http://www.affymetrix.com. Peripheral blood from each sample was collected using PAXgene tubes and analyzed for RNA. The quantity and quality of the extracted RNA were further assessed using NanoDrop and PerkinElmer LabChip GX, respectively. To ensure a balance of sample sex and trait, all samples were randomly assigned to Affymetrix Human Genome U219 array plates. In order to ensure the balance of sample gender and traits, all samples were randomly assigned to the Affymetrix Human Genome U219 array plate. Subsequent steps of hybridization, washing, staining, and scanning were automatically completed using the Affymetrix GeneTitan system. The Affymetrix HG U219 array contained 530,467 probes for 49,293 transcripts. Quality control was performed according to the standard procedures of Affymetrix Expression Console software and Partek Genomic Suite 6.6. Raw expression values were preprocessed with the RMA (Robust Multi-chip Average) normalization method. All Affymetrix U219 probe sets were annotated with reference to GRCh37 (hg19). The final ADNI expression profile retained 14,868 genes.
Gene expression data for brain samples from Rush University contained 490 samples with no duplicates (syn3800853). Brain tissue RNA extraction was performed using the Rneasy Lipid Tissue Kit (Qiagen, Valencia, CA). Subsequent steps such as hybridization were processed with an automated Scigene Little Dipper process (Scigene, Sunnyvale, CA). Specific experimental details of the data are described in the study by Zhang et al. [20]. 410 samples with phenotypic information and passing quality control were retained, each of which had expression information for 19,306 genes. The basic characteristics of two datasets are summarized in Table 1.
Basic Characteristics for participants in ADNI (N = 711) and ROSMAP (N = 410)
AD, Alzheimer’s disease; ADNI, Alzheimer’s Disease Neuroimaging Initiative; ROSMAP, The Religious Orders Study/the Rush Memory and Aging Project; F, female; M, male; MMSE, Mini-Mental Status Examination score; SD, standard deviation; Diff, statistical difference between AD and non-AD. *p-values are calculated by Fisher’s exact tests (for sex) or two-sample t-tests (for age, education, and MMSE).
Construction of gene dependency network
We constructed gene-dependent networks for ADNI and ROSMAP transcriptome data separately, with the following process: Gene expression levels of each gene in the dataset and clinical information of all samples were discretized. The final judgment of AD and normal control (CN) depended on the patient’s status at the time of the last sampling. Some of the MCI patients who eventually converted to AD were classified as AD phenotype (ADNI: 15, ROSMAP: 104). Only patients who were eventually stable in MCI phenotype and normal were considered CN. For AD patients, we set the phenotype to 1; if the patient was CN, the phenotype was set to 0. For gene expression levels, a gene was set to 1 if its expression in a sample was higher than the median expression level of that gene in all samples; otherwise, it was set to 0. To make the calculations more efficient and the results more reliable, we only consider those gene pairs that interact in the protein-protein interaction (PPI) network as candidate dependency pairs. The PPIs used in this study were obtained from the latest STRING database [21]. Gene pairs with scores no less than 400 were retained for subsequent analyses. For each candidate gene-dependent pair (gene A and gene B), we set the expression levels of gene A and gene B and the AD risk of all patients into a triad. The triads were sorted in ascending order according to the expression level of gene B. For genes and their interactions pairs co-existing in gene expression data and PPI network, the gene dependency of one gene (gene A) with another gene (gene B) was characterized by CMI. The calculation formula was as follows:
where E
high
(Gene A, risk) is the mutual information for AD patients with high expression levels of Gene A and 35% of Gene B. E
low
(Gene A, risk) is the mutual information for AD patients with low expression levels of Gene A and 35% of Gene B. The mutual information was calculated using the tool of Peng et al. [22]. For each candidate pair (A, B), we obtained 711 and 410 trios in the ADNI and ROSMAP datasets in the form of (value of gene A, clinical information, value of gene B), with each trio representing one sample, respectively. p-values for CMI were calculated for each gene pair using a permutation test. First, we performed a random permutation of the expression levels of gene B to calculate random CMIs for gene A and gene B. Then, the random permutation was repeated 1000 times to obtain 1000 random CMIs, and these 1000 randomly calculated CMIs were used as the null hypothesis distribution. The actual CMI values in the original hypothetical distribution were divided by 1000 in order (descending order) as the significance p-value of (A, B). Finally, all significant gene dependency pairs (p-value<0.05) were combined into the gene dependency network. In the network, the nodes represent genes and the directed edge (A⟶B) represents the clinical phenotypic mutual information of gene A significantly dependent on gene B.
Mitochondria-related subnetwork extraction
To capture the significant portions of the whole gene dependency network, Molecular Complex Detection (MCODE) was utilized to extract the densely connected regions in the network. To further investigate the role of mitochondrial-nuclear gene interaction mechanism in AD, we selected gene pairs with gene A connectivity in the top 10% and belonging to mitochondria-associated genes for subsequent network analysis. MCODE is based on vertex weighting of local neighborhood density and traversal outward from locally dense nodes to isolate dense regions according to given parameters. This algorithm has the advantage over other graph clustering methods of a directed model that allows fine-tuning the clusters of interest without considering the rest of the network, while examining the cluster interconnectivity associated with the regulatory network. This method has demonstrated favorable outcomes in the analysis of yeast protein interaction networks [23].
The default parameters of MCODE were applied in dividing the subnetwork: Node Score Cutoff: 0.2; Haircut: true; Fluff: false; K-Core: 2; Max. Depth from Seed: 100. Mitochondria-associated genes were derived from our recent study [11], containing mitochondrial localization genes (n = 1,474), mitochondrial epistasis-associated genes (n = 1,650) and hub genes identified by weighted gene co-expression network analysis (WGCNA) (n = 91).
Nodes importance ranking
After obtaining the gene dependency network. The importance of all nodes were assessed. The selected evaluation metric was Maximal Clique Centrality (MCC), a newly proposed method that phenocopies better performance than other methods in terms of accuracy in predicting the basic proteins of the yeast PPI network. The calculation formula is as follows:
Based on these significant nodes, PPI enrichment analysis was performed using the following databases: STRING [21], BioGrid [24], OmniPath [25], and InWeb_IM [26]. Only physical interactions in STRING (physical score > 0.132) and BioGrid were used. The generated network contains a subset of proteins that form physical interactions with at least one other member of the list. If the network contained 3 to 500 proteins, the MCODE algorithm was used to identify densely connected network components. Biological pathway and process enrichment analysis was then applied independently to each MCODE sub-network and the top three entries with the most significant p-values were retained as the functional descriptions of the corresponding subnetworks.
Gene importance ranking and nutrient screening
The fundamental principle of drug therapy is the use of drugs to work on disease driving genes, also known as targets. Drugs with the same efficacy may have distinct drug targets. Similarly, patients who exhibit the same disease symptoms may also have different underlying risk factors, which can be reflected by gene expression profiles. Therefore, it is essential to identify key genes for each patient based on their gene expression data. The effect of a drug on a specific individual patient can be inferred by testing whether the drug can target the corresponding critical gene(s) of the patient. Google developed PageRank [15] to successfully rank web pages based on the hyperlinks of all web pages in the Internet. Based on PageRank, GeneRank [15, 16] can capture the network topology of biological networks and the initial importance of nodes in the network, ultimately prioritizing important genes in biological systems. In this study, gene dependency networks were applied to reveal the interactions between genes. Afterwards, a modified GeneRank algorithm was implemented to prioritize the gene importance for each patient [27].
The central concept of the GeneRank algorithm is that the importance of a node in the network depends on the importance of the nodes that point to it. The equation of the algorithm is as follows:
It can be seen from the formula that the importance of vertex j depends on the value of two components: the initial importance of the gene (the differential expression value of gene i) and the importance value of all vertices pointing to vertex j (the second term on the right side of the formula). A larger d represents that the importance of the gene depends on the gene-dependent relationship, and a smaller d represents that the importance of the gene depends on the initial importance of the gene. In this study, d was set to 0.5 and the algorithm was iterated to stop when ɛ<0.00001, where ɛ is the first order parametric number of
After obtaining the gene importance ranking of AD samples, statistical methods were used to see if the target gene(s) of a candidate drug could targeted the critical genes of the sample and predict the drug’s effectiveness for a specific patient. Our study used the Kolmogorov-Smirnov (KS) test, which measures whether the elements in a set are significantly distributed in the upper or lower part of a given sequence. If the target genes of the drug or combination of drugs are predominantly distributed in the upper part of the list of key genes in the patient, then this drug or combination of drugs is considered to be more efficacious in this patient. The smaller the p-value of the test for the KS test, the more effective the drug is for this patient. The drug efficacy prediction model for a particular patient is constructed without the use of class labels and without a training process. Nutrients and targets information derived from the most recent Drugbank database [28], which included 95 approved nutrients.
Ethics approval and consent to participate
Usage of ADNI samples follows the data use agreement at ADNI (https://adni.loni.usc.edu/data-samples/access-data/#access_data). Data from ROSMAP were obtained under data use agreement with Rush University Medical Center (RUMC). ROS and MAP were approved by an Institutional Review Board of RUMC. All participants gave written informed consent, signed an Anatomic Gift Act, and signed a repository consent allowing their data to be shared.
RESULTS
Establishment and evaluation of gene dependency network
A pipeline for constructing gene dependency networks was proposed in our previous work and its efficacy was demonstrated in discovering cancer-related prognostic genes [13]. In this study, we applied this strategy to AD to uncover the mitochondria-related gene-dependent relationships in the AD pathogenesis. Gene dependency networks were constructed based on transcriptome data from ADNI and ROSMAP, respectively. After the permutation test, there were 66,538 and 112,513 significant gene dependent relationship pairs in ADNI and ROSMAP, respectively. We selected the gene pairs with gene A connectivity in the top 10% of the pairs for subsequent analysis (Supplementary Table 1). Hypergeometric enrichment tests revealed that either gene A or gene B in these combinations were enriched to different kinds of mitochondria-associated genes as well as WGCNA hub genes obtained from our previous study [11] (Table 2). Our results suggested that mitochondrial-nuclear gene interactions play an important regulatory role in AD pathogenesis.
Gene dependency network enrichment results
The gene dependent pair (A, B) implies that the effect of gene B on the phenotype depends on gene A. Hypergeometric enrichment tests revealed that either gene A or gene B in these combinations were enriched to different kinds of mitochondria-associated genes as well as WGCNA hub genes obtained from our previous study [11].
Identification of mitochondria-related subnetwork modules
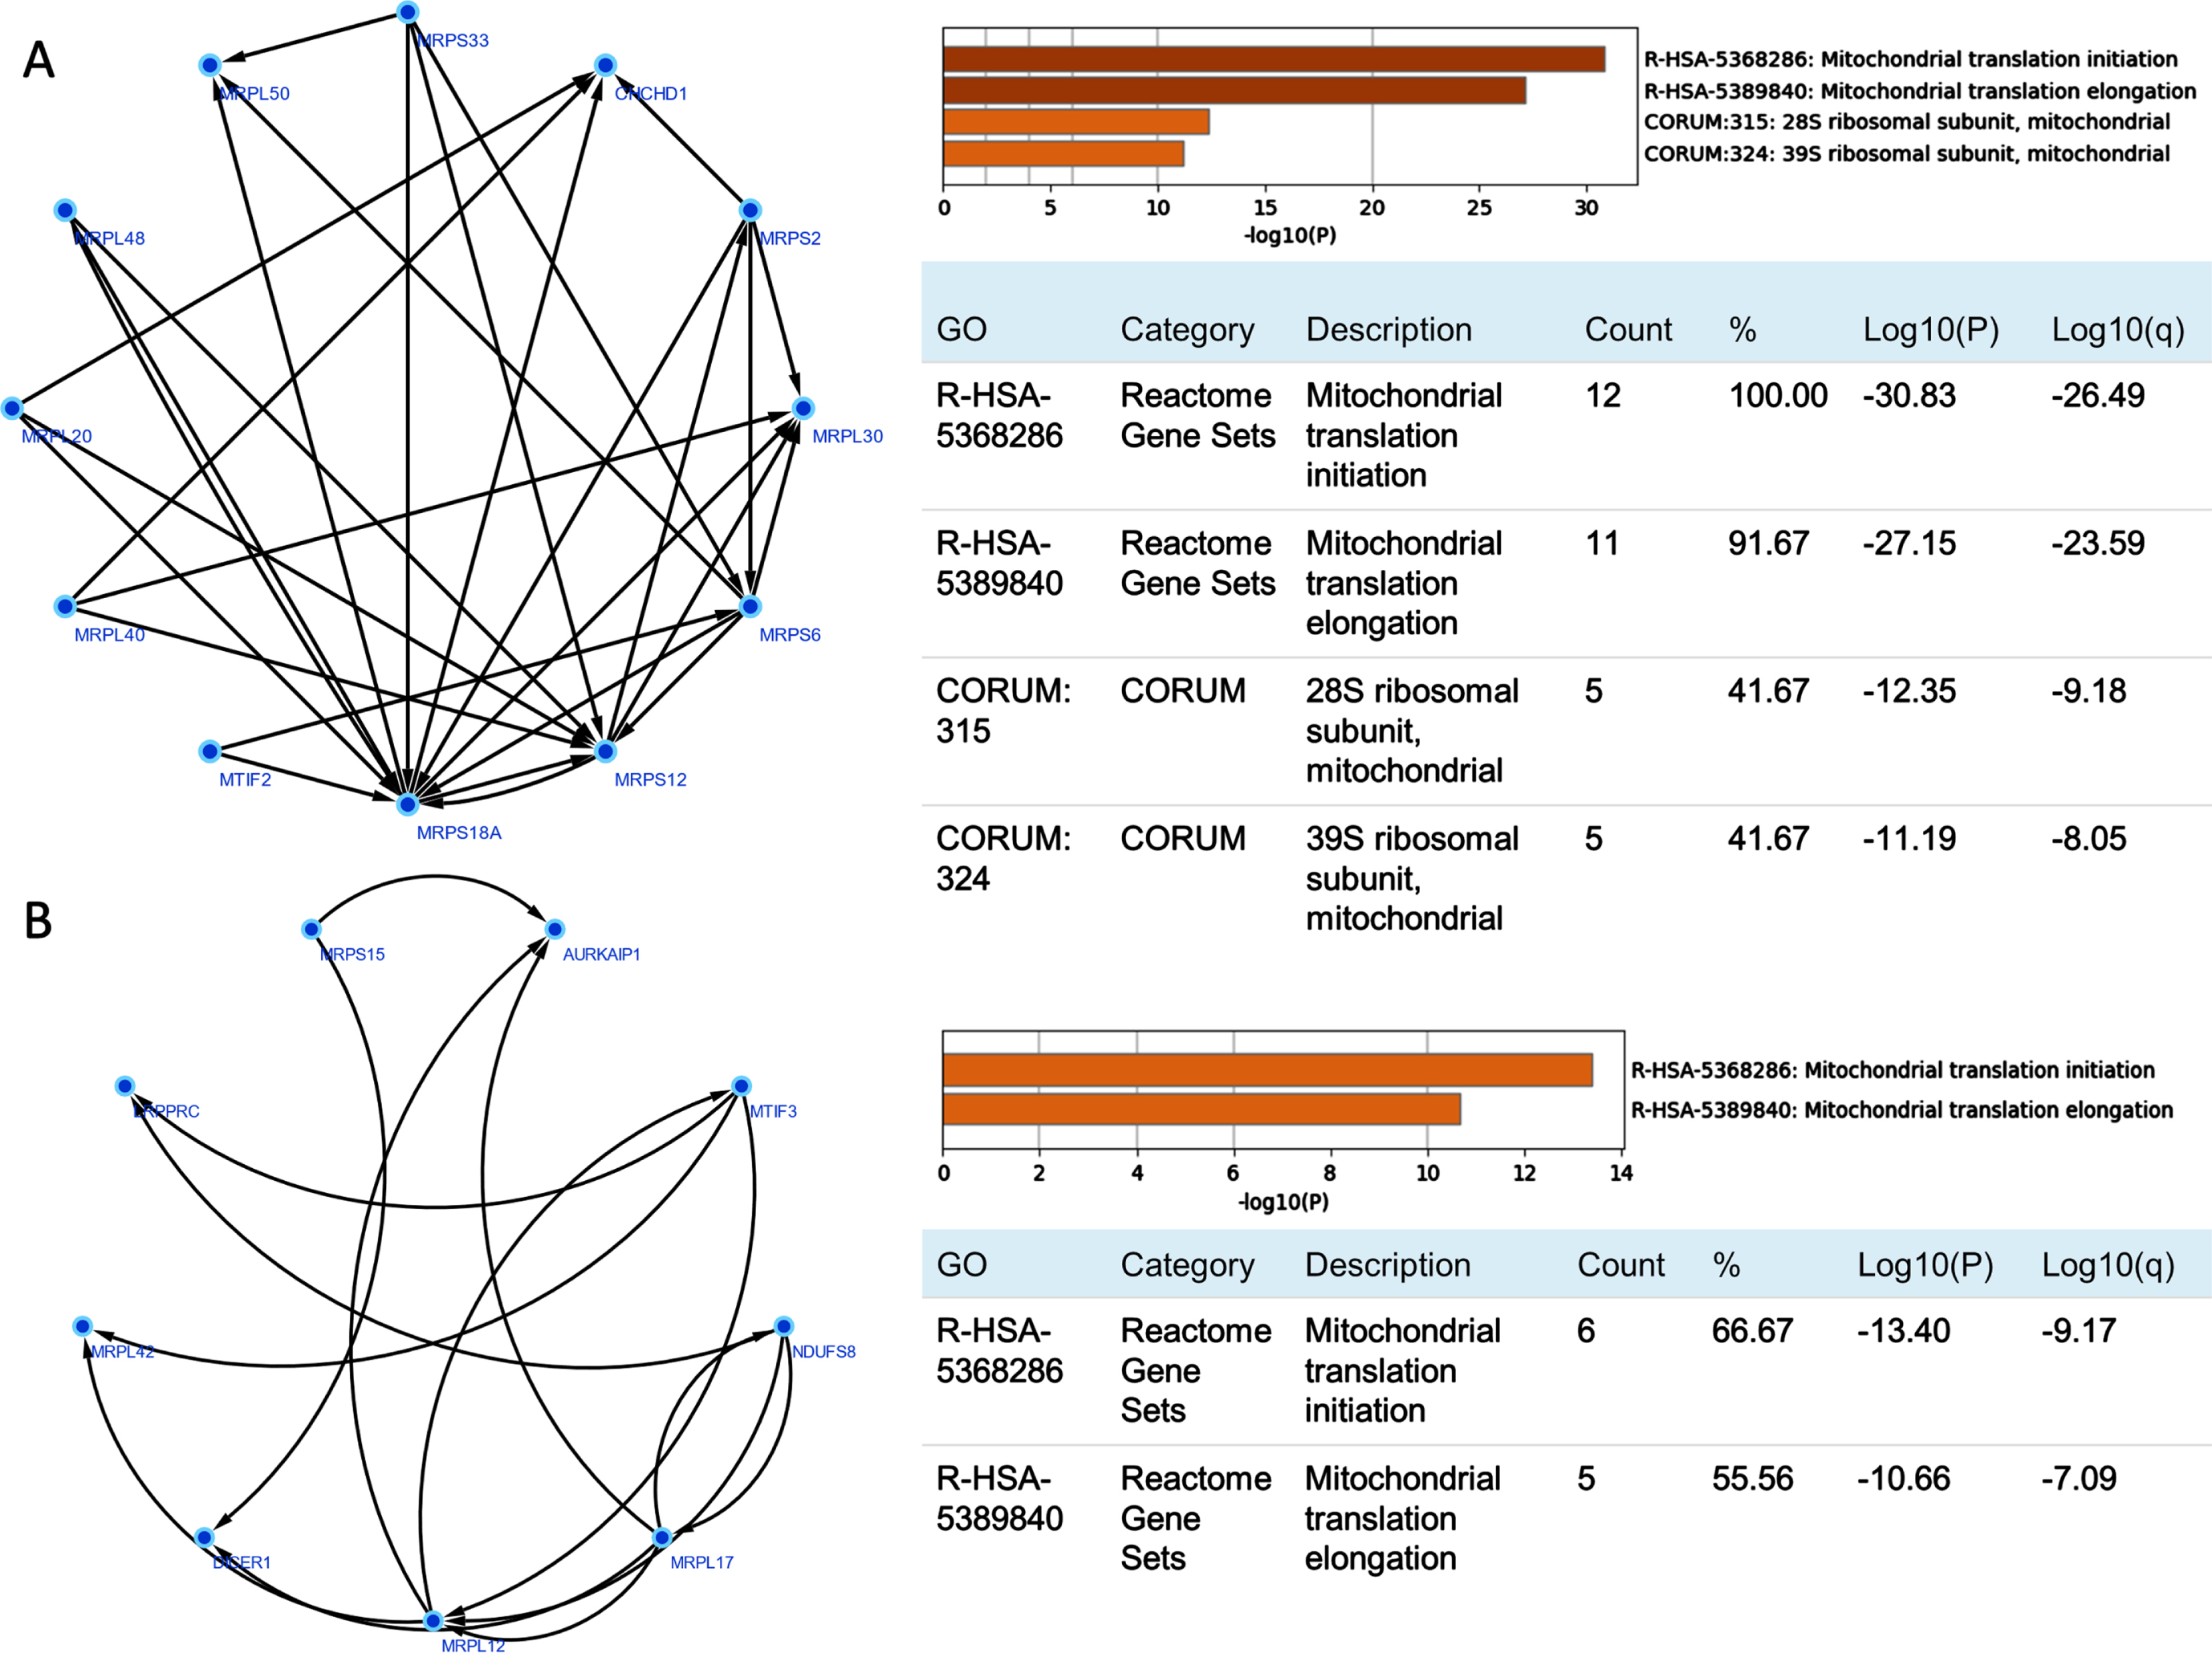
To identify important subnetworks that were closely related to mitochondria, the MCODE algorithm were applied to cluster the whole gene dependent network. Finally, seven subnetworks were obtained for ADNI and 11 subnetworks were detected for ROSMAP. Enrichment of the above three types of mitochondrial genes in these subnetworks revealed that cluster1 and cluster4 of ROSMAP were significantly enriched to mitochondria-associated genes (Hypergeometric Test, p = 0.017 and 0.049) (Supplementary Table 2).
ROSMAP cluster1 (MRPS6, MTIF2, MRPL30, MRPS12, MRPS18A, MRPS33, MRPL40, CHCHD1, MRPL48, MRPL50, MRPL20, MRPS2) and cluster4 (NDUFS8, MRPL17, MRPL42, LRPPRC, DICER1, MTIF3, MRPL12, MRPS15, AURKAIP1), which were significantly enriched for mitochondrial genes, were selected for GO enrichment. The results showed that both modules were significantly enriched in mitochondrial translation initiation and mitochondrial translation elongation processes. Most of the genes in these modules belong to the MRP family. CHCHD1 in cluster1 and AURKAIP1 in cluster4 are also newly identified MRP members (named MRPS37 and MRPS38, respectively), as shown in Fig. 2.
Analysis of critical nodes related to mitochondria
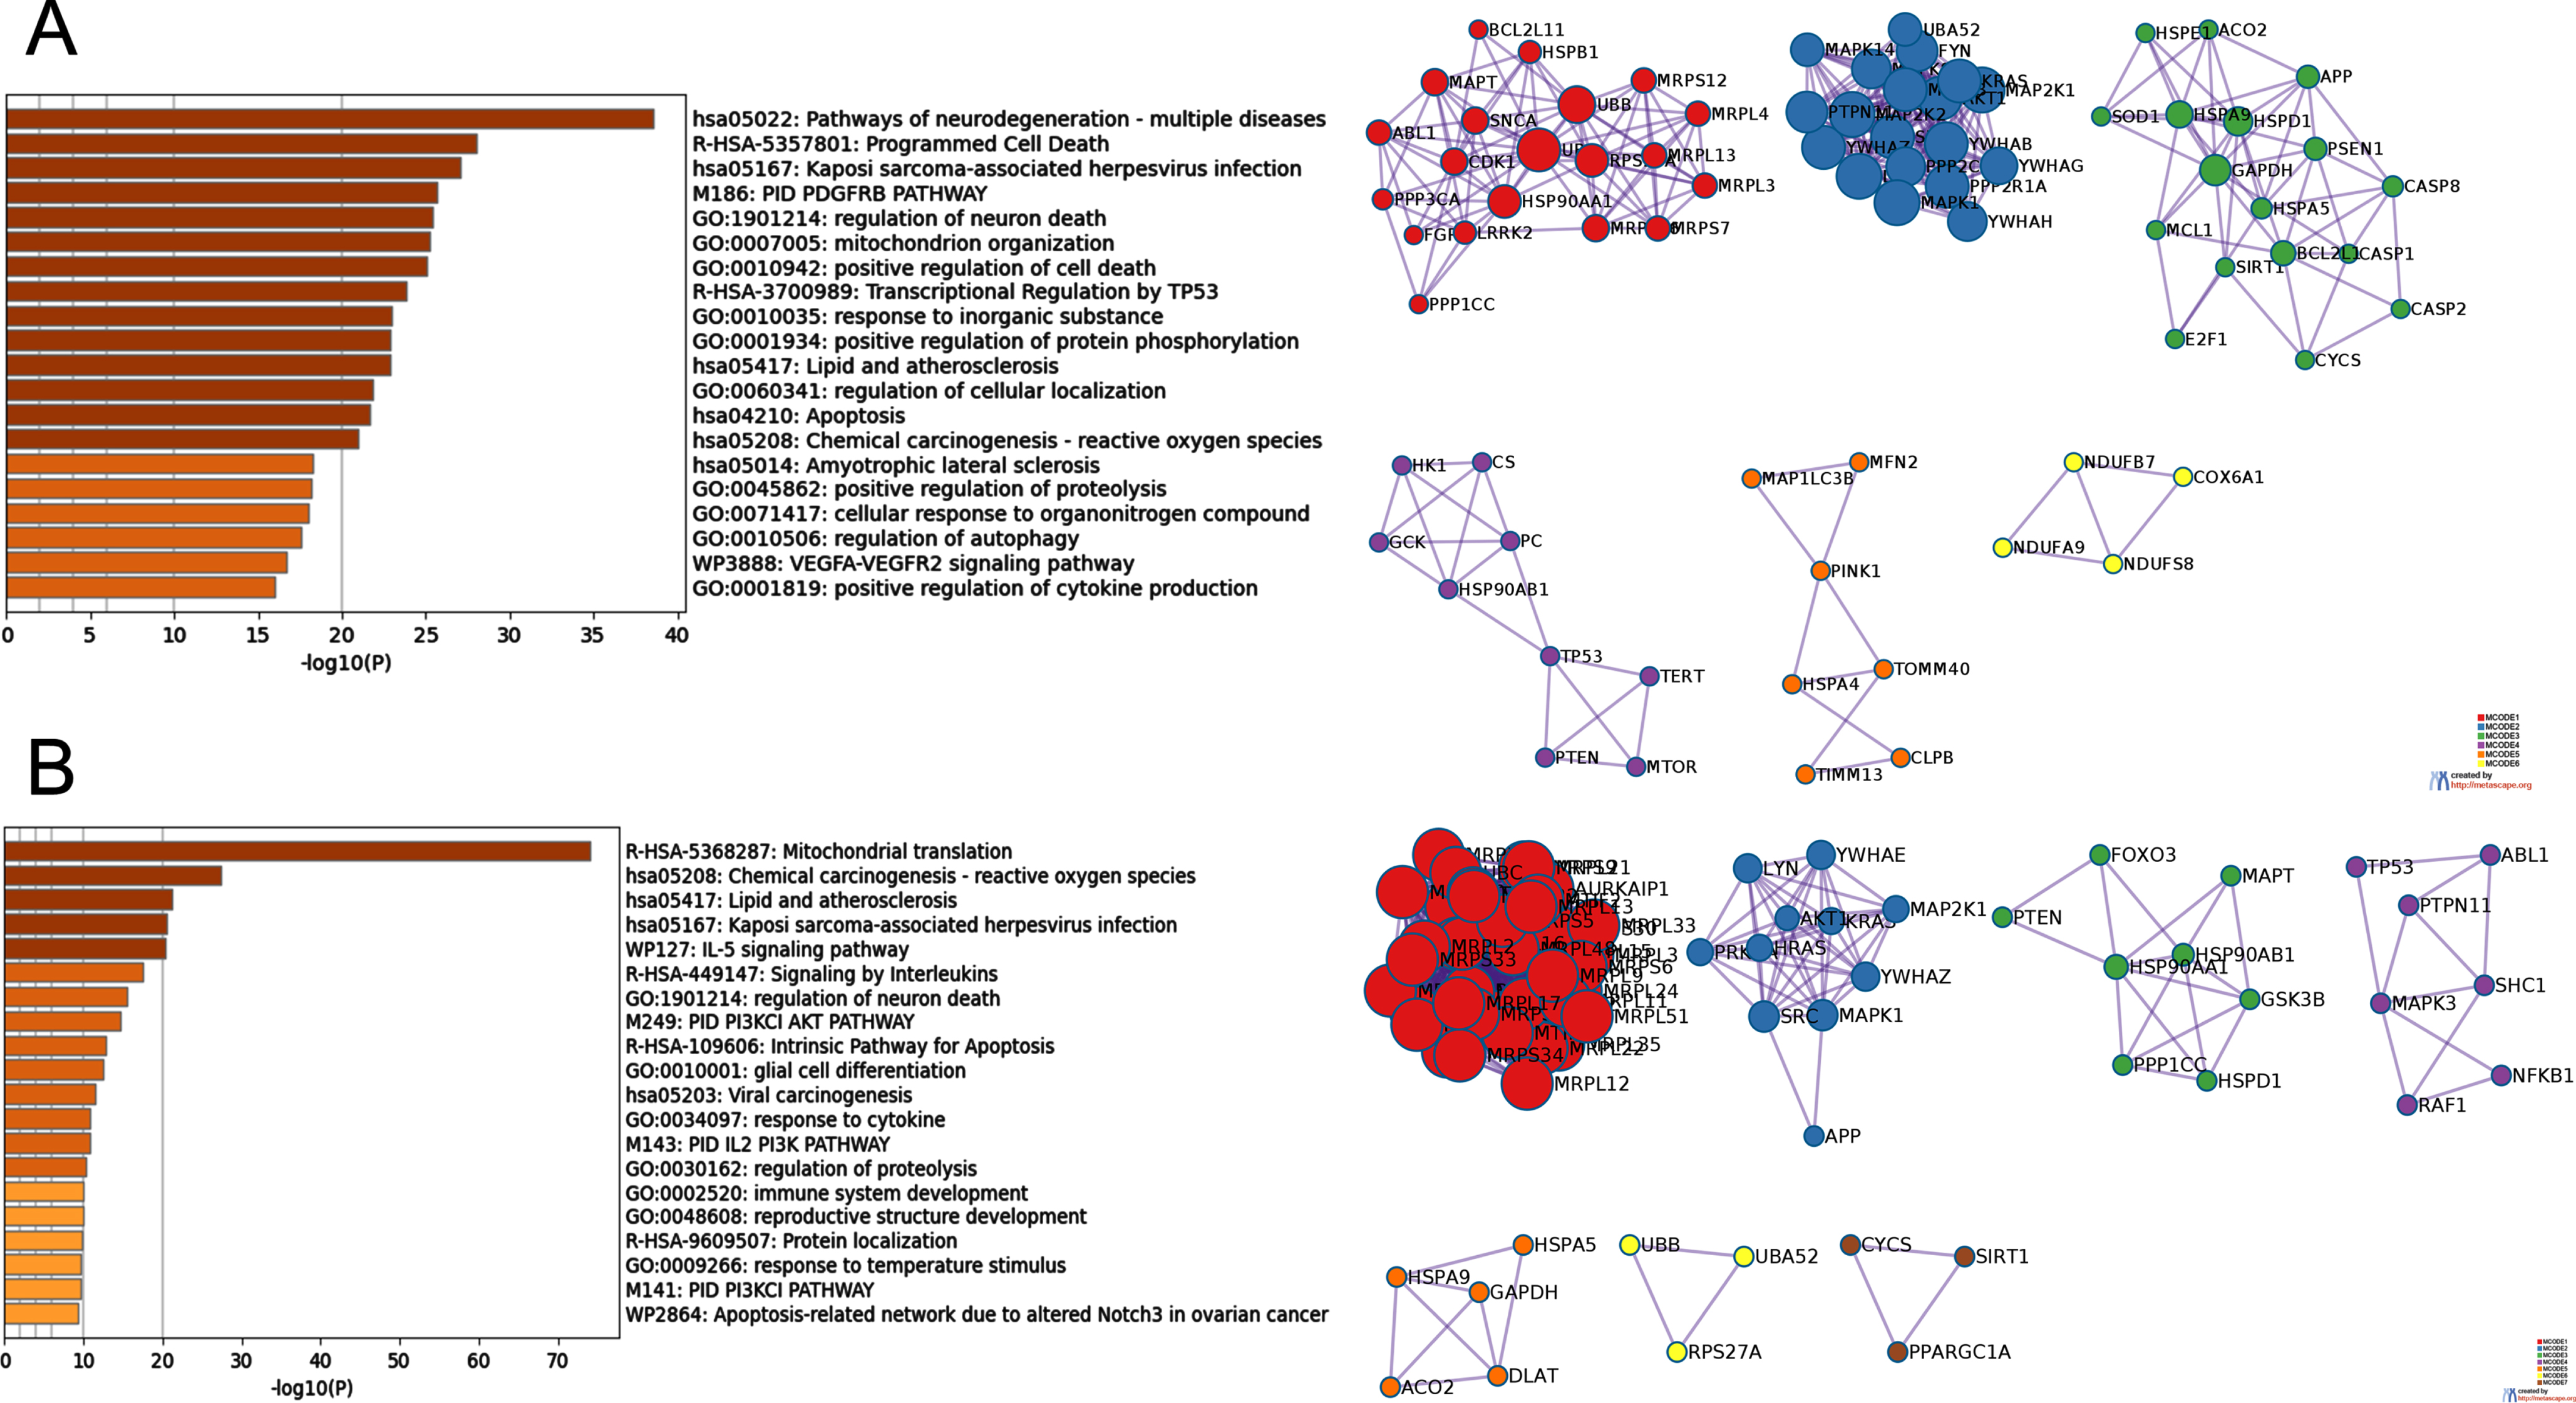
The MCC importance of nodes in all dependency pairs with gene A connectivity in the top 10% and belonging to mitochondria-related genes were calculated. The nodes with the top 100 MCC scores were selected for further exploration (Supplementary Table 3). To elucidate the biological functions of these important nodes, the densely connected regions in these nodes were extracted by MCODE and PPI enrichment analysis. Six sub-networks were derived from ADNI and seven sub-networks were extracted from ROSMAP. For each subnetwork, we performed biological function analysis separately and retained the top three entries with the best p-value as the functional description of the corresponding sub-networks. Detailed results were shown in Fig. 3, Table 3, and Supplementary Tables 4 and 5.
Biological function and pathway analysis of MCODE components
For the TOP100 significant nodes in the MCC scoring, protein-protein interaction enrichment analysis was performed using the following databases: STRING, BioGrid, OmniPath, InWeb_IM. Only physical interactions from STRING (physical score > 0.132) and BioGrid were used. The generated protein interaction network contains a subset of proteins that have physical interactions with other members (at least one) of the analyzed gene lists. When the resulting network contains 3-500 proteins, the MCODE algorithm was used to identify locally densely connected clusters in the whole. Biological functional enrichment analysis was performed for each MCODE sub-network identified. The top three results in terms of p-value significance were retained as the functional description of that sub-network.
The biological functions involved in the ADNI MCODE subnetworks can be summarized as: mitochondrial ribosome translation-related functions, platelet-derived growth factor/platelet-derived growth factor receptor (PDGF/PDGFR) pathway, positive regulation of peptidase activity, central carbon metabolism in cancer, establishment of proteins localized in mitochondria, and electron transport chain involving mitochondrial ATP, etc. The biological processes of the MCODE subnetworks for ROSMAP can be described as: mitochondrial translation-related functions, ERBB1/PDGFR/MTOR pathway, CNS neuronal development, neurotrophic factor signaling pathway, production of precursor metabolites and energy, maturation of protein E, and some signaling and stimulus response processes. It is worth noting that MCODE_1 of both ADNI and ROSMAP were associated with mitochondrial translation-related functions, demonstrating the vital role of these identified MRP genes in AD pathology.
In addition, these modules were also enriched in PDGFR-related pathways (ADNI: MCODE 2, ROSAMP: MCODE 2). PDGF and its receptor PDGFR are expressed in a variety of cell types, including brain cells such as neuronal progenitors, neurons, astrocytes, and oligodendrocytes. The PDGF family comprises five functional subunits. They are A, B, C, and D, which are linked by disulfide bonds of polypeptide chains to form homo- or heterodimers, namely PDGF-AA, PDGF-AB, PDGF-BB, PDGF-CC, and PDGF-DD. These growth factors promote their biological on-cell functions by binding to their cognate receptors, namely PDGFR-α and PDGFR-β, through receptor tyrosine kinase activity. Emerging evidence suggests that PDGF-mediated signaling regulates various functions of the central nervous system (CNS), such as neurogenesis, cell survival, synaptogenesis, regulation of ligand-gated ion channels, and the development of specific types of neurons [29]. Interestingly, PDGF/PDFGR signaling can trigger opposite effects in the CNS, depending on the cell type and activating stimulus, and is associated with the pathogenesis of several neurodegenerative diseases [30].
Nutrients discovery for Alzheimer’s disease
Traditional drugs used to treat AD often come with great side effects. Tacrine, the first and most effective acetylcholinesterase inhibitor among the five FDA-approved AD drugs, was found to be highly hepatotoxic and caused definite acute liver injury. It was eventually withdrawn from the market due to excessive adverse effects and risks outweighing the benefits [31]. To mitigate the toxic effects of AD medication, we sought to identify nutrients with potential therapeutic effects on AD. Based on the constructed gene dependency network, ADNI and ROSMAP individuals were ranked for gene importance by GeneRank. Then, 95 nutrients and their targets collected in DrugBank were predicted for drug efficiency. The mean KS p-values were calculated for all individuals in each database to determine the overall drug efficiency of the nutrients, and nutrients targeting important genes were selected. Finally, seven nutrients were identified in ADNI and 69 nutrients in ROSMAP at a threshold of p-value less than 0.05. Specifically, the seven nutrients screened based on ADNI samples were also consistently identified in ROSMAP. The names of all the significant nutrients were listed in Supplementary Table 6.
These seven nutrients are listed in descending order according to the predicted drug effectiveness: Nicotinamide Adenine Dinucleotide (NADH), Adenosine Phosphate, Adenosine Triphosphate (ATP), Proline (Pro), Alfacalcidol, Glutathione (GSH), and L-Glutamine. Moreover, NADH was predicted to be the most effective nutrient in both the ADNI and ROSMAP samples.
DISCUSSION
AD is a neurodegenerative disease that arises from a complex interplay of various processes. The underlying mechanisms of AD remain unclear, and all potential drugs have failed to varying degrees in human trials. Several hypotheses have been proposed to explain the cause of AD. Currently, one of the most promising hypotheses considers mitochondrial dysfunction as an early event in AD development and a potential therapeutic target. Our study provides innovative insights into the mitochondria-related regulatory relationships in AD pathogenesis from a gene-dependent perspective. Based on the AD gene dependency network, the nutrients targeting important genes in patients were further screened by the personalized GeneRank algorithm and KS test. Our study provides novel ideas for understanding AD mitochondrial pathogenesis and personalized prevention and treatment.
The identification of important nodes related to mitochondria highlighted the significant role of MRPs. Mammalian MRPs are encoded by nuclear genes, synthesized in the cytoplasm and then transported into the mitochondria for assembly into mitoribosomes. MRPs not only play a role in mitochondrial oxidative phosphorylation, but also participate in regulating cellular state as apoptosis-inducing factors. Abnormal expression of MRPs leads to mitochondrial metabolic disorders, cellular dysfunction, etc. Many studies have shown that abnormal expression of MRPs is closely related to aging and various tumors. For example, specific downregulation of MRPL2 in the retina was identified in aged APP/PS1 mice at 8 months [32]. Epigenetic mapping of mice revealed that the methylation level of MRPL4 increased with aging [33]. Houtkooper et al. identified mitochondrial ribosomal protein S5 (MRPS5) and other mitochondrial ribosomal proteins (MRPs) as metabolic and lifespan regulators using mouse population genetics and RNAi technology in Caenorhabditiselegans (C. elegans). MRPs knockdown triggers mitochondrial protein imbalance, reduces mitochondrial respiration, and activates the mitochondrial unfolded protein response [34]. Taken together, we suggested that these sets of MRPs genes in cluster1 and cluster4 may have interdependent relationships in the AD mitochondrial mechanism and jointly regulate the AD pathological process.
In addition, the analysis for the top 100 important genes of MCC ranking revealed that MCODE 2 of both ADNI and ROSMAP were enriched to PDFGR-related pathways. Since Aβ accumulation starts decades before the onset of AD symptoms, it has been proposed that biomarkers in plasma and cerebrospinal fluid could predict AD onset long before the neurodegenerative process begins, thus facilitating AD prevention. Ray et al. identified PDGF-BB as one of the most important biomarkers associated with AD through a study of 18 different plasma markers [35]. Decreased levels of plasma PDGF-BB correlates with the degree of cognitive impairment observed in AD patients [36]. Therefore, PDGF-BB can be used to identify individuals with MCI in advance. In addition, PDGF-BB was observed to bind to sorL1, sorCS1, and sorCS3 in late-onset AD. This process in turn affected their interactions and downstream signaling from PDGFR-β, which may ultimately lead to pericyte dysfunction and/or degeneration [37]. In summary, a number of studies have now confirmed the role of PDGF-BB in AD and its significance as a therapeutic target. However, no study has yet suggested that this pathway is associated with mitochondria. Our study proposed two collections of gene-dependent relationships between the PDGF pathway and mitochondria associated with the pathogenesis of AD, opening new doors for the understanding of mitochondrial mechanisms in AD. Targeting multiple genes simultaneously in these subnetworks may improve AD drug efficacy.
Numerous studies have demonstrated the protective role of multiple micronutrients and macronutrients in the prevention and treatment of AD. However, the effectiveness of nutrient is difficult to estimate due to the complexity of the disease and the individual-specific pathological manifestations of AD. Therefore, based on the constructed gene dependency network, we further ranked the genetic importance of each patient sample by the GeneRank algorithm [15, 16] and then used the KS test to screen out nutrients with potential therapeutic effects on AD. The process can also be used for precision medicine and drug efficiency prediction for AD or other diseases. Five of the seven nutrients we predicted to have the highest overall efficiency have been shown to improve AD-related symptoms and are closely related to mitochondria-related pathways such as energy metabolism or oxidative stress. Combining all ADNI and ROSMAP samples, NADH was considered to be the most effective nutrient. NADH is an antioxidant coenzyme present in every living cell in the body primarily involved in the metabolism of substances and energy in cells. It is produced in the citric acid cycle in glycolysis and cellular respiration and acts as a carrier of biohydrogen and an electron donor, transferring energy to supply ATP synthesis through an oxidative phosphorylation process in the inner mitochondrial membrane. Therefore, NADH is also known as mitochondrial element [38]. As a derivative of vitamin B3, NADH enhances brain cognition and health by producing ATP energy and increasing dopamine levels. NADH also plays various roles in regulating mitochondrial energy metabolism, calcium homeostasis, brain gene expression, and anti-apoptosis. It has been used in the treatment of several neurological disorders, including AD [38, 39].
In addition, GSH has been recognized as a natural antioxidant that protects the brain from damage. GSH levels are significantly reduced in the hippocampus of MCI and AD patients compared to healthy elderly subjects. Therefore, GSH supplementation is necessary to enhance cognitive performance in patients with MCI and AD [40]. Glutamine is the most abundant amino acid in human blood, which is necessary and critical for many cellular functions. In the brain, glutamine is primarily produced by astrocytes that express glutamine synthetase. Many pathological factors known to contribute to AD can directly reduce glutamine synthetase activity, including Aβ deposition, chronic inflammation, hypoxia, ischemia/reperfusion, and oxidative stress. Indeed, glutamine metabolism is impaired in AD patients, and glutamine deficiency can impede critical cellular functions such as mitochondrial energy production, DNA damage response, apoptosis, and autophagy. Therefore, glutamine supplementation may help prevent or delay aging-induced degenerative diseases [41]. These results illustrated the effectiveness of gene-dependent networks and demonstrated the important role of mitochondria in the diagnosis and management of AD. These nutrients may improve AD by enhancing mitochondrial function. The remaining ones, proline and alfacalcidol, while not currently supported by the literature, also deserve further investigation. It is worth noting that there is a gap between the therapeutic potential of these nutrients and their clinical effectiveness. Extensive follow-up experiments are needed to validate them before they can be used in clinical treatment.
Several limitations might exist in our study. First, we used gene expression data for all European samples. Therefore, the results may differ among different races. Second, we only considered gene expression data when calculating the mutual information between genes because it best reflects the effect of the current physiological state of the sample on the genes. If other types of data can be considered, such as the genome, epigenome, metabolome, etc., it may be possible to analyze gene dependencies more comprehensively. In addition, there are many controversial issues with the prioritization of web pages. For example, because the most well-known mechanisms or the genes involved in them tend to recur in many studies, there is a risk of creating artificial importance based on the visual effects of the Internet. Such results may highlight the importance of certain research hotspot genes. Finally, the specific mechanisms of our proposed mitochondria-related important regulatory genes and the efficacy of the candidate nutrients need further experimental validation.
In conclusion, we explored the mitochondria-related mechanisms in AD through systematic transcriptomic analysis. By constructing gene dependency networks, we identified two sub-networks with important regulatory roles in mitochondrial transcriptional translation. The importance of MRPs (e.g., MRPL17, MRPL42) in AD was demonstrated. Node importance analysis identified subnetworks related to PDGF pathway and mitochondria. Drugs that simultaneously target multiple genes in these subnetworks may have better therapeutic efficacy. Further, we used the GeneRank algorithm to rank the gene importance of each patient sample. Finally, we proposed seven most effective and safe nutrients by examining whether the drugs target critical genes. Our study suggests the important role of MRPs in the regulatory process of AD. Targeting certain MRPs genes may be a promising therapeutic strategy for AD.
Footnotes
ACKNOWLEDGMENTS
We like to thank the individuals who participated in the ROSMAP, ADNI, and their families and caregivers for making the programs possible.
FUNDING
Study funded by Fundamental Research Funds for the Central Universities (2662021JC008).
Data obtained from the Alzheimer’s Disease Neuroimaging Initiative (ADNI) database were funded by the Alzheimer’s Disease Neuroimaging Initiative (ADNI) (National Institutes of Health Grant U01 AG024904) and DOD ADNI (Department of Defense award number W81XWH-12-2-0012). The investigators within the ADNI contributed to the design and implementation of ADNI and/or provided data but did not participate in analysis or writing of this report.
Work from Rush was supported in part by grants P30AG10161, R01AG15819, R01AG17917, U01AG61356, R01AG30146, the Illinois Department of Public Health, and the Translational Genomics Research Institute (Kronos Science). We are indebted to the participants in the Religious and the Orders Study and the Rush Memory and Aging Project.
CONFLICT OF INTEREST
The authors have no conflict of interest to report.
DATA AVAILABILITY
The transcriptome data can be applied from the ADNI website (http://adni.loni.usc.edu). The gene expression profiles of AD patients from ROSMAP can be obtained through RADC (https://www.radc.rush.edu) or the ADKnowleage Portal (http://www.synapse.org). The protein-protein interaction network was obtained from the latest STRING database (https://string-db.org). Nutrients and their target information were downloaded from the DrugBank database (![]() ).
).