
Abstract
Background:
Although insulin dysregulation and resistance likely participate in Alzheimer’s disease (AD) etiologies, little is known about the correlation between type 2 diabetes mellitus (T2DM) and the progression of cognitive decline in patients with AD.
Objective:
To determine whether AD patients with T2DM experience more rapid cognitive decline than those without T2DM.
Methods:
All cognitive performance data and the presence or absence of T2DM comorbidity in patients with AD were derived from the US National Alzheimer’s Coordinating Center’s (NACC) Uniform Data Set (UDS). A search of the UDS identified 3,055 participants with AD who had more than one epoch completed. The data set culled clinically diagnosed AD dementia patients who were assessed for diabetes type identified during at least 1 visit. These patients were divided into 2 groups based on whether they had a diagnosis of T2DM. The data from these groups were then analyzed for differences in cognitive decline based on neuropsychological test battery scores and a Clinician Dementia Rating using a general linear model.
Results:
Comparisons of the mean scores for 16 selected tests from the neuropsychological test battery showed no significant differences in baseline scores and scores at subsequent visits between the T2DM and nondiabetic groups.
Conclusions:
The results revealed no differences in cognitive decline metrics over the course of 5 visits in either study group. These data indicate that the presence of T2DM does not increase the rate of cognitive decline in AD. This finding contradicts expected disease burden and will need to be explored further.
Keywords
INTRODUCTION
More than 6 million individuals in the United States have a diagnosis of Alzheimer’s disease (AD), and this number is predicted to increase to 13 million in the next 30 years [1]. AD is increasingly prevalent among older individuals; 72% of those diagnosed are 75 years old or older [2]. AD is a chronic form of dementia, with symptoms such as deficits in short- and long-term memory and loss of executive functions that eventually lead to premature death.
Type 2 diabetes mellitus (T2DM) is a chronic disease characterized by insulin resistance. It is estimated that 90% to 95% of the 34 million people with diabetes in the United States have T2DM [3]. Even with proper glycemic control, many complications are associated with T2DM, including cardiovascular disease, chronic kidney disease, nerve damage, and hearing and vision loss [4]. Cognitive impairment is a possible complication for individuals with T2DM. For example, a 2016 study compared the performance of executive function tasks among a healthy control group, a T2DM group, and an AD group [5]. The study concluded that the performance of the T2DM group in verbal and visuospatial tasks was worse than that of the healthy control group, although better than that of the AD group, even in patients who had good glycemic control [5]. In addition, multiple studies have demonstrated that the risk of developing AD is specifically increased in individuals with T2DM [6–9]. This increased risk has been reported to be as high as 50% to 60% in some instances [10]. A meta-analysis found that individuals with diabetes had a 1.25 to 1.91 increased risk of developing cognitive impairment or dementia [11].
A variety of proposed mechanisms attempt to show the underlying relationship between AD and T2DM, but no mechanism is currently accepted. Factors such as insulin resistance, advanced glycation end products, inflammatory responses, and oxidative stressors are being studied [12]. Because the late-stage pathophysiology of AD shows insulin resistance in the brain similar to that of T2DM, AD has been referred to in a previous study as “type 3 diabetes” [13]. One possible mechanism linking AD and T2DM is that increased insulin levels in the brain lead to insulin-degrading enzyme (IDE) becoming saturated and unable to properly clear amyloid-β (Aβ), whose degradation is partly reliant on these enzymes [14]. Two substrates of IDE, Aβ and insulin, are critically important in the pathogenesis of both AD and T2DM [15]. In addition, advanced glycation end products that are produced due to hyperglycemia can exacerbate AD pathology due to glycation of Aβ and tau proteins, thus increasing the production of Aβ plaques and neurofibrillary tangles [14, 16]. A 2017 study examined the role of the misfolded islet amyloid polypeptide (IAPP; also termed amylin), which is a hormone produced by pancreatic β-cells. The study showed that IAPP is capable of cross-seeding Aβ aggregation in vitro in the brains of AD Tg2576 transgenic mice (an APP model) that were injected in the hippocampus with a pancreatic homogenate from IAPP+/+ animals and in vivo in the brains of double-transgenic mice (IAPP+/+×APP). In addition, the AD animal models with IAPP displayed spatial memory impairments compared to respective control animals [17].
Earlier studies have focused on the development of cognitive impairment similar to AD in patients with T2DM [18–20]; other studies have investigated the progression of cognitive symptoms in mouse or rat models [21, 22]. However, the specific aim of our study was to determine whether patients with AD and T2DM comorbidity experienced more rapid cognitive decline compared to patients with AD without T2DM. All study participants had received a diagnosis of AD. Another study examined multiple vascular risk factors and their potential acceleration of AD after diagnosis [23], whereas our study focused primarily on T2DM and incorporated a larger pool of data. We hypothesized that AD patients with T2DM would experience a more rapid cognitive decline than AD patients without T2DM.
METHODS
Standard protocol approvals, registrations, and patient consents
The National Alzheimer’s Coordinating Center (NACC) database (http://www.naccdata.org) was used to analyze a large data set with homogeneous entries. This database was established by the National Institute on Aging (http://www.nia.nih.gov). The NACC receives longitudinal data from all Alzheimer’s Disease Research Centers (ADRCs) across the United States. These data include diagnostic, demographic, and clinical evaluations of subjects with dementia from multiple visits that can be used to trace cognitive decline. All participants who have data in the NACC database were enrolled at ADRCs nationwide. All participants provided consent to participate by signing printed institutional review board–approved informed consent forms at the time of enrollment that were approved by the respective institutional review boards. The informed consent included permission for deidentified data to be uploaded to and included in the NACC database for use in research by qualified investigators. No additional patient informed consent was required for this individual retrospective observational case-control study.
Study design
The NACC has gathered data since 1984 on individuals with dementia enrolled at collaborative research centers across the United States. The NACC’s Uniform Data Set (UDS) was established in 2005, and prospective data with clinical evaluations of individuals are now collected annually. NACC’s UDS version 3 (v3) was used for this study (i.e., no data from UDS version 1 or version 2 were included in our analysis because those sets did not capture T2DM status). UDS v3 was implemented in March 2015 and contains the most recent data on AD patients in the NACC database while also specifying other diagnoses, such as T2DM. The data from each individual was obtained from trained clinicians or personnel in the form of an office meeting, home visit, or telephone visit. We worked with NACC personnel to create a custom data set from the large volume of data available to best fit our study design. Patients with AD as a primary etiologic diagnosis or cause of cognitive impairment were included in the custom data set. Patients with more than 1 diagnosis that could lead to cognitive impairment were excluded. Patients with other suspected forms of dementia or diabetes were also excluded from our study.
We compared 2 study groups: clinical AD dementia patients with T2DM and clinical AD dementia patients without T2DM or any other type of diabetes. Our custom UDS data set included all visits from participants who had 2 or more visits 1 year apart, had a diagnosis of primary clinical AD dementia at baseline (visit 1), and had known T2DM status. NACC cognitive assessments are typically done on an annual basis, which allows the assessment of cognitive changes over the course of at least a 1-year period, depending on the number of subsequent visits.
Our search criteria also narrowed the UDS v3 data set to data obtained from January 1, 2015, to June 1, 2021. For the diabetes group, visit 1 was defined as the first visit with a recorded diagnosis of T2DM. Our data selection was not aimed at capturing AD patients at the beginning of their experience with T2DM and focused only on visits in 2015 and later.
Demographic and clinical variables obtained for both groups included sex, ethnicity, race, marital status, body mass index (BMI; calculated as weight in kilograms divided by height in meters squared), diabetic medications taken, apolipoprotein E (APOE) alleles, Clinician Dementia Rating, subject’s age at the first visit, years of education, and number of visits recorded in the NACC database. The neuropsychological test battery is a form that is completed by ADRC staff to assess cognitive functions in patients. Selected tests from this form were used to provide longitudinal data to determine the differences in AD symptoms between the 2 study groups. The tests selected in our study were the Mini-Mental State Examination (MMSE), Montreal Cognitive Assessment (MoCA) total score, Craft Story 21 Recall (immediate and delayed), Benson Complex Figure Copy (immediate and delayed), Digit Span Forward test (correct trials and longest span), Category Verbal Fluency test (Animals and Vegetables), Trail Making Test, Multilingual Naming Test (MINT), and the Phonemic Verbal Fluency test. The Clinical Dementia Rating data from the UDS also provided a subjective measurement of subtle declines in cognitive function and at what age cognitive decline began, according to the clinician present at the time of the first visit.
Statistical analysis
Statistical analyses were performed using SPSS software, version 26 (IBM; Armonk, NY). The demographic variables were summarized with descriptive statistics (frequency, percentage, mean, standard deviation [SD]). The p values for between-group comparisons were calculated via chi-square analysis for categorical variables and independent-sample t tests for continuous variables. Independent-sample t tests were used to determine the differences in test scores at each visit between subjects in the AD with T2DM and AD-only groups. It was determined that performing any additional t tests for mean scores across all visits would not be done as the time between visits or the number of visits between each patient was not consistent and would thus show an unfair comparison of progression over time. Statistical significance was set at p < 0.05. A spaghetti plot was used to visualize the progression of the neuropsychological battery variables, with the mean values calculated by study group for each test score and then plotted over a timeline by epoch. The sample size was annotated for each epoch because the number of participants decreased at each subsequent epoch. Each test had the number of participants receiving each test at each epoch. Therefore, the sample size varied from field to field and epoch to epoch. Levene’s test for equality of variance was used to correct for the size difference between the AD-only and AD with T2DM groups to ensure the validity of p values for independent-sample t tests. Bonferroni correction was not applied because it was not felt to be necessary.
RESULTS
Overall demographics
The search criteria narrowed the UDS data set to 3,055 participants in total, 359 patients (12%) in the AD with T2DM group and 2,696 patients (88%) in the AD-only group (Table 1). The mean (SD) beginning age of cognitive decline (per clinician’s assessment) was statistically older in the AD with T2DM group (72.04 [8.47] years) than in the AD-only group (69.15 [10.33] years; p < 0.001). The AD with T2DM group had a significantly larger male population (187 of 359 [52.1%]) than the AD-only group (1,237 of 2,696 [45.9%]; p = 0.03). The percentage of individuals who were Hispanic/Latino was more than twice as high in the AD with T2DM group (14.8% [53/359]) compared to the AD-only group (183 of 2696 [6.8%]). This frequency is similar to that reported by the American Diabetes Association, with approximately 12.5% of Hispanics having a diabetes diagnosis as of 2018 [24]. In addition, the percentage of Black/African American, American Indian/Alaskan Native, and Asian patients were significantly higher in the AD with T2DM group, with more than double the percentages compared to the AD-only group (p < 0.001). Other clinical variables, current use of diabetic medications and APOE allele frequency, were statistically significantly different between the study groups (p < 0.001 and p = 0.002, respectively). There were also significant differences for current use of diabetic medications in the AD with T2DM group compared to the AD-only group, with 242 of 359 patients (67.4%) in the AD with T2DM group reporting current use of diabetic medications compared to only 16 of 2,696 patients (0.6%) in the AD-only group. Seventy-two percent of the cohort were receiving concomitant medications for AD (cholinesterase inhibitors or memantine) at some time [25].
Demographic and clinical characteristics of the study population*
Demographic and clinical characteristics of the study population*
*Data are presented as number of patients (%) unless otherwise noted. p values calculated with independent t test for continuous variables and chi-square for categorical variables. AD, Alzheimer’s disease; SD, standard deviation; T2DM, type 2 diabetes mellitus.
The mean BMI for each group at each annual visit was calculated and compared between study groups (Fig. 1). The difference in the BMI values between the two groups was statistically significant for visits 1–3 only but not for visits 4 and 5. The AD with T2DM group had a mean BMI of 28.4 at the first visit compared to 25.9 in the AD-only group.
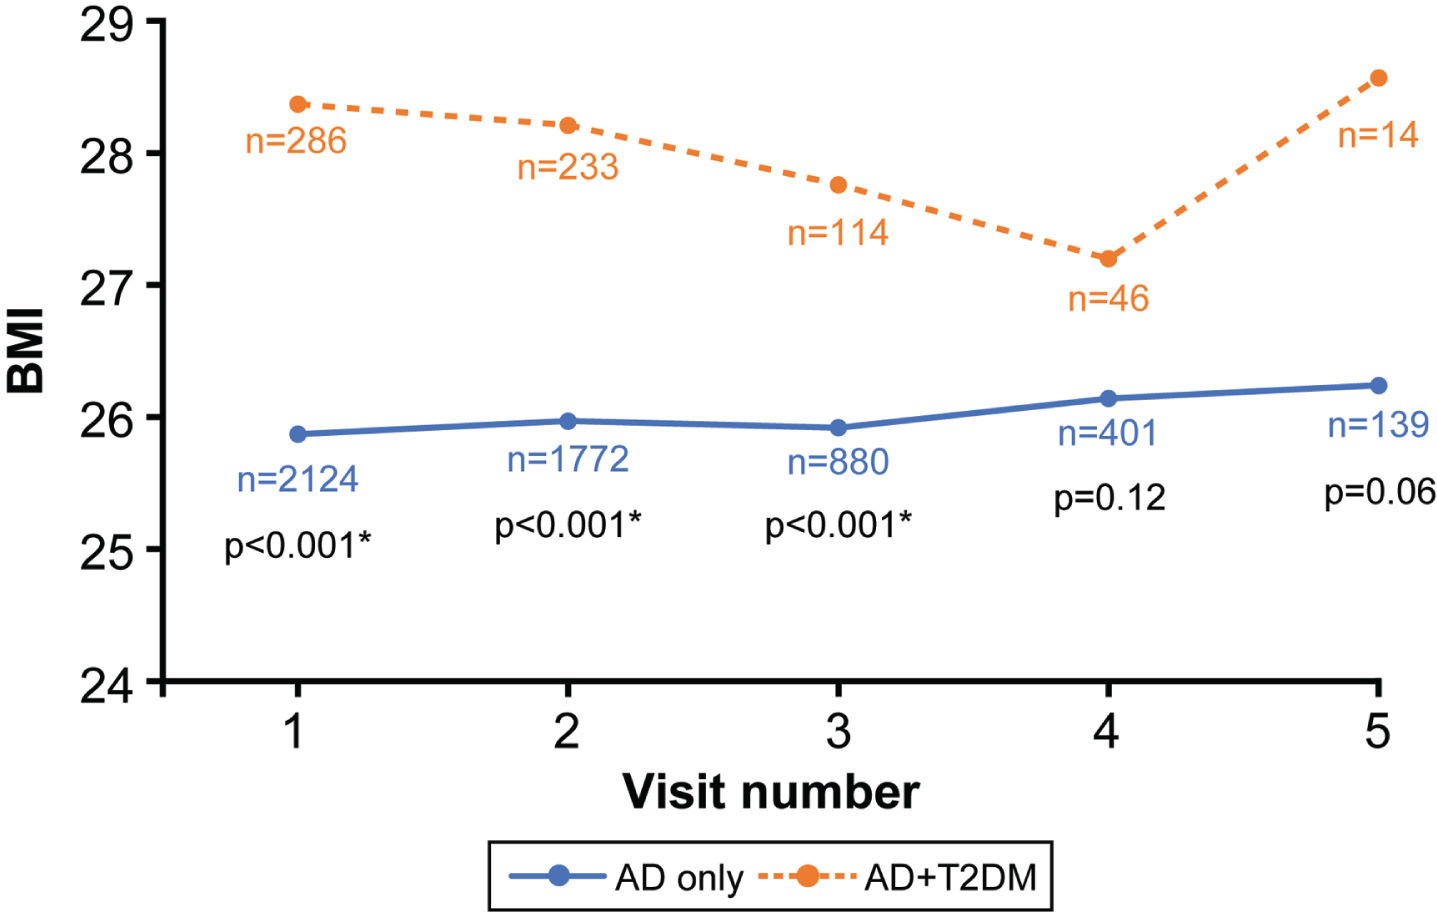
Mean body mass index (BMI) by annual visit. The numbers of patients (n) in each group are shown for each visit, and the p values are shown for the comparison between groups at each time point. *Indicates a statistically significant difference between disease groups. AD, Alzheimer’s disease; T2DM, type 2 diabetes mellitus. Used with permission from Barrow Neurological Institute, Phoenix, AZ.
The comparisons of the trends in the selected cognitive function test scores from visit to visit are shown in Figs. 2–5. Analysis of 16 different cognitive function test results showed no significant differences in baseline scores and follow-up scores at each subsequent visit between the AD with T2DM and AD-only groups.
Figure 2 shows the MMSE and MoCA scores for both groups. Over the course of 5 visits, it was observed that the MMSE trended toward a decline, but this was less apparent in the MoCA scores. The mean MMSE score for the AD with T2DM group was 22.2 at the first visit and 19.0 at the fifth, whereas the scores for the AD-only group were 21.8 at the first and 20.0 by the third (insufficient participants for the fourth and fifth visits). The mean MoCA score for the AD with T2DM group was 17.0 at the first visit, and 16.9 at the fifth visit, and the MoCA score for the AD-only group was 16.1 at the first visit and 14.1 at the fifth visit. However, although mean MoCA scores between the AD with T2DM at visits 1, 2, 4, and 5 were significantly different (p≤0.02) compared to the nondiabetic group, overall, there were no significant differences in the MoCA scores between the two groups over a 5-year period (p > 0.05). Similarly, with the MMSE scores, there were no significant differences noted over 5 years, with mean score changes from 21.8 to 20.0 in the AD with T2DM group (visit 1 to 3) and 22.2 to 19.0 in the AD-only group (visit 1 to 5).
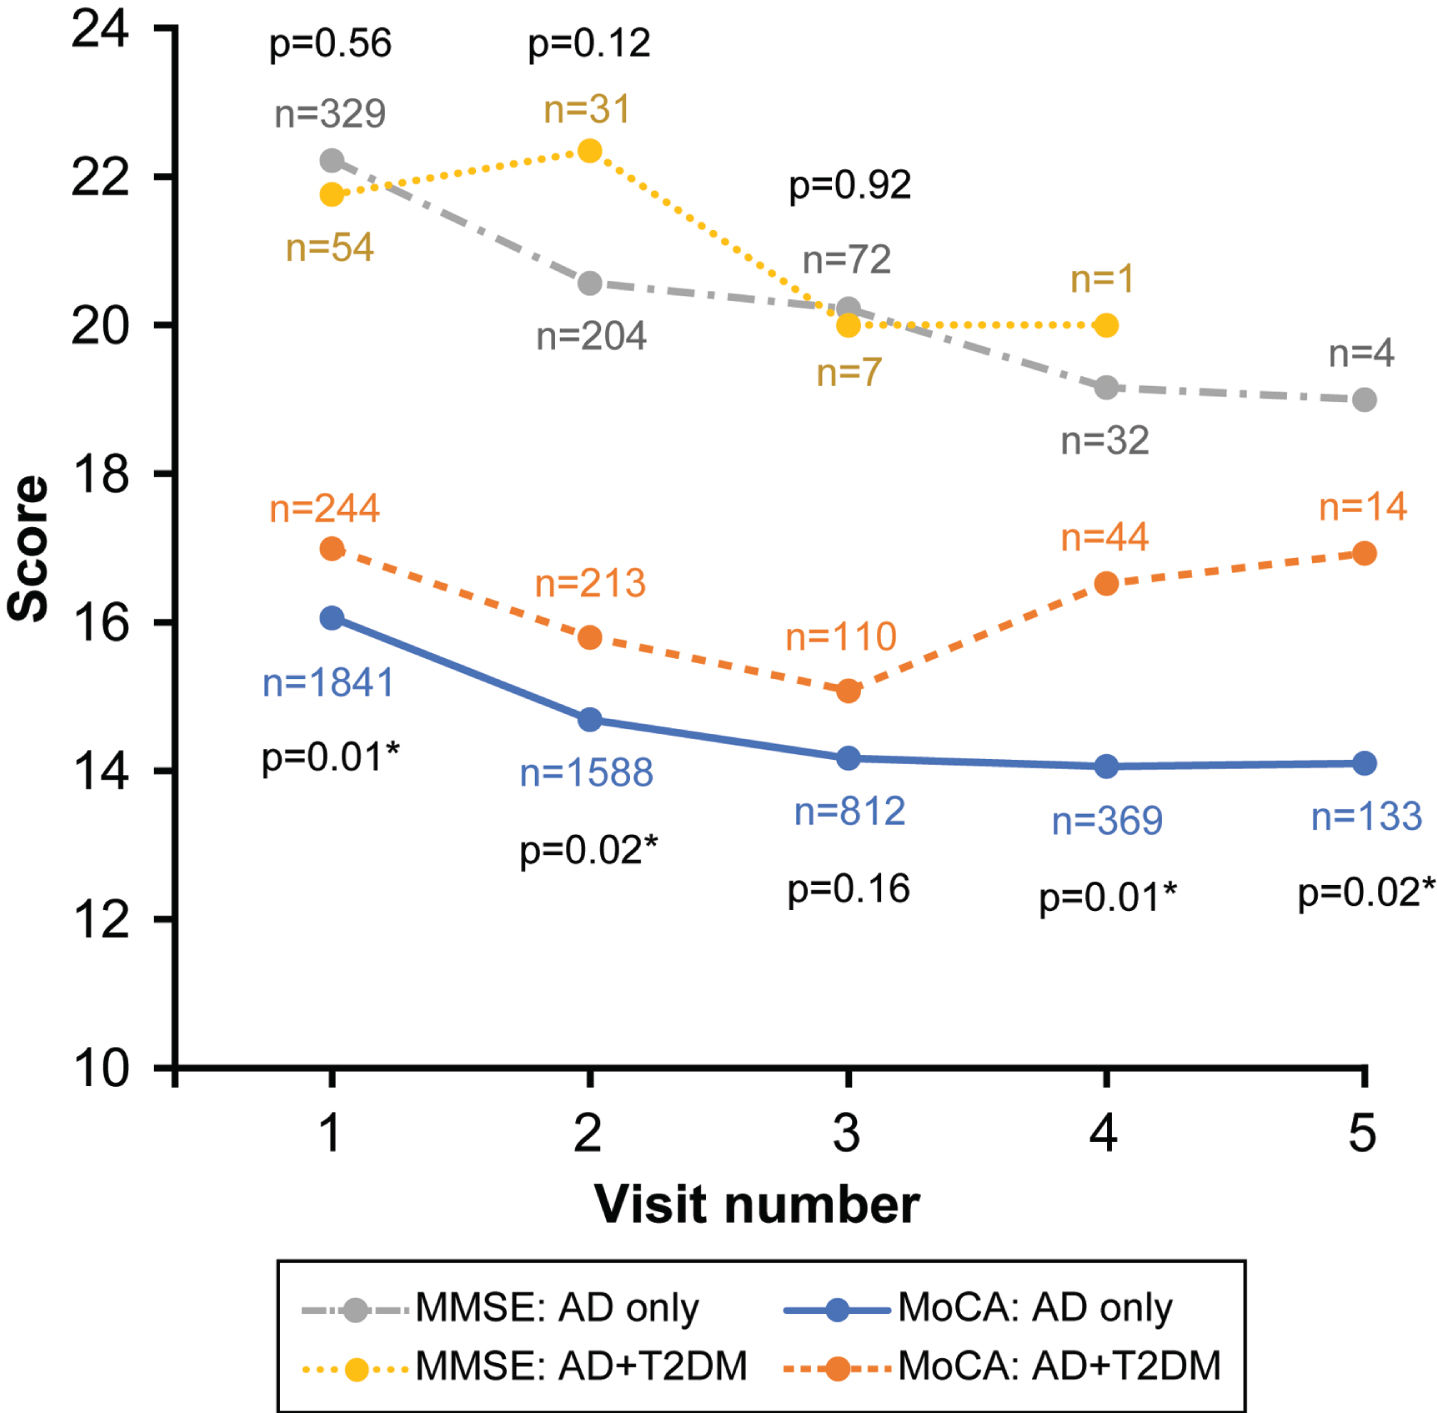
Mini-Mental Status Examination (MMSE) and Montreal Cognitive Assessment (MoCA) mean scores by annual visit. The number of patients (n) is indicated for each visit, and the p values are shown for the comparisons between groups at each time point. *Indicates a statistically significant difference between disease groups. AD, Alzheimer’s disease; T2DM, type 2 diabetes mellitus. Used with permission from Barrow Neurological Institute, Phoenix, AZ.
Figure 3 summarizes the results of the tests that examined participants’ language functioning. The goal of the Category Fluency Animals and Vegetables tests (Fig. 3A) is to name as many animals or vegetables as possible in 60 s. The animal naming test results changed from a mean of 12.1 to a mean of 10.6 in the AD with T2DM group and from 11.9 to 10.0 in the AD-only group during the study period. Similar results were observed for the vegetable-naming test in which the AD with T2DM group scored a mean of 7.8 at the first visit and 5.7 at the fifth visit, whereas the AD-only group’s mean scores were 7.4 and 5.4 on the first and fifth visits, respectively. Figure 3B and 3 C display the results on verbal fluency, also known as the Phonemic Verbal Frequency test, and the MINT. The specific tests chosen for this study included the correct number of F-words generated in 1 min (Fig. 3B), correct number of L-words generated in 1 min (Fig. 3B), and the total number of correct F- and L-words said by the patient (Fig. 3 C). The MINT score differed from a mean of 25.7 to 27.3 and from 24.4 to 21.9 over the course of 5 visits in the AD with T2DM and AD-only groups, respectively (Fig. 3C). The two groups differed significantly at each individual visit for the MINT (p≤0.02), but the rate of decline was not significantly different when comparing the groups over a 5-year period (p > 0.05).
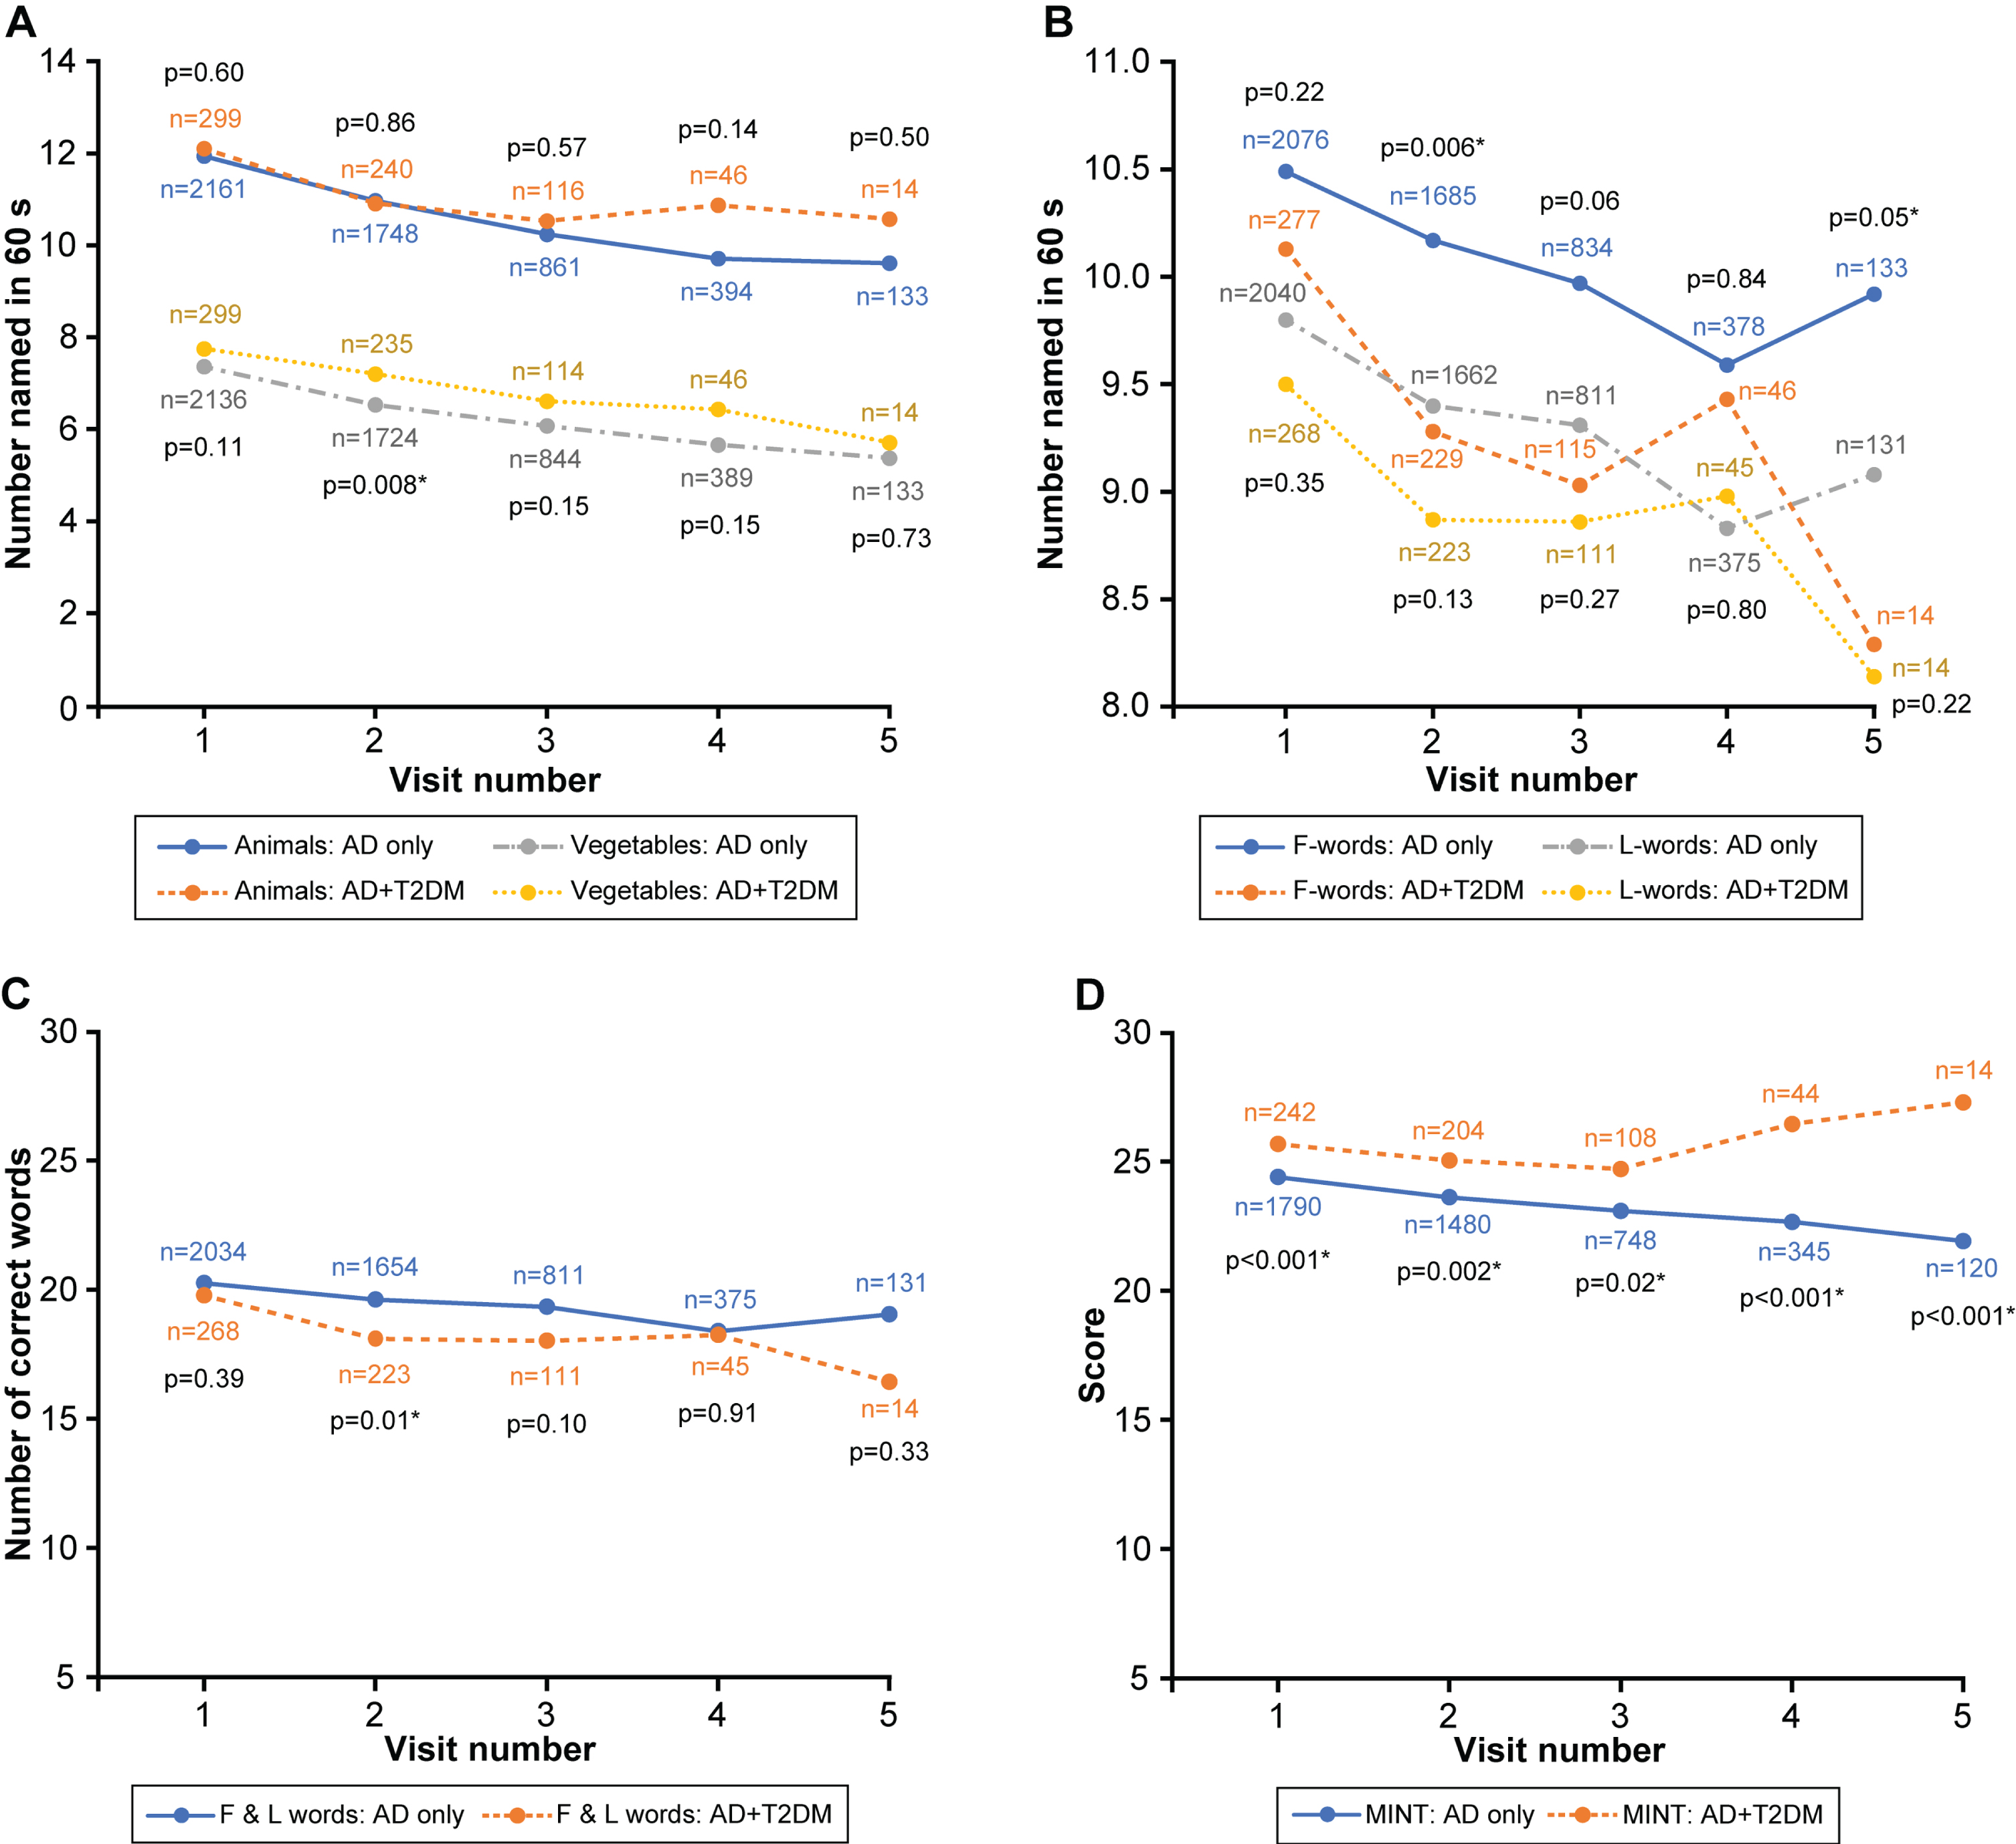
Mean Category and Phonemic Fluency test results by annual visit. A) Results for the Category Fluency tests (Animals subtest: top two curves; Vegetables subtest: bottom two curves). B) Results for Phonemic Fluency test for F and L words during a 60-second test period. C) Results for the Combined F- and L-word Phonemic test. D) Results for the Multilingual Naming Test (MINT). The numbers of patients (n) are indicated for each visit, and the p values are shown for the comparisons between groups at each time point. *Indicates a statistically significant difference between disease groups. AD, Alzheimer’s disease; T2DM, type 2 diabetes mellitus. Used with permission from Barrow Neurological Institute, Phoenix, AZ.
Figure 4 reports results for selected tests that examine frontal executive functioning. The Trail Making Test (Fig. 4A) involves 2 distinct parts. These tests assess the participant’s attention span. The AD with T2DM group scored a mean of 62.3 and 182.1 on the first visit for parts A and B, respectively, and 58.3 and 213.3 on the fifth visit. The AD-only group scored a mean of 61.9 and 181.2 on the first visit and 72.2 and 205.5 on the fifth visit. Figure 4B shows the results from the Digit Span forward test in which the participant must repeat back a sequence of numbers said to them; the number of correct trials and the length of the participant’s longest sequence is then recorded. This test serves as a measure of short-term memory and attention. Mean scores for the AD with T2DM group were 6.9 and 5.9 in the first visit for the correct number of trials and longest span, respectively, and were 6.5 and 5.9 at the fifth visit. The AD-only group’s mean scores were 6.7 and 5.8 at the first visit and 6.3 and 5.5 at the fifth for the correct number of trials and longest span, respectively. Figure 4 shows no overall difference in terms of score change for tests related to frontal executive function, both for individual visits and over a 5-year period (p > 0.05).

Attention and executive functions tests mean scores by annual visit. A) Results for the Trail Making Test (TMT), Part A (bottom two curves) and Part B (top two curves). B) Number of correct trials for the Digit Span Forward test (DSFT). The numbers of patients (n) are indicated for each visit, and the p values are shown for the comparisons between groups at each time point. AD, Alzheimer’s disease; T2DM, type 2 diabetes mellitus. Used with permission from Barrow Neurological Institute, Phoenix, AZ.
Verbal and nonverbal memory were tested with the Craft Story 21 Recall and the Benson Complex Figure Copy test (Fig. 5). Figure 5A shows the results of the Craft Story 21 Recall test, both immediate and delayed, in which participants are scored based on the number of story units recalled verbatim. The mean scores for the AD with T2DM group at the first visit were 10.2 and 5.1 for the immediate and delayed recall, respectively, while the fifth visit showed mean scores of 9.8 and 4.7. The AD-only group had mean scores of 8.7 and 4.1 at the first visit and 7.1 and 2.3 at the fifth visit for immediate and delayed recall, respectively. Both the immediate and delayed Craft Story 21 Recall tests at visits 1–4 showed statistically significant differences between groups at each annual visit (p≤0.02), but clinical differences were not significant over 5 visits (p > 0.05). The Benson Complex Figure Copy test assesses the participant’s ability to copy the Benson figure immediately and after a 10- to 15-min delay; results are shown in Fig. 5B. The mean scores for the AD with T2DM group at the first visit were 14.0 and 4.0 for the immediate and delayed recall, respectively, whereas the fifth visit showed mean scores of 13.3 and 4.8. The AD-only group had mean scores of 13.2 and 3.1 at the first visit and 12.8 and 2.0 at the fifth visit for immediate and delayed recall, respectively. Similar to the Craft Story 21 Recall, the delayed Benson Figure Copy test showed statistically significant differences between groups for each annual visit (p≤0.049), but clinical differences were not significant over 5 years (p > 0.05).
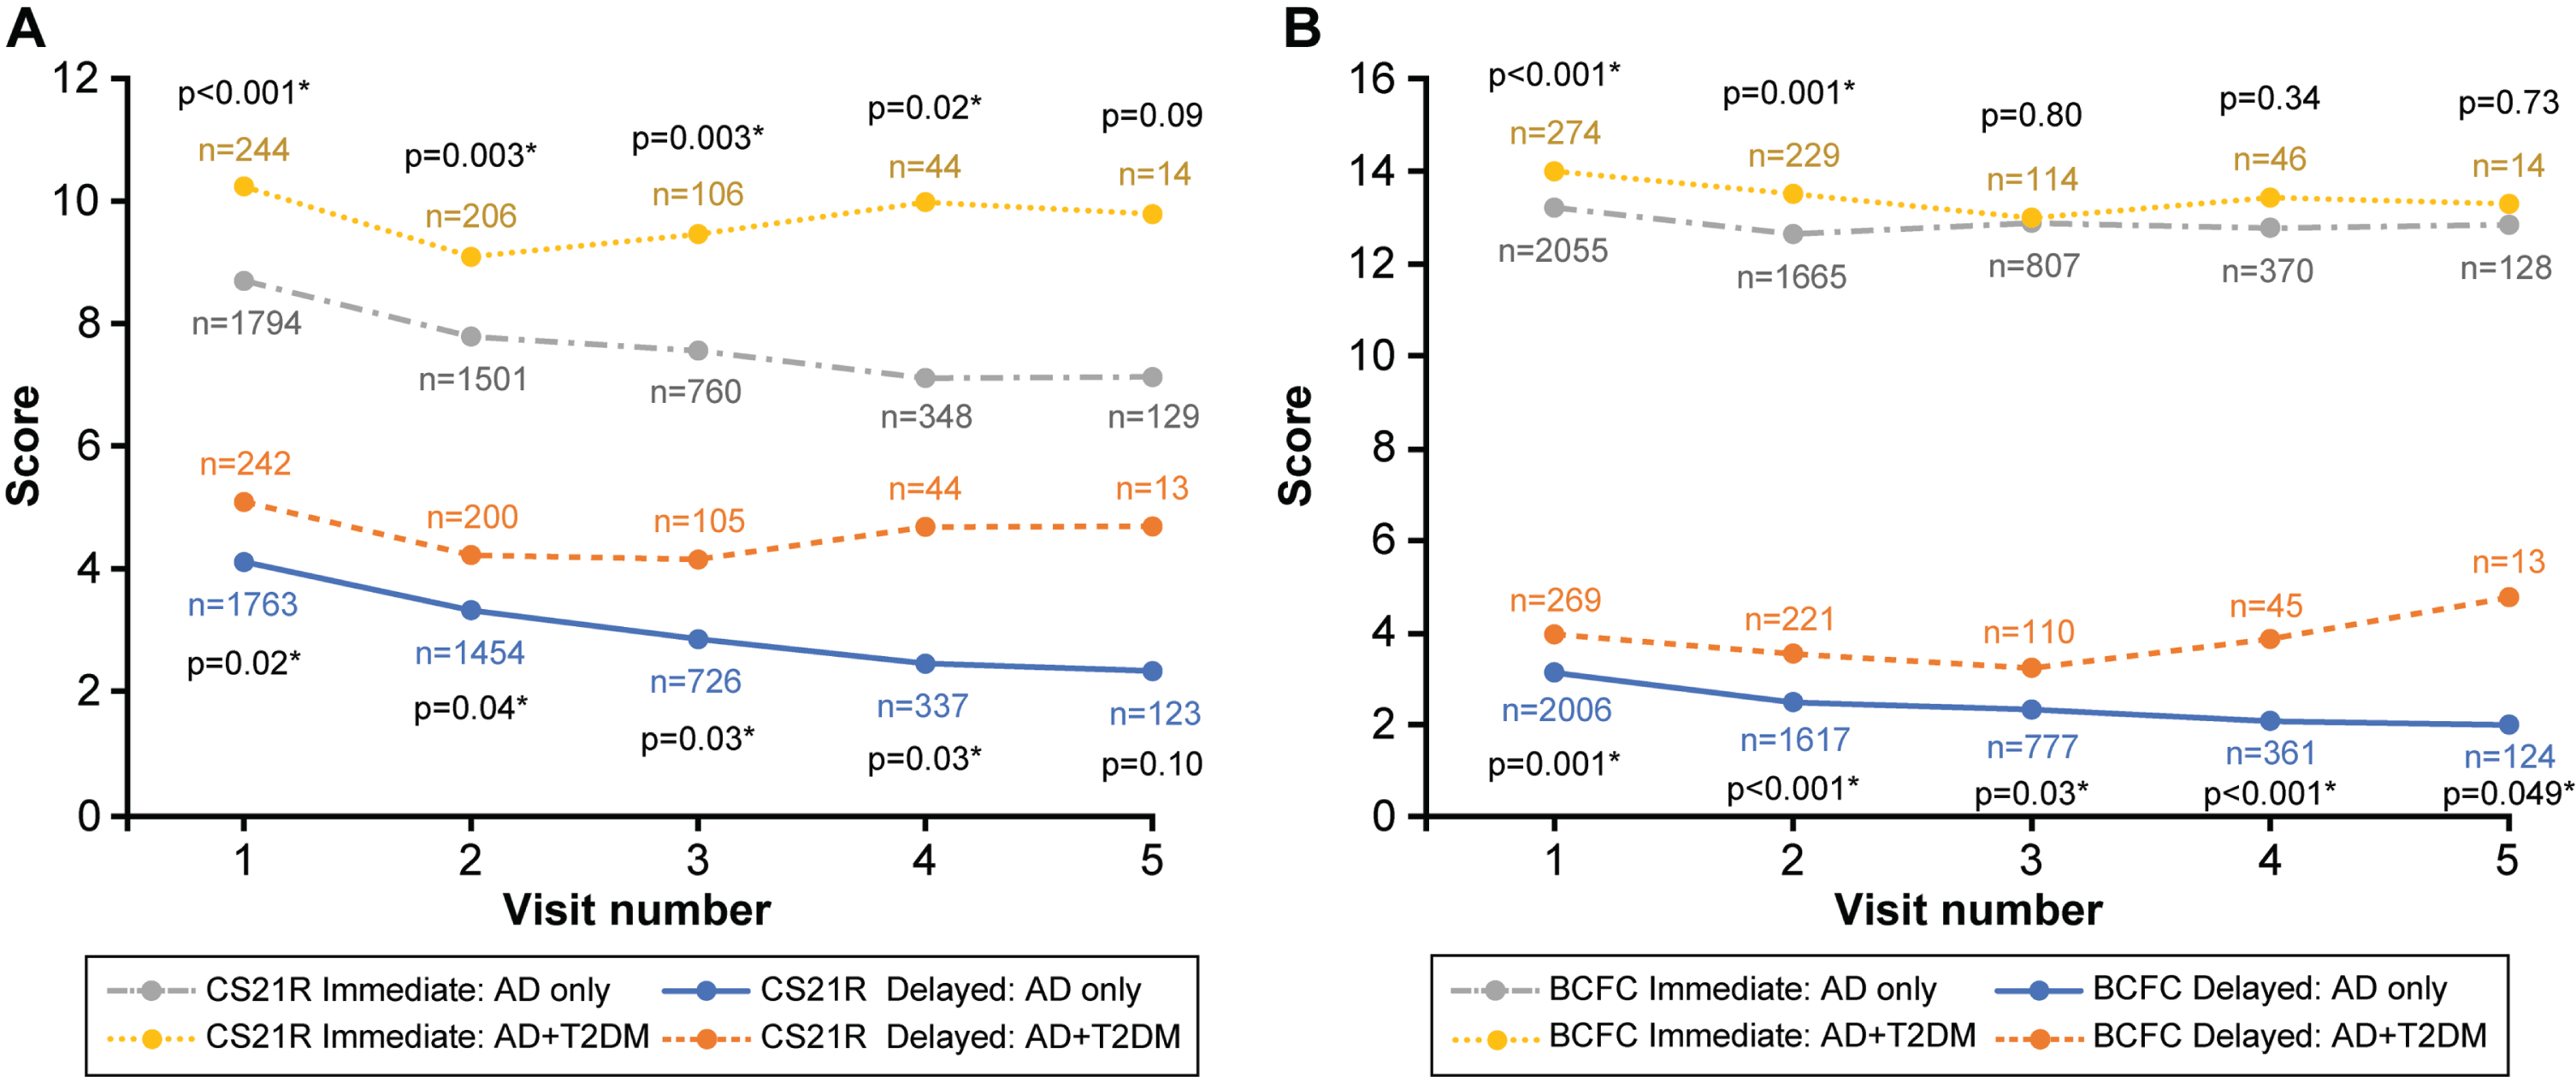
Mean results for memory tests by annual visit. A) Results for the Craft Story 21 Recall (CS21 R) test (immediate and delayed). B) Results for the Benson Complex Figure Copy (BCFC) test (immediate and delayed). The numbers of patients (n) are indicated for each visit, and the p values are shown for the comparison between groups at each time point. *Indicates a statistically significant difference between disease groups. AD, Alzheimer’s disease; T2DM, type 2 diabetes mellitus. Used with permission from Barrow Neurological Institute, Phoenix, AZ.
DISCUSSION
In this study, we found no differences in rates of cognitive decline between visits in patients with AD and T2DM compared to patients with AD with no diabetes. Further, we found that in some tests (e.g., Craft Story, MoCA, Category Fluency, Trails B, Benson Complex Figure), the AD with T2DM group had higher values at baseline. Multiple cognitive tests were included from the neuropsychological test battery scores that examined executive cognitive function, language function, and verbal and nonverbal memory. We used the UDS v3 data provided by the NACC to build the data set analyzed. These data were highly relevant to our study, as T2DM status was not recorded in previous versions of the UDS, making our data set the most recent longitudinal observational data available to test our hypothesis. The data included diagnostic, demographic, and clinical evaluations of dementia subjects from multiple visits used to trace the rate of progression of AD. In total, it appears that T2DM status did not seem to affect the overall scores or the rate of decline, suggesting the null hypothesis. One limitation of our study is that the sample size decreased at each epoch because the cohort was derived from a noninterventional study, and attrition or data capture might pose challenges. Specifically, are the lack of observed differences because of smaller sample sizes? The observed finding of the study could be related to attrition bias. Another limitation, given that this is a case-control cohort study, is the lack of depth of data regarding the management and duration of T2DM. Mechanistically, it is not clear why T2DM should not affect progression, and no sex differences were identified. However, the study was not controlled for age, race, APOE, or sex.
The AD with T2DM group accounted for 12% of the study population. Although this may not be a representative sample due to our study being a case-control study, according to the American Diabetes Association, 10.5% of the population in the United States has some type of diabetes [24]. The Centers for Disease Control and Prevention estimates that 90% to 95% of the diabetic population has T2DM [3]. Thus, it can be assumed that our T2DM group is representative of the real-life situation in our AD sample population. That said, the imbalance between the number of AD patients with diabetes (12 %) versus without diabetes (88%) might skew the results.
We conducted this study because previous studies investigating the increased risk of developing AD in T2DM patients [6, 26] and animal studies [27–29] have yielded mixed results. In these previous studies, AD with T2DM animal models were compared to wild-type models to demonstrate the progression of cognitive decline. In one study, a Morris water maze investigated the spatial reference of double transgenic APP/PS1-ob/ob mice. The APP/PS1-ob/ob mice performed worse overall in spatial reference memory compared to the wild-type, APP/PS1-only, and ob/ob-only littermates [27]. Impaired plasticity of the neuronal synapses in the hippocampus, greater expression of inflammatory markers, and increased deposition of Aβ protein have also been found in other models of AD with diabetes, and these models have shown statistically significant decreases in cognitive function [28]. Similarly, AD pathology has also been shown to exacerbate T2DM in mouse models [29].
Other studies have shown evidence against the relationship between AD and T2DM for cognitive decline. A meta-analysis of longitudinal studies with autopsy-confirmed AD patients reported that vascular mechanisms played a larger role in cognitive decline than AD-specific pathology, and a putative role for DM effects on the brain might be mediated through vascular mechanisms [30]. Another study also concluded that the underlying pathophysiology of mild cognitive impairment and dementia in T2DM involves neurodegenerative and vascular factors that are currently not defined well enough to identify a specific relationship [19]. The ACCORD Memory in Diabetes (MIND) study sought to directly determine if the level of glycemic control affects cognitive performance over time in 2977 subjects with T2DM. The study looked at Digit Symbol Substitution test and total brain volume as measured by MRI [31]. Cukierman-Yafee et al. showed that there was an inverse relationship between cognitive function and glycemic control (measured by HbA1c). However, after 40 months of follow-up, there was no significant difference in cognitive function between the intensive and standard treatment arms [32]. Similar observations were made by Palta et al. [26] who investigated the Ginkgo Evaluation of Memory Study (GEMS) cohort. That study conducted memory, language, psychomotor speed, and other executive function tests in a population aged 72 to 96 years with a median follow-up of 6.1 years. Investigators observed that individuals with diabetes of any type had lower baseline executive function scores compared to individuals without diabetes, but no significant differences in the rate of decline were found [26]. The populations included in these studies were T2DM patients at risk for cognitive decline, but the studies differed from ours insofar as the study subjects were not confirmed and diagnosed AD patients. Differences between our findings and those of other studies might be due to differences in measured outcomes or different populations. Our study did not address the risk of developing AD among patients with T2DM. Rather, it addressed cognitive trajectory in AD.
Due to the proposed but undefined relationship between T2DM and AD, diabetic medications are also being investigated as another modality of treatment for AD. A 2019 observational study examined the risk of developing AD in 1289 dementia-free patients. The participants were divided into 4 groups: euglycemic, prediabetes, untreated diabetes, and treated diabetes. Biomarkers were measured from cerebrospinal fluid obtained from lumbar puncture and then analyzed with Elecsys immunoassays (Roche, Basel, Switzerland). The results showed that the untreated diabetes group had statistically significantly greater p-tau, t-tau, and p-tau/Aβ42 levels compared to the other groups [33]. Specific medications, such as vildagliptin and memantine, have been shown to decrease the levels of amyloid-β protein precursor and phosphorylated tau in diabetic rats [34]. Furthermore, intranasal insulin delivery has been shown to improve the attention and functional status in patients with mild cognitive impairment and early AD [35]. It should be noted that our AD with T2DM group was a relatively well-treated population, with 67.4% reporting the use of diabetic medication. These findings may be consistent with those of the numerous failed clinical trials of anti-diabetic drugs like pioglitazone, rosiglitazone, and insulin in AD and mild cognitive impairment, such as the TOMMOROW trial [36].
A prospective study by Scarmeas et al. [37] compared the rate of progression of AD with physical activity and divided subjects into 3 groups (light, moderate, and vigorous activity). However, that study looked mainly at survival rates of participants. It was observed that, when compared to physically inactive AD patients, the mortality risk was reduced by 76% in the moderate physical activity group and by 80% in the high physical activity group. That study also reported no association between physical activity and rate of cognitive decline after 208 participants in the study completed at least 2 cognitive evaluations [37].
In this study, we focused solely on the presence of T2DM as a factor that could affect cognitive decline in AD. Other demographic variables, such as APOE alleles or whether patients were using diabetic medications, were not used to group subjects. One limitation of our study is that the number of subjects gets smaller with each epoch, which increases variance. We found no significant differences overall in the UDS v3 test scores analyzed in the present study. Thus, our central hypothesis that T2DM would affect cognitive decline in AD patients from visit to visit was rejected, and the alternative hypothesis that T2DM does not affect cognitive decline in AD patients seems more likely to be accurate. Future study designs could incorporate these and other variables to identify possible differences in cognitive decline progression in AD patients.
Footnotes
ACKNOWLEDGMENTS
We thank the staff of Neuroscience Publications at Barrow Neurological Institute for assistance with manuscript preparation.
The National Alzheimer’s Coordinating Center (NACC) provided the data collection required to conduct this study. The NACC database is funded by the National Institute on Aging (NIA)/National Institutes of Health Grant U01 AG016976. NACC data are contributed by the NIA-funded Alzheimer’s Disease Research Centers: P30 AG019610 (PI Eric Reiman, MD), P30 AG013846 (PI Neil Kowall, MD), P50 AG008702 (PI Scott Small, MD), P50 AG025688 (PI Allan Levey, MD, PhD), P50 AG047266 (PI Todd Golde, MD, PhD), P30 AG010133 (PI Andrew Saykin, PsyD), P50 AG005146 (PI Marilyn Albert, PhD), P50 AG005134 (PI Bradley Hyman, MD, PhD), P50 AG016574 (PI Ronald Petersen, MD, PhD), P50 AG005138 (PI Mary Sano, PhD), P30 AG008051 (PI Thomas Wisniewski, MD), P30 AG013854 (PI M. Marsel Mesulam, MD), P30 AG008017 (PI Jeffrey Kaye, MD), P30 AG010161 (PI David Bennett, MD), P50 AG047366 (PI Victor Henderson, MD, MS), P30 AG010129 (PI Charles DeCarli, MD), P50 AG016573 (PI Frank LaFerla, PhD), P50 AG005131 (PI James Brewer, MD, PhD), P50 AG023501 (PI Bruce Miller, MD), P30 AG035982 (PI Russell Swerdlow, MD), P30 AG028383 (PI Linda Van Eldik, PhD), P30 AG053760 (PI Henry Paulson, MD, PhD), P30 AG010124 (PI John Trojanowski, MD, PhD), P50 AG005133 (PI Oscar Lopez, MD), P50 AG005142 (PI Helena Chui, MD), P30 AG012300 (PI Roger Rosenberg, MD), P30 AG049638 (PI Suzanne Craft, PhD), P50 AG005136 (PI Thomas Grabowski, MD), P50 AG033514 (PI Sanjay Asthana, MD, FRCP), P50 AG005681 (PI John Morris, MD), and P50 AG047270 (PI Stephen Strittmatter, MD, PhD).
Portions of this manuscript were presented as an abstract at the Alzheimer’s Association International Conference, July 31–August 4, 2022, in San Diego, California.