



Abstract
Background:
Pilot study showed that Alzheimer’s disease resemblance atrophy index (AD-RAI), a machine learning-derived MRI-based neurodegeneration biomarker of AD, achieved excellent diagnostic performance in diagnosing AD with moderate to severe dementia.
Objective:
The primary objective was to validate and compare the performance of AD-RAI with conventional volumetric hippocampal measures in diagnosing AD with mild dementia. The secondary objectives were 1) to investigate the association between imaging biomarkers with age and gender among cognitively unimpaired (CU) participants; 2) to analyze whether the performance of differentiating AD with mild dementia from CU will improve after adjustment for age/gender.
Methods:
AD with mild dementia (n = 218) and CU (n = 1,060) participants from 4 databases were included. We investigated the area under curve (AUC), sensitivity, specificity, and balanced accuracy of AD-RAI, hippocampal volume (HV), and hippocampal fraction (HF) in differentiating between AD and CU participants. Among amyloid-negative CU participants, we further analyzed correlation between the biomarkers with age/gender. We also investigated whether adjustment for age/gender will affect performance.
Results:
The AUC of AD-RAI (0.93) was significantly higher than that of HV (0.89) and HF (0.89). Subgroup analysis among A + AD and A- CU showed that AUC of AD-RAI (0.97) was also higher than HV (0.94) and HF (0.93). Diagnostic performance of AD-RAI and HF was not affected by age/gender while that of HV improved after age adjustment.
Conclusions:
AD-RAI achieves excellent clinical validity and outperforms conventional volumetric hippocampal measures in aiding the diagnosis of AD mild dementia without the need for age adjustment.
INTRODUCTION
Developing a biomarker for Alzheimer’s disease (AD) that can be widely applied in clinical practice has become increasingly important in recent years. The 2018 research framework defines AD by biomarkers, namely amyloid (A) and tau (T), with or without neurodegeneration (N), rather than by clinical syndrome [1]. This shift in paradigm facilitates early diagnosis and prevention. Currently, although amyloid and tau can be detected in vivo by positron emission tomography (PET) (e.g., florbetapir, flortaucipir) or cerebrospinal fluid (CSF) (e.g., amyloid-beta [Aβ]42/40, phospho-tau [p-tau]181), its use is limited by its inaccessibility, high cost, and/or invasive nature. There is an urgent need to develop simple and safe biomarkers (e.g., plasma, structural MRI) of AD that can aid the diagnosis, prognostication, and monitoring of disease progress/treatment response in clinical practice.
In the AT(N) framework, (N) correlates best with severity of cognitive impairment and rate of cognitive decline among the three biomarkers [1]. Although it is non-specific for AD and may be present in other brain diseases, previous studies showed that presence of neurodegeneration may still be able to aid the diagnosis of AD by stratifying participants’ risk of having AD, thereby guiding subsequent management decisions. Current conventional methods of capturing neurodegeneration include MRI, flurodeoxyglucose (FDG) PET, and CSF total tau, neurofilament light chain (NfL), or neurogranin, and plasma total tau, NfL, and glial fibrillary acidic protein (GFAP). Although plasma-based neurodegeneration biomarkers seem to be the most easily accessible when compared with other modalities, structural MRI has the additional benefit of ruling out other cognitive disorders (e.g., cerebrovascular disease, tumor, hydrocephalus) that may account for the cognitive symptoms and are not easily detectable by plasma biomarkers. Note further that MRI is essential to rule out concurrent severe small vessel disease before considering whether anti-amyloid therapy can be used or not for prodromal AD [2]. Overall, structural MRI is considered a first-line investigation in the work-up of cognitive disorders [3]. Deriving a better MRI-based neurodegeneration biomarker of AD will aid the management of participants presenting with cognitive disorders.
Visual rating of medial temporal lobe atrophy (MTA) on MRI has been used to aid the diagnosis of AD dementia over the past few decades. Although it can be easily applied, it has low reliability among inexperienced raters [4]. It is also not applicable for monitoring disease progression. As processing technology advances, it is now possible to automate the quantification of MRI features. Studies have shown that volumetric hippocampal measures are more accurate in diagnosing AD dementia than visual assessment and can be used in research settings to monitor disease progression [5, 6]. Some have further translated automated volume try technology into software applicable in busy clinical practice, which allow easy uploading of the images for automated processing and rapid generation of the results back to end-users (e.g., radiologist) [7, 8]. With the rapid development of quantitative imaging biomarkers, international guidelines (e.g., 5-phase validation framework) have been proposed lately to guide the development and translation of novel biomarkers so as to ensure clinical validity and applicability [7, 10].
In recent years, increasing studies have explored various MRI-based machine learning methods in aiding AD classification [11, 12]. Some studies showed that machine learning-derived structural MRI-based algorithms could achieve better diagnostic and prognosticate performance when compared with volumetric hippocampal measures in research settings [13, 14]. However, the translation potential of these algorithms depends not only on the clinical validity, but also on the complexity of generating the machine learning-derived measures, clinical interpretability of these measures, MRI feature extraction, and processing tools. [12, 16]. Our group developed an algorithm based on support vector machine using volumetric data of predefined brain regions, which can generate an easy-to-understand index (AD-resemblance atrophy index, AD-RAI) that reflects the level of similarity in brain atrophy pattern of the tested individual with that of AD dementia participants. Early studies showed that AD-RAI achieved better diagnostic performance over volumetric hippocampal measures for AD at moderate to severe dementia stage [16] and MCI stage [14], respectively. Technical validity was confirmed by its correlation with CSF total tau level [16, 17]. Inter-scan and test-retest reliability in the generation of AD-RAI was excellent [16, 18]. In view of these positive findings, we further translated the algorithm into a clinical applicable software where AD-RAI can be generated automatically back to the end-user via a cloud platform within 10 min [14].
In this study, we aimed to investigate the diagnostic performance of AD-RAI particularly for AD mild dementia using a large multi-database cohort of probable AD at mild dementia stage and cognitively unimpaired (CU) participants. We particularly selected those with mild dementia, i.e., stage 4 of the AD clinical continuum [1] because our earlier studies recruited mostly AD participants with moderate to severe dementia (i.e., clinical stage 5 and 6) and with CU to MCI (i.e., clinical stage 1 to 3) [16]. Note that past studies showed that performance of atrophy-based biomarkers would decrease when applied to less severe clinical stage [19]. The diagnostic performance of AD-RAI in AD mild dementia (i.e., clinical stage 4) remains uncertain. Noteworthy that majority of individuals with cognitive disorders attending memory clinic in many regions for the first time still fall into this stage. Concurrently in this study, we compared the performance of AD-RAI with volumetric hippocampal measures, which are considered the best and most commonly used quantitative MRI biomarkers for AD [20]. In addition, we also investigated the association between AD-RAI with age and gender in normal people and whether the diagnostic performance will improve after adjustment to age and gender as secondary aims [9, 11].
METHODS
Participants
Participants were selected from four databases (n = 4,124), including three publicly available databases (the Alzheimer’s Disease Neuroimaging Initiative (ADNI), http://adni-info.org [21]; the Australian Imaging, Biomarker & Lifestyle Flagship Study of Ageing (AIBL), http://aibl.csiro.au [22]; the Open Access Series of Imaging Studies (OASIS), http://oasis-brains.org [23]) and The Chinese University of Hong Kong - Screening for Early Alzheimer’s Disease (CU-SEEDS) study (n = 119) [14]. The CU-SEEDS study (ClinicalTrials.gov Identifier: NCT05655650) was approved by the local ethics committee and the reference number is CRE-2017.254. For this study, we focused on ADNI (ADNI 1, ADNI 2, ADNI 3, and ADNI GO; n = 2,045), AIBL (n = 862), and OASIS-3 (n = 1,098) with data collected from 2011 to 2018. Among potential eligible participants having a clinical diagnosis of probable AD, we included those aged 65 to 90 years with Clinical Dementia Rating scale (CDR) of 1 (i.e., mild dementia). We included participants who have high-quality volumetric MRI data with T1W scans. We also selected CU participants of a similar age range to AD participants with a CDR of 0 or without apparent cognitive complaints. A total of 218 probable AD with mild dementia and 1,060 CU participants were eventually recruited.
To derive optimal cutoffs for hippocampal measures (HV and HF), we divided the participants into a training and validation cohort. We defined amyloid (A) status based on available CSF or PET [24] (http://www.oasis-brains.org/files/OASIS-3_Imaging_Data_Dictionary_v1.5.pdf, Supplementary text). We selected only those with known amyloid status for the training cohort (i.e., A + AD, n = 68; A- CU = 221). For the remaining participants in the validation cohort, among participants labeled as having probable AD (n = 150), 45 participants were A+, while the amyloid status of the remaining 105 probable AD participants was unknown. Among all the CU participants (n = 839) in the validation cohort, 157 participants were A-, while the amyloid status of the remaining 682 participants was unknown. Among potential eligible participants with known amyloid status, those who were labeled as probable AD but with A- status and those who were CU yet with A + status were further excluded from this study.
MRI acquisition and volumetric analysis
Both ADNI and AIBL MRI scans followed the ADNI scanning protocol (http://adni.loni.usc.edu/methods/documents/mri-protocols/) [25]. OASIS-3 scans are described elsewhere (http://www.oasis-brains.org/files/OASIS-3_Imaging_Data_Dictionary_v1.5.pdf), and that of CU-SEEDS are described in a previous study [14]. The volumetric MPRAGE/IR-SPGR data were downloaded for processing. All 3D T1W images were analyzed using the AccuBrain software system, which is an automated computational tool that can be adapted to a cloud platform available for commercial or research use, where a report consisting of AD-RAI and volumetric measures of multiple brain regions can be generated automatically back to the end-users within 10 min. In this study following data were extracted for further analysis: AD-RAI, HV, and hippocampal fraction (HF) [26].
AD-RAI is a continuous variable that ranges from 0 to 1. The index was rounded up to 3 decimal places. The closer the index to 1 (e.g., 0.999), the more resemblance is the atrophy pattern of the participant’s brain to that of AD brain. Based on earlier studies, the optimal cutoff of AD-RAI for the classification of AD dementia is≥0.500. Details on the development of AD-RAI were described earlier [17]. In brief, the machine learning model was trained on an in-house training dataset consisting of 400 participants (180 probable AD dementia participants and 220 CU participants) where multiple brain regional volumetric data were used [16, 17]. Since brain atrophy increases with normal aging, the confounding factor of age was accounted for in the development of the algorithm. To adjust for inter-participant variation in head size, we divided HV by the total intracranial volume (ICV) to give the HF [8, 27]. HV was the sum of left and right HV. Accuracy of AccuBrain in quantifying HV was validated by comparing HV quantified manually based on an international harmonized protocol with the HV generated by Accubrain, which showed a Dice similarity coefficient of 0.89 (p = 0.81) [8]. Accu Brain obtained medical device approval for clinical use by China NMPA and CE mark.
Statistical analysis
We used the IBM SPSS Software version 26.0 (SPSS, Inc., Chicago, IL, USA) to analyze the data. We tested the normality of distribution using the Shapiro-Wilk test. We compared continuous variables using the Mann-Whitney U test for non-normally distributed data (age, years of education, MMSE, AD-RAI) and the student t-tests for normally distributed data (HV and HF) according to the results of normality of distribution. All statistical tests were two-tailed with a significance set at p < 0.05.
Optimal cutoffs were derived based on the Youden index in MedCalc v19.6.4 (MediCalc Software bvba, Mariakerke, Belgium) for HV and HF from the training cohort [28]. For AD-RAI, we used the predefined cutoff≥0.500 based on the findings from previous studies. We obtained performance metrics of AD-RAI, HV, and HF in the validation cohort by evaluating the area under the curve (AUC), sensitivity, specificity, positive predictive value (PPV), negative predictive value (NPV), and balanced accuracy. The Delong test in MedCalc v19 was performed to compare the ROC curve among the various imaging biomarkers [29]. We also conducted subgroup analysis among those with and without amyloid status, and among 3 (ADNI, AIBL, OASIS) of the 4 databases separately.
For one of the secondary aims, among CU participants, we selected a subgroup (n = 406) who were A- based on CSF or PET to investigate the correlation between AD-RAI and demographic variables (gender and age). We performed correlation analysis (Pearson’s Correlation Coefficients or Spearman’s Rank Correlation Coefficients) between imaging metrics (AD-RAI, HV, HF) and age if the data was normally distributed based on the Shapiro-Wilk test. The linear regression was used if the correlation was significant at a 0.05 level (2-tailed).
For the other secondary aim, to explore whether the diagnostic performance could be affected by age and gender and to compare performance between that with and without adjustment for these covariates, the logistic regression model was used for the aforementioned covariates. The Delong test was performed to compare the ROC curve between the raw score and the adjusted score [29]. In exploring the difference in performance between adjusted and unadjusted cutoffs, we included all AD and CU participants who had known amyloid status (i.e., A + AD, n = 113 and A- CU, n = 378).
RESULTS
The demographic characteristics, MMSE, AD-RAI, HV, and HF are presented in Table 1. AD-RAI of probably AD with mild dementia participants was significantly higher than that of CU participants (p < 0.001).The performance metrics of HV and HF derived from the training cohort are summarized in Supplementary Table 1.
Demographic data and neuropsychological scores for all participants
AD, Alzheimer’s disease; AD-RAI, Alzheimer’s disease resemblance atrophy index; CU, cognitive unimpaired; HV, hippocampal volume; HF, hippocampal fraction; IQR, interquartile range; MMSE, Mini-Mental State Examination; SD, standard deviation. *Mann-Whitney U test.†Pearsonχ2 test. ‡Student t test.
Diagnostic performance in the validation cohort
AD-RAI performed significantly better than hippocampal measures in diagnosing probable AD mild dementia from CU participants in the total validation cohort [AUC 0.93 (95% CI, 0.91–0.94), sensitivity 90.67%, specificity 80.57%, balanced accuracy of 85.62% ] (p = 0.008, p < 0.001, and p = 0.9995 for AD-RAI versus HV, AD-RAI versus HF, and HV versus HF, respectively, Delong test)(Fig. 1A, Table 2A), as well as in subgroup analysis among amyloid-known and unknown cohorts (p < 0.05, Delong test). Performance metrics of AD-RAI among the amyloid-known validation cohort were as follows: AUC of 0.97 (95% CI, 0.94–0.99), sensitivity of 95.56%, specificity of 84.71%, and balanced accuracy of 90.13% (Fig. 1B, Table 2B). Subgroup analysis on individual databases also showed a similar trend in the performance of AD-RAI (Supplementary Table 2).
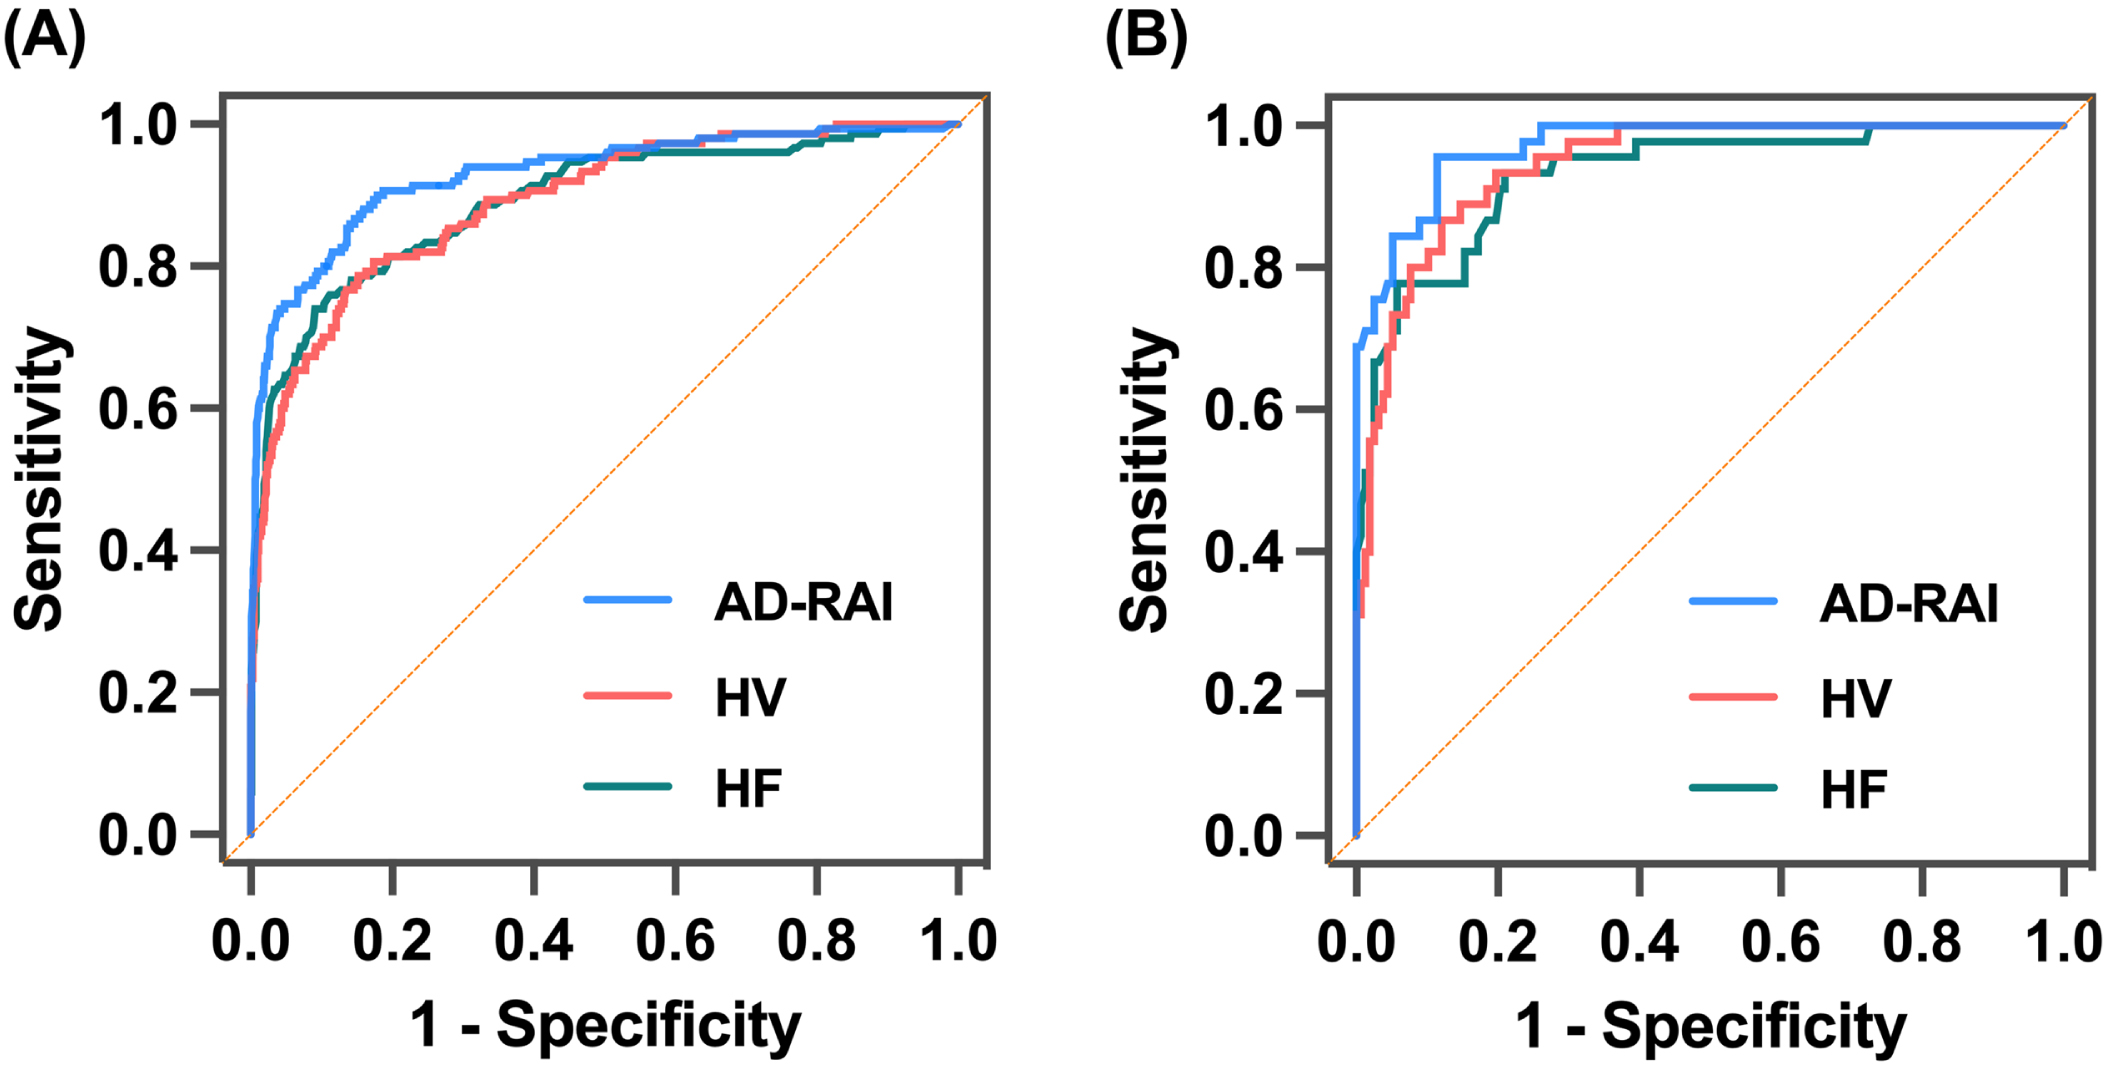
The ROC curves of AD-RAI, HV and HF in total validation cohort (A) and amyloid-known validation cohort (B). AD-RAI, Alzheimer’s disease resemblance atrophy index; HV, hippocampal volume; HF, hippocampal fraction.
The ROC analysis results of AD-RAI, HV and HF in total validation cohort
AD-RAI, Alzheimer’s disease resemblance atrophy index; AUC, area under curve; CI, confidence interval; HV, hippocampal volume; HF, hippocampal fraction; NPV, negative predictive value; PPV, positive predictive value; ROC, receiver operating characteristic. Different letters indicate a significant difference using DeLong test (p < 0.01).
Correlation between imaging metrics and demographic variables (age and gender)
Among A- CU participants, AD-RAI was not associated with age (p = 0.676) (Fig. 2A), while HV/HF showed a significantly negative correlation with age in both males and females (p < 0.05), in that older age was associated with a lower HV/HF among A- CU participants (Fig. 2B, C).
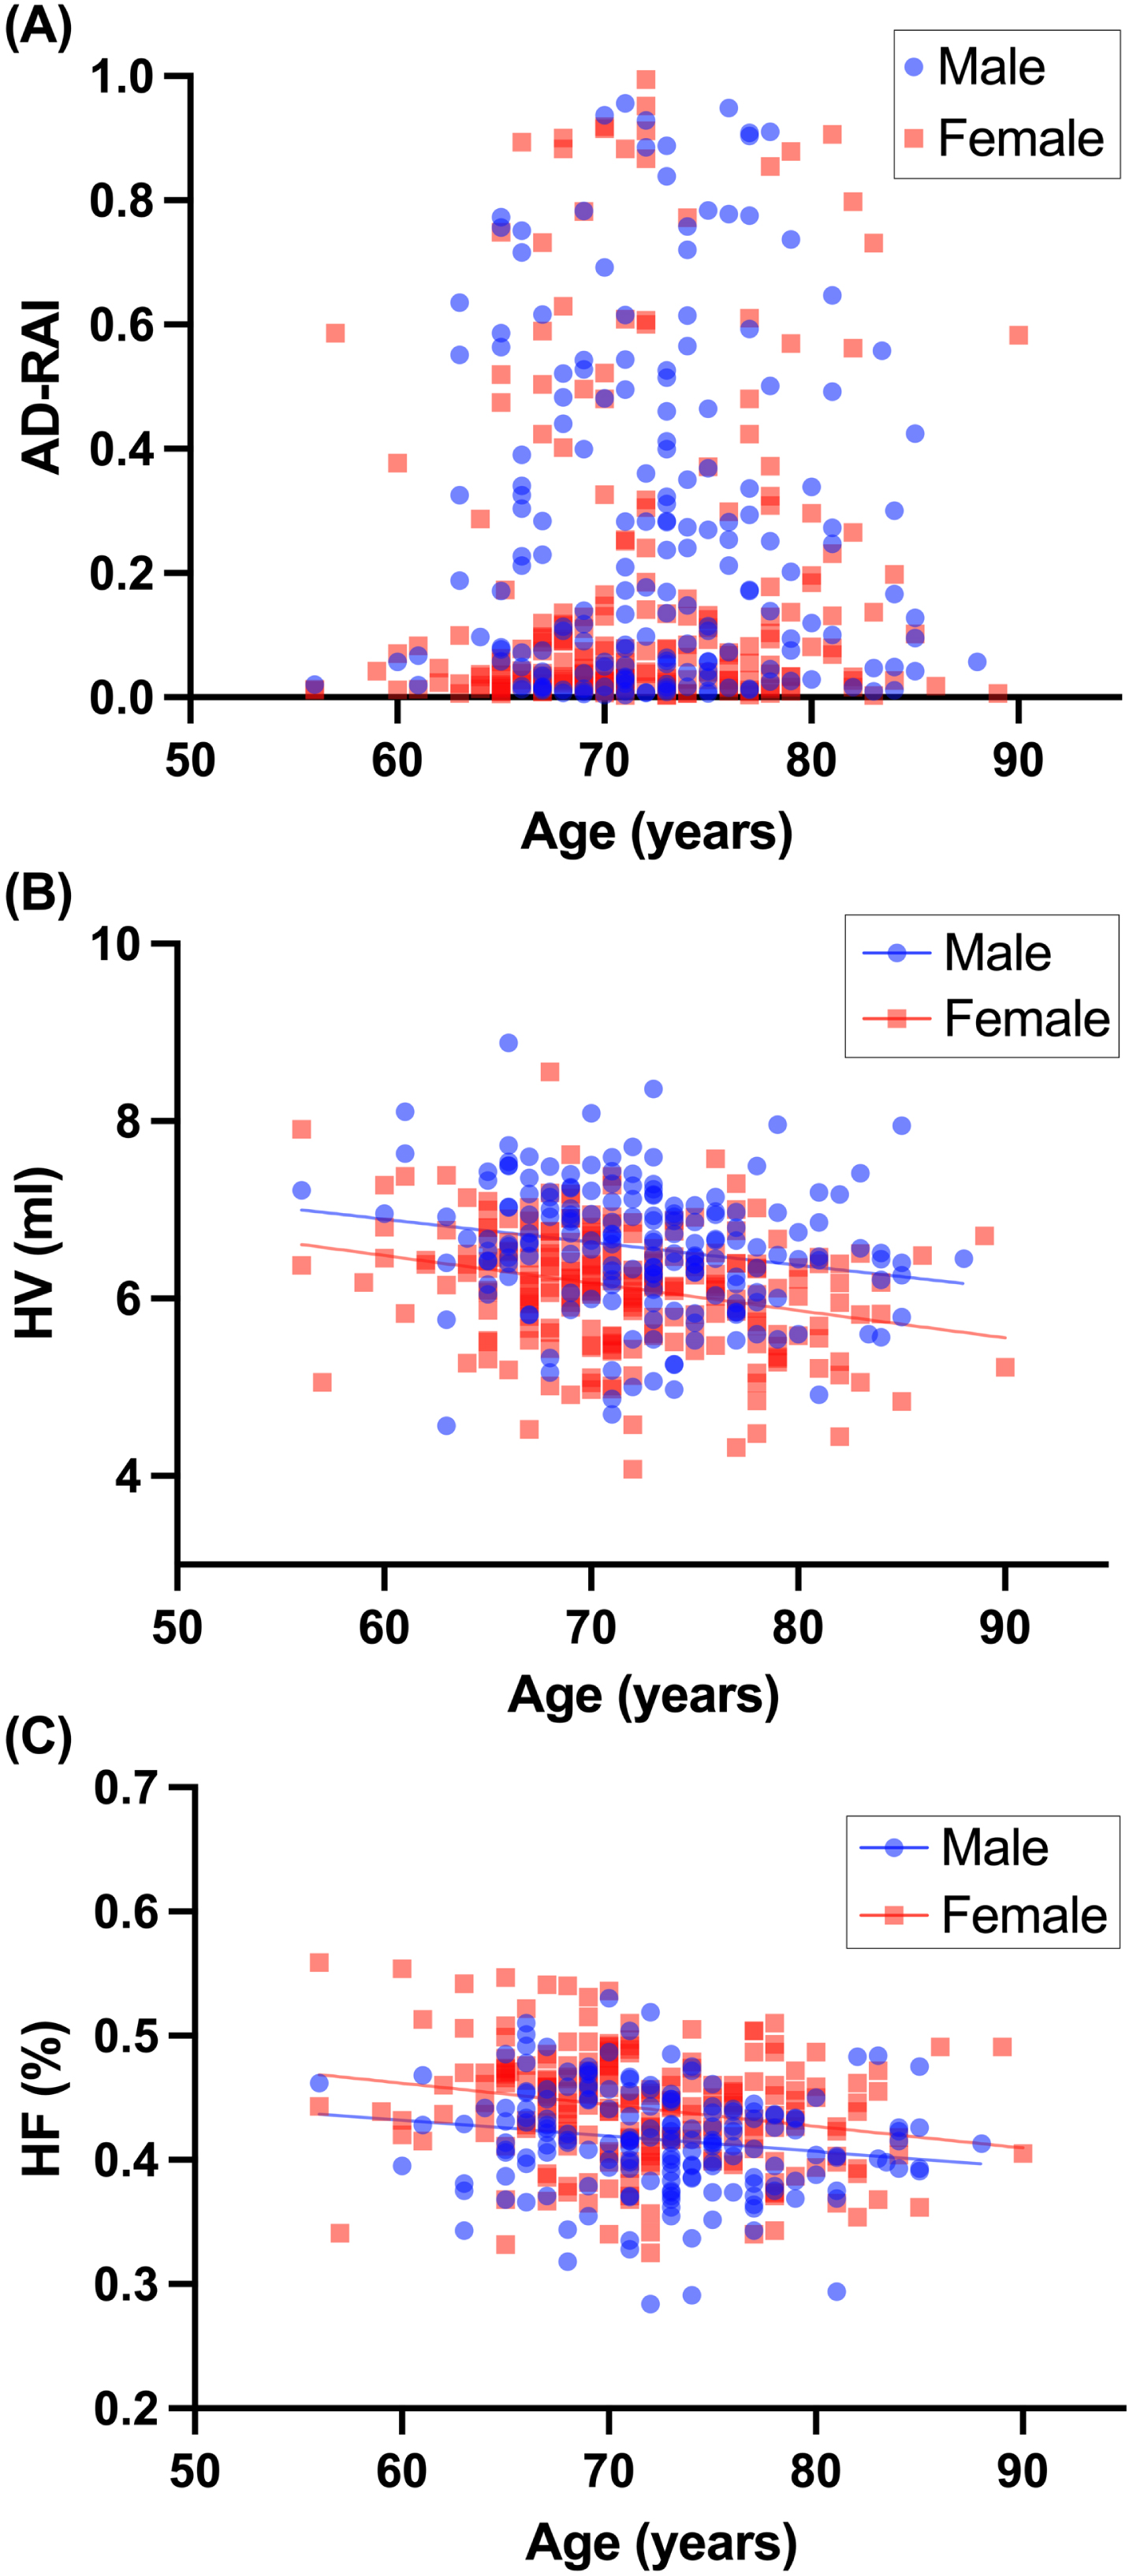
Correlation between age and MRI biomarkers. AD-RAI (A) was not correlated with age of each gender, while age significantly correlated with HV (B) and HF (C), respectively. AD-RAI, Alzheimer’s disease resemblance atrophy index; HV, hippocampal volume; HF, hippocampal fraction.
Both AD-RAI and hippocampal measures (HV/HF) were significantly different between gender (p < 0.001; p < 0.001; p = 0.001, respectively), in that although males had a higher HV than females, AD-RAI was higher and HF was lower in males than in the females (Fig. 3A-C).
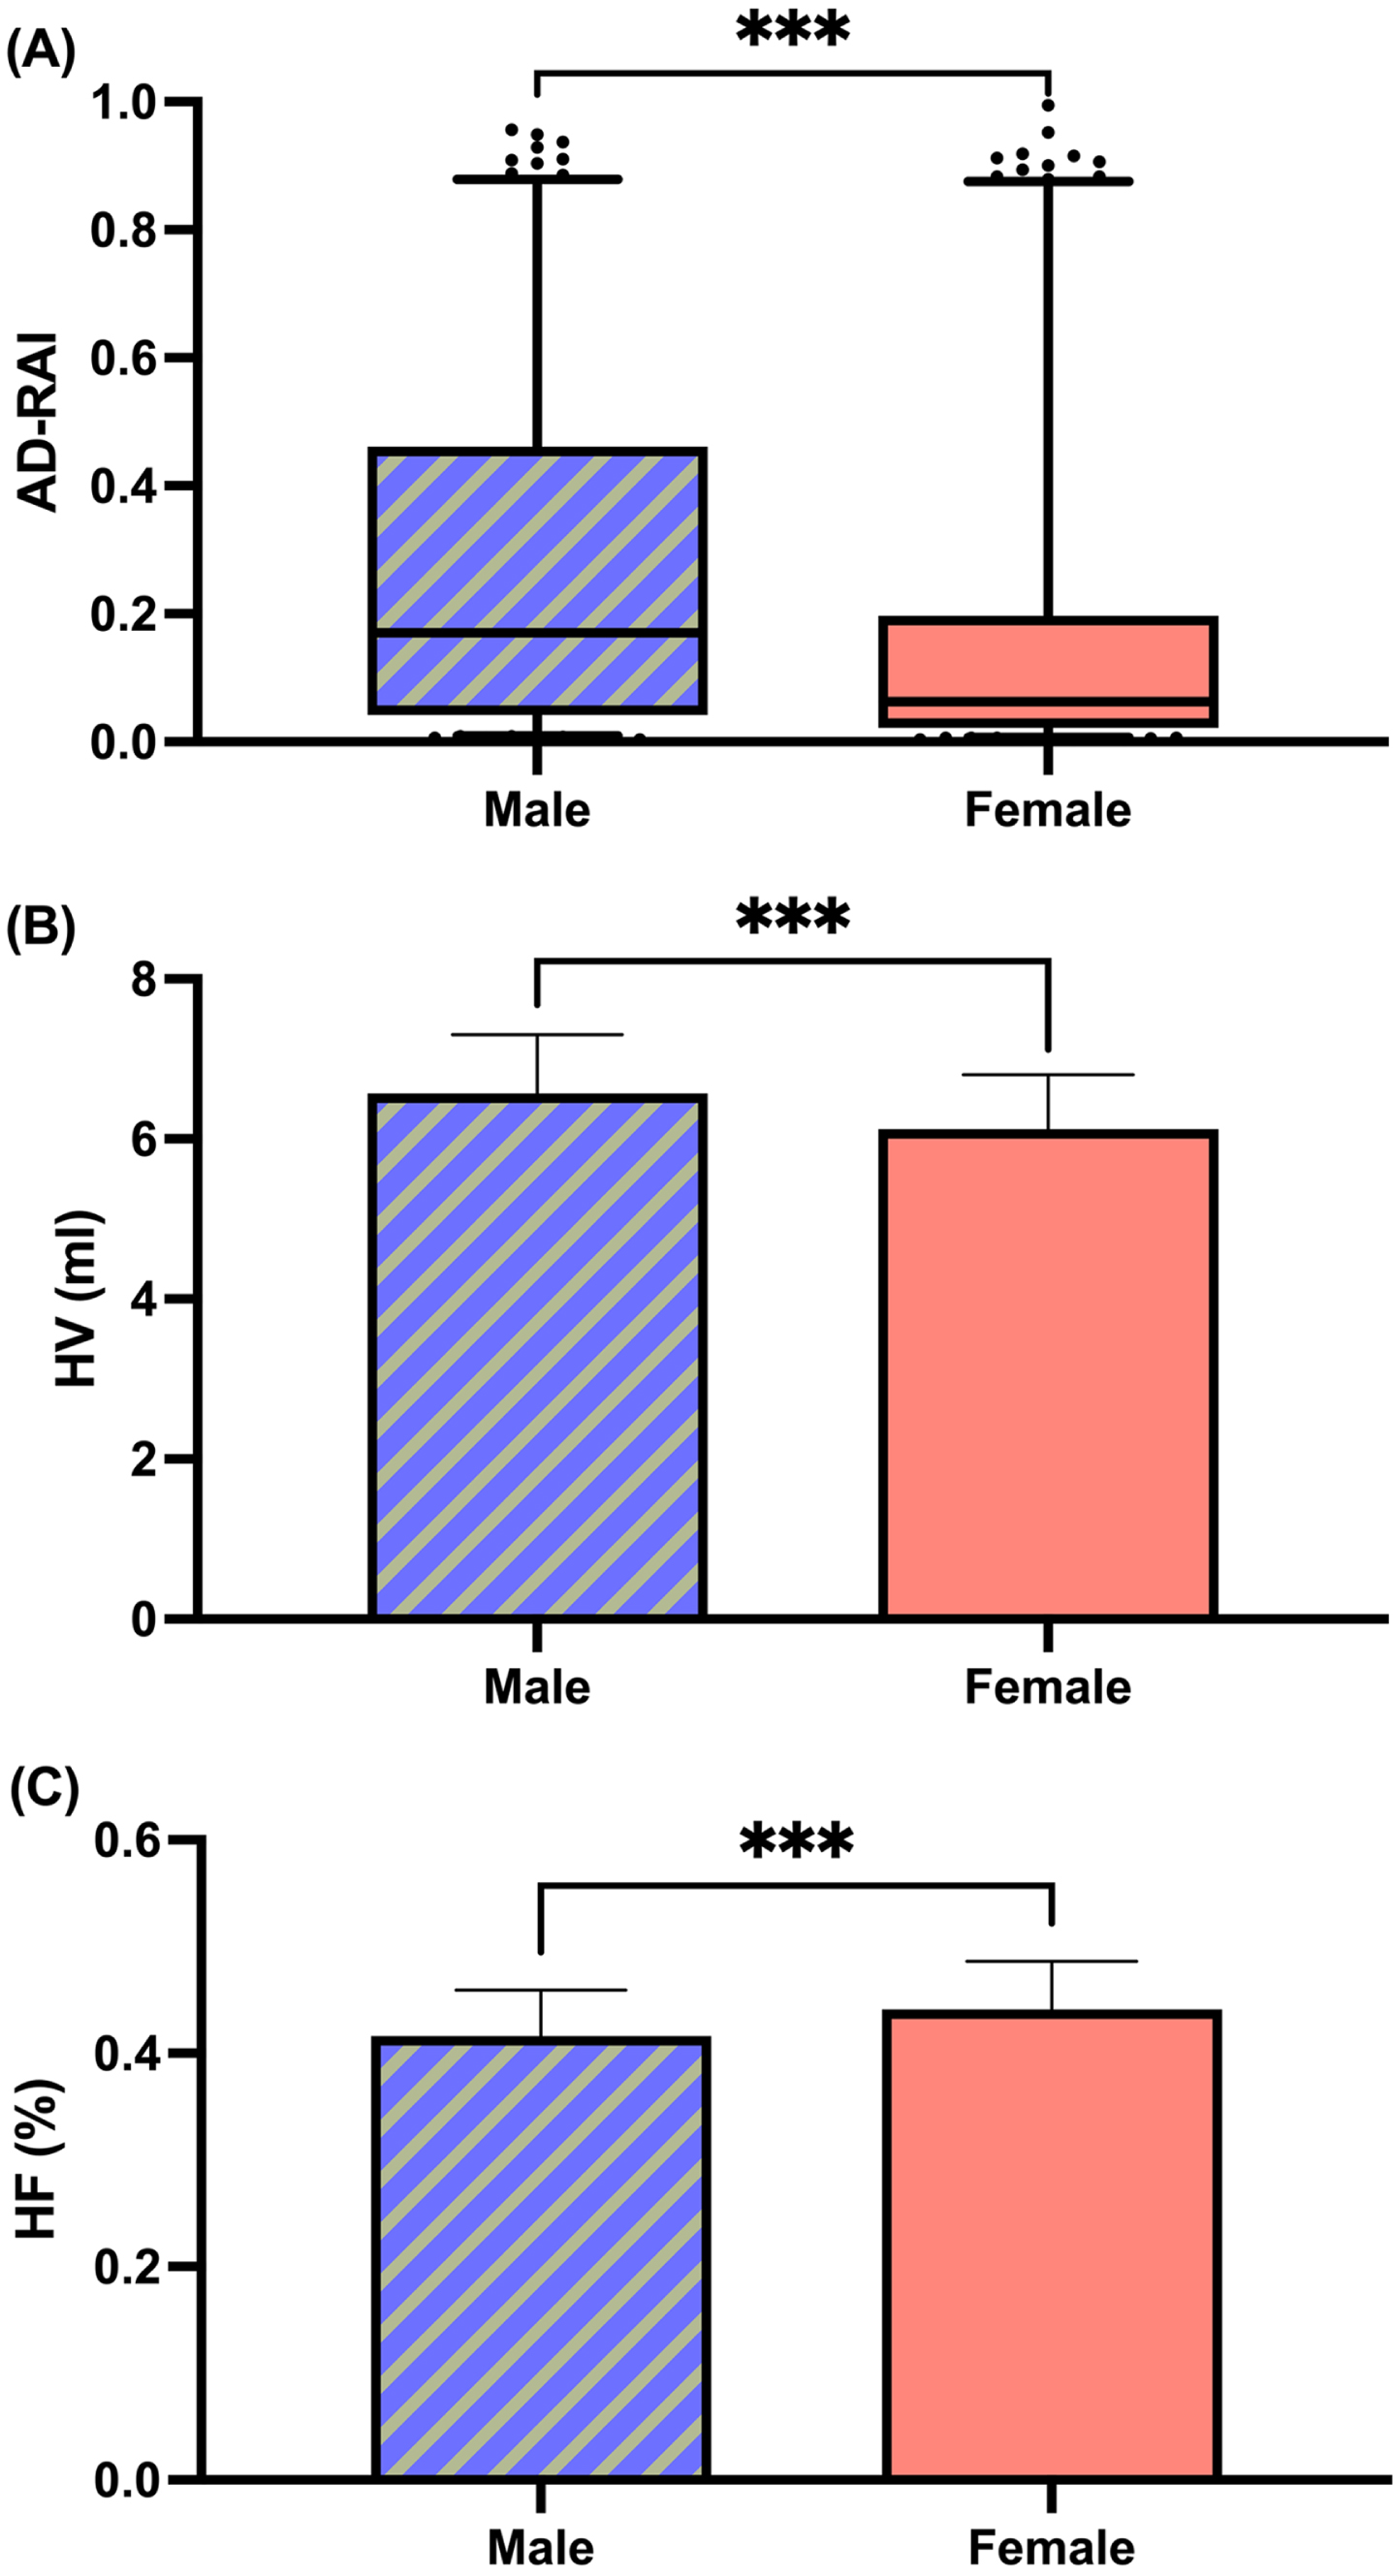
Comparison of MRI biomarkers between genders. AD-RAI, Alzheimer’s disease resemblance atrophy index; HV, hippocampal volume; HF, hippocampal fraction. ***p < 0.001.
Linear regressions were performed separately on each gender based on the negative association between HV/HF and age. The regression equating HV (y) to age (x) for male was y = –0.027x + 8.496 and for female was y = –0.029x + 8.201; and HF (y) to age (x) for male was y = –0.001x + 0.519 and for female was y = –0.002x + 0.553.
Diagnostic performance after adjustment for age and gender
Among all A + AD participants and A- CU controls adjustment to age and gender did not show significant additional improvement for AD-RAI [AUC 0.97 (95% CI, 0.95–0.98) adjusted AUC 0.97 (95% CI, 0.95–0.98), p = 0.48] and HF [AUC 0.92 (95% CI, 0.90–0.95), adjusted AUC 0.93 (95% CI, 0.91–0.95), p = 0.097] while HV showed slight yet significant improvement after adjustment [AUC 0.90 (95% CI, 0.88–0.93), adjusted AUC 0.92 (95% CI, 0.89–0.94), p = 0.043] (Supplementary Table 3).
The ROC analysis results of AD-RAI, HV and HF in amyloid-known cohort
AD-RAI, Alzheimer’s disease resemblance atrophy index; AUC, area under curve; CI, confidence interval; HV, hippocampal volume; HF, hippocampal fraction; NPV, negative predictive value; PPV, positive predictive value; ROC, receiver operating characteristic.
DISCUSSION
In this large, multi-database validation study, we demonstrated that AD-RAI achieved an excellent diagnostic performance in differentiating probable AD mild dementia from CU participants. It also outperformed conventional volumetric hippocampal measures. Diagnostic performance of AD-RAI was not affected by age or gender. To our knowledge, AD-RAI is the first machine learning-derived MRI-based neurodegeneration biomarker of AD that had fulfilled the requirements of the phase 2 validation framework [9, 10] and is clinical valid, readily applicable, and commercially available in daily practice in aiding the diagnosis of AD dementia.
In this study, we recruited only those with mild dementia and found that AD-RAI could achieve a high AUC similar to that achieved from an earlier smaller study, where mostly AD participants with moderate to severe dementia were recruited [16]. Note further in the present study, AUC improved to 0.97 (95% CI, 0.94–0.99) when only Aβ confirmed AD mild dementia and Aβ negative CU participants were analyzed. When compared with other machine learning research algorithms based on structural MRI (AUC 0.76–0.95), the AUC obtained by AD-RAI in this study seemed to be at a higher range in differentiating probable AD dementia from CU [11]. However, since performance metrics may vary with the characteristics of the cohort, a separate study is needed to compare the performance of AD-RAI with other machine-learning algorithms.
The head-to-head comparison between AD-RAI and hippocampal measures in this study showed that AD-RAI outperformed volumetric hippocampal measures. Previous studies showed that HV outperforms other whole brain or regional volumetric measures in the diagnosis of probable AD dementia and HV is currently the most commonly used quantitative MRI biomarker for AD [20]. The AUC achieved by HV/HF in this study (0.89) was very good and was comparable with that observed in previous similar studies (AUC 0.85–0.91) [30–32]. The superiority of AD-RAI over HV is consistent with a previous study showing that using several visual scales capturing multi-regional brain atrophy performed better than focusing only on the assessment of MTA [33]. Other studies showed that apart from MTA, atrophy of other regions (e.g., temporal pole, other regions of parietal and frontal lobes) are also present at the preclinical stage and continues to increase as the disease progresses [34]. Findings of our study support that AD-RAI is able to capture the multi-regional brain atrophy pattern of AD.
Recent studies showed that the AUC achieved by promising plasma AD biomarkers (e.g., p-tau 181, neurofilaments [NFL]) in differentiating between AD dementia and CU varied from 0.79–0.90 for p-tau 181 [35, 36] and 0.85 to 0.87 for NFL [37, 38]. The sample size and clinical features of recruited AD participants in these studies were similar to that of the present study. Although it was tempting to assume that the performance of AD-RAI is better than that of plasma p-tau or NFL, a head-to-head comparison between AD-RAI and respective plasma biomarkers is needed to clarify such an assumption. In addition, whether a model that combines AD-RAI, plasma biomarkers, and other clinical data (e.g., age, gender, cognitive score) can perform better than any single biomarker warrants further investigation.
Apart from investigating the clinical validity of AD dementia, phase 2 of the 5-phase validation framework suggests to investigate the association between the new biomarker and basic demographic factors (e.g., age and gender) [9] and how this association may affect the diagnostic performance of the biomarker. In this study, we found no association between AD-RAI and age, which is consistent with the original design of AD-RAI in that the effect of age-associated brain atrophy was accounted for during the development of the algorithm. We also observed that males had a slightly higher AD-RAI than females. Despite such differences, adjustment to gender did not affect the overall diagnostic performance of AD-RAI. Overall, our findings showed that AD-RAI is simple to use and adjustment to age or gender is not necessary in clinical practice, which is different to HV where age adjustment is required. Note that another secondary objective proposed in phase 2 is to investigate the reliability of the biomarker. This was already completed in recent studies showing excellent inter-scan reliability (absolute difference = 0.070 ± 0.069, p = 0.879) and excellent test-retest reliability (same-day intraclass correlation coefficient [ICC] 0.997, 2-week ICC = 0.998) in the generation of AD-RAI [16, 18]. Moreover, the performance of AD-RAI was largely similar across individual databases, suggesting that AD-RAI’s performance remains robust across different MRI scanners, acquisition parameters, and field strengths. Overall, the application of AD-RAI can be generalized across a wide range of clinical settings.
The strengths of this study included the large sample size and the use of multi-databases. In addition, we had selected probable AD participants with a well-defined clinical staging, i.e., mild dementia. This is very important as the diagnostic performance of atrophy-based biomarkers may vary with the severity of the clinical stage. However, there were several limitations. First, amyloid status of 48% of clinically diagnosed clinical AD participants was not known. However, since we observed that AUC among the amyloid-known cohort was higher than that of the amyloid-unknown cohort, the AUC reported in the validation cohort of the three imaging biomarkers might have been underestimated. Second, the sample size of the CU-SEEDS was small (n = 32). Ideally, a larger study on the performance of AD-RAI upon Chinese ethnicity should be performed. Note that earlier studies on AD-RAI were conducted mostly among the Chinese in the stage of CU, MCI, and moderate to severe dementia, which also showed similar performance to that of this study [14, 16]. Third, since we included participants with ages ranging from 65 to 90 years, the clinical validity of AD-RAI and the need for age adjustment may be different for participants younger than 65. Previous studies showed that the pattern of brain atrophy may differ between older and younger AD participants [39]. Further study is needed to investigate the diagnostic performance of AD-RAI and the association between AD-RAI and age among younger participants. Last, the excellent performance of AD-RAI applies only in the differentiation between AD and CU controls, rather than between AD and other neurodegenerative cognitive disorders. A study showed that AD-RAI was not able to differentiate between AD and front temporal lobar degeneration [40]. Hence, the clinical validity of AD-RAI only applies to participants presenting with a typical clinical presentation of AD.
In conclusion, this study validated a clinically applicable machine learning-derived MRI-based neurodegeneration biomarker (AD-RAI) in differentiating between AD mild dementia and CU participants. It outperforms conventional volumetric hippocampal measures, and adjustment to age or gender is not necessary for its clinical application. In the evaluation of participants presenting with cognitive disorder at mild dementia stage suspicious of AD, AD-RAI can be recommended to aid the diagnosis of AD by providing risk stratification, thus guiding subsequent management.
Footnotes
ACKNOWLEDGMENTS
We are grateful for the research volunteers, their families, and the investigators at the CU-SEEDS, ADNI, AIBL, and OASIS databases.
The CU-SEEDS (The Chinese University of Hong Kong - Screening for Early Alzheimer’s Disease) was conducted by the neurology division in Prince of Wales Hospital, which aimed to validate simple biomarkers for AD using participants recruited from the community and Cognitive Disorder Clinic of the Prince of Wales Hospital.
ADNI is funded by the National Institute on Aging, the National Institute of Biomedical Imaging and Bioengineering, and through generous contributions from the following: AbbVie, Alzheimer’s Association; Alzheimer’s Drug Discovery Foundation; Araclon Biotech; BioClinica, Inc.; Biogen; Bristol-Myers Squibb Company; CereSpir, Inc.; Cogstate; Eisai Inc.; Elan Pharmaceuticals, Inc.; Eli Lilly and Company; EuroImmun; F. Hoffmann-La Roche Ltd. and its affiliated company Genentech, Inc.; Fujirebio; GE Healthcare; IXICO Ltd.; Janssen Alzheimer Immunotherapy Research & Development, LLC.; Johnson & Johnson Pharmaceutical Research & Development LLC.; Lumosity; Lundbeck; Merck & Co., Inc.; Meso Scale Diagnostics, LLC.; NeuroRx Research; Neurotrack Technologies; Novartis Pharmaceuticals Corporation; Pfizer Inc.; Piramal Imaging; Servier; Takeda Pharmaceutical Company; and Transition Therapeutics. The Canadian Institutes of Health Research is providing funds to support ADNI clinical sites in Canada. Private sector contributions are facilitated by the Foundation for the National Institutes of Health ( ). The grantee organization is the Northern California Institute for Research and Education, and the study is coordinated by the Alzheimer’s Therapeutic Research Institute at the University of Southern California. ADNI data are disseminated by the Laboratory for Neuro Imaging at the University of Southern California.
AIBL data used in the preparation of this article was obtained from the Australian Imaging Biomarkers and Lifestyle flagship study of aging (AIBL). AIBL is a shareholder in Cogstate Ltd., Prana Biotechnology Ltd., Mesoblast Pty Ltd., and Eucalyptus Pty Ltd. AIB is a former consultant for Prana Biotechnology Ltd., has received speaker fees from Amgen, and is supported by an Australia Fellowship from the National Health and Medical Research Council (NHMRC). NGF is supported by an NHMRC training fellowship. CS is supported in part by a research fellowship funded by Alzheimer’s Australia. See for further details.
Data were provided in part by OASIS-3: Principal Investigators: T. Benzinger, D. Marcus, J. Morris; Funding for the Knight ADRC and KARI were provided by NIH P50AG00561, P30NS09857781, P01AG026276, P01AG003991, R01AG043434, UL1TR000448, R01EB009352. Florbetapir F18 (18F-AV-45) doses were provided by Avid Radiopharmaceuticals, a wholly-owned subsidiary of Eli Lilly.
The data used in the preparation of this article were obtained from the Alzheimer’s Disease Neuroimaging Initiative (ADNI) (adni.loni.usc.edu), the Australian Imaging, Biomarker & Lifestyle Flagship Study of Ageing (AIBL) (aibl.csiro.au), and the Open Access Series of Imaging Studies (OASIS) (oasis-brains.org). As such, the investigators within the ADNI contributed to the design and implementation of ADNI/AIBL/OASIS and/or provided data but did not participate in the analysis or writing of this report. We are also grateful to investigators of ADNI, AIBL, and OASIS and their participants for their open approach to data sharing.
FUNDING
This study was supported partly by the Shenzhen Science and Technology Program (KCXFZ20211020163408012). The CU-SEEDS dataset was funded by the Seeds Foundation Limited.
CONFLICT OF INTEREST
LS is the director of BrainNow Medical Technology Limited. VCM is the chief medical consultant of BrainNow Medical Technology Limited. LZ and YSL are employed by BrainNow Medical Technology Limited. All other authors report no financial relationships with commercial interests.
DATA AVAILABILITY
Data of ADNI, AIBL, and OASIS-3 are available in a public, open-access repository. The data are deposited in a publicly accessible repository and can be accessed correspondingly at the webpage of ADNI(adni.loni.usc.edu), AIBL(aibl.csiro.au), and the OASIS(oasis-brains.org). The CU-SEEDS Data are available on reasonable request. The dataset used and analyzed during the current study are available from the corresponding author on reasonable request.