



Abstract
Background:
Emotion and cognition are intercorrelated. Impaired emotion is common in populations with Alzheimer’s disease (AD) and mild cognitive impairment (MCI), showing promises as an early detection approach.
Objective:
We aim to develop a novel automatic classification tool based on emotion features and machine learning.
Methods:
Older adults aged 60 years or over were recruited among residents in the long-term care facilities and the community. Participants included healthy control participants with normal cognition (HC, n = 26), patients with MCI (n = 23), and patients with probable AD (n = 30). Participants watched emotional film clips while multi-dimensional emotion data were collected, including mental features of Self-Assessment Manikin (SAM), physiological features of electrodermal activity (EDA), and facial expressions. Emotional features of EDA and facial expression were abstracted by using continuous decomposition analysis and EomNet, respectively. Bidirectional long short-term memory (Bi-LSTM) was used to train classification model. Hybrid fusion was used, including early feature fusion and late decision fusion. Data from 79 participants were utilized into deep machine learning analysis and hybrid fusion method.
Results:
By combining multiple emotion features, the model’s performance of AUC value was highest in classification between HC and probable AD (AUC = 0.92), intermediate between MCI and probable AD (AUC = 0.88), and lowest between HC and MCI (AUC = 0.82).
Conclusions:
Our method demonstrated an excellent predictive power to differentiate HC/MCI/AD by fusion of multiple emotion features. The proposed model provides a cost-effective and automated method that can assist in detecting probable AD and MCI from normal aging.
INTRODUCTION
Global aging is a major worldwide trend. By 2050, the world’s population aged 60 years or older will reach 2.1 billion [1]. As the primary risk factor of neurodegenerative disease, the population of Alzheimer’s disease (AD) and mild cognitive impairment (MCI) are expected to increase substantially worldwide [2, 3]. Although patients can benefit from pharmacological and non-pharmacological approaches, managing AD and MCI is very challenging [4]. Recognizing warning signs and early diagnosis of MCI and AD, therefore, are of crucial importance and remains a public priority. In clinical practice, a diagnosis of AD depends on highly skilled clinicians to conduct a systematic examination that includes an inquiry of patient history, an objective neurological assessment of cognition, and a structural MRI scan [5]. The AD detection procedure is time-consuming, and mainly relies on the clinician’s expertise, resulting in a sensitivity ranging between 70.9% and 87.3%, and a specificity between 44.3% and 70.8% [6]. During the last decade, significant advances in research have been made toward detecting AD pathology using cerebrospinal fluid (CSF) biomarkers, positron emission tomography (PET) amyloid, and tau imaging [7]. However, these methodologies are invasive in nature, costly, and inconvenient. It is highly desirable to develop a cost-effective, efficient, and non-invasive MCI/AD assessment procedure, which encourages large-scale screening in community settings and accelerates the search for effective treatments.
Emotion is a multi-dimensional construct that is reflected by physiological features (e.g., electrodermal activity, EDA), mental features (e.g., subjective feelings), and outwardly presenting motor activity (e.g., facial expression) [8]. Disturbed emotion perception and social cognition have been increasingly recognized in AD [9–11] and MCI [12]. Facial expression is a promising emotional fingerprint for underlying AD pathophysiology [13], and it has been widely investigated in the literature [14–17]. Advanced machine learning paradigms, together with facial expression and motion analysis, offer new ways to differentiate AD from healthy aging individuals. A major challenge at this stage, however, is to understand the dynamic emotional deficits in AD individuals and how these deficits can be combined into one prediction model. Emotion processing involves at least two processes: the identification of the emotional significance of stimuli and the production of an affective state in response to the stimuli [18]. We hereby propose a novel paradigm by presenting movie scenes with intensive emotional content to the participants, and by collecting multidimensional data demonstrating both identification and production processes. This paradigm has several advantages. First, we used more ecological stimuli of films as the mood induction procedure, which could facilitate the evocation of psychophysiological, cognitive, and motor responses to emotion [19]. A recent study investigated dimensional and discrete emotional reactivity in AD individuals and proposed film clip as a research tool in dementia [20]. Second, we utilized both subjective questionnaire data and objective arousal data to index emotion identification. Most previous studies used photographs portraying the six basic emotions and required participants to select from a multiple-choice list. This method cannot reveal the individuals’ subjective experience. In addition, EDA is a promising marker of emotion recognition [21], but few studies have used EDA during emotional induction in AD individuals. Third, we employed facial expression analysis technology to decode facial expressions as the product of emotions. Based on analysis of facial dynamics, a recent study demonstrated classification of apathetic patients and non-apathetic individuals [22].
In last decades, deep machine learning approach has been used as the main method for predicting AD diagnosis. Deep learning approaches have wide applications in the biomedical community and demonstrate high accuracy classification across a broad spectrum of disease, such as the classification of cognitive status by using neuroimaging data [23] and electroencephalogram data [24]. It is noted that recent machine learning approach has been applied for facial expressions or EDA data to detect cognitive status. For instance, a deep learning-based model of facial emotion expression was developed to detect cognitive impairment, and the results were stable independent of sex, race, age, education level, mood, and eye movements [25]. Another study utilized a machine and deep learning approach on facial expressions to predict cognitive states and cognitive skills [26]. A further study measured the reliability of facial expressions on predicting cognitive performance across a diverse set of cognitive tasks [27]. Meanwhile, machine leaning models on EDA has been used to classify cognitive tasks [28] and to predict cognitive level [29] as well as cognitive impairments [30]. However, machine learning based on single-modal EDA or facial expression may not yield satisfactory results for differentiating individuals with cognitive impairments [31]. It is challenging to classify individuals with cognitive impairment based solely on a single model.
The ability to perceive others’ emotions and to express one’s own emotions is critical for social functions and daily activities. Dysfunction of this ability can lead to interpersonal difficulties [32, 33], a poor quality of life [34], a reduced ability to live independently [35], and caregiver burden [36]. On the other hand, neuropsychiatric and behavioral symptoms, such as depression and anxiety, are common in patients with AD [37], which have been linked to impaired emotion processing [35]. All these demonstrate the practical implications and significance for emotional functions in AD individuals. The primary objective of the study is to develop a novel machine learning framework to classify individuals with healthy aging, MCI, and AD, by using combined subjective and objective measures of emotion recognition and facial expression measures of emotion production.
METHODS
Participants
Older adults aged 60 years or older were recruited from residents in the long-term care facilities and the community. Participants included healthy control individuals with normal cognition (HC), patients with MCI, and patients with probable AD. A diagnosis of probable AD was made on the basis on the National Institute of Neurological and Communicative Disorders and Stroke and the Alzheimer’s Disease and Related Disorders Association (NINCDS-ADRDA) criteria [38], and the Mini-Mental Status Examination (MMSE) criteria [39]. A diagnosis of MCI was operationalized according to Petersen’s revised diagnostic criteria of MCI [40]: (a) subjective reported memory loss; (b) preserved daily living functions with a score for the activities of daily living (ADL) less than 16 [41]; (c) absence of dementia as defined by the criteria in the Diagnostic Statistical Manual of Mental Disorders (5th ed.) (DSM-V) [42] and the Montreal Cognitive Assessment (MoCA) criteria [43]. The HC participants were older adults: (a) with normal scores on the MMSE and MoCA; (b) had no memory or cognitive complaints; (c) had no history of diagnosed AD or MCI. Both MMSE and MoCA cutoff scores were determined with consideration of the education levels of participants. All participants were native Chinese speakers. Exclusion criteria were: (a) a diagnosis of neurological (other than AD) or psychiatric diseases according to the DSM-V; (b) severe visual or hearing impairment that may affect participation in the assessments. This study was carried out in accordance with the recommendations of the Declaration of Helsinki, with written informed consent obtained from all participants. The protocol was approved by the Ethics Committee of the School of Medical Science at Jinan University (JNUKY-2022-049).
Emotion assessments
We used six films to elicit the basic emotions: neutral, sadness, disgust, fear, anger, and happiness. The film clips were selected from the standardized Chinese Affective Video System (CAVS), which was validated in a sample of Chinese adults [44]. The film stimuli were presented on a 14” LED computer screen (1920 × 1080 resolution) and in a counterbalanced order. The participants watched the films at a distance of 40 cm and heard the sound through a pair of soundproof headphones. The duration of the experiment was approximately 40 min, administered using BioTrace+software (Mind Media BV, Netherlands). The experiment began with a resting period (3 min) to establish the baseline of physiological measurements. To allow the participant to return to their baseline emotional state, the film slips were separated by a 60-s resting period during which the participant closed eyes and relaxed.
During the experiment, the subjective responses were assessed immediately after each film clip, and the physiological responses were measured on a continuous basis. The subjective emotional response was accessed using the Self-Assessment Manikin (SAM) [45]. The participant was required to complete a 9-point Likert-type scale to indicate the level of arousal and valance. Graphic figures were used to represent different emotional states to make it easy for participants to understand. The physiological emotional response was assessed by EDA on a Nexus-10 system with BioTrace+Software (Mind Media BV, Netherlands). Two flat 10-mm Ag/AgCl dry electrodes were fixed at the phalanges of the ring and middle fingers of the non-dominant hand to collect the EDA data. Based on the protocol on skin conductance measurement [46], we collected EDA data of the subject’s non-dominant hand to reduce the noise induced by skin conductance level and sweat gland activity. Facial expressions were captured while the participant was watching the film clips using a HD camera (1980 × 1080 resolution). The overall experiment protocol is shown in Fig. 1.
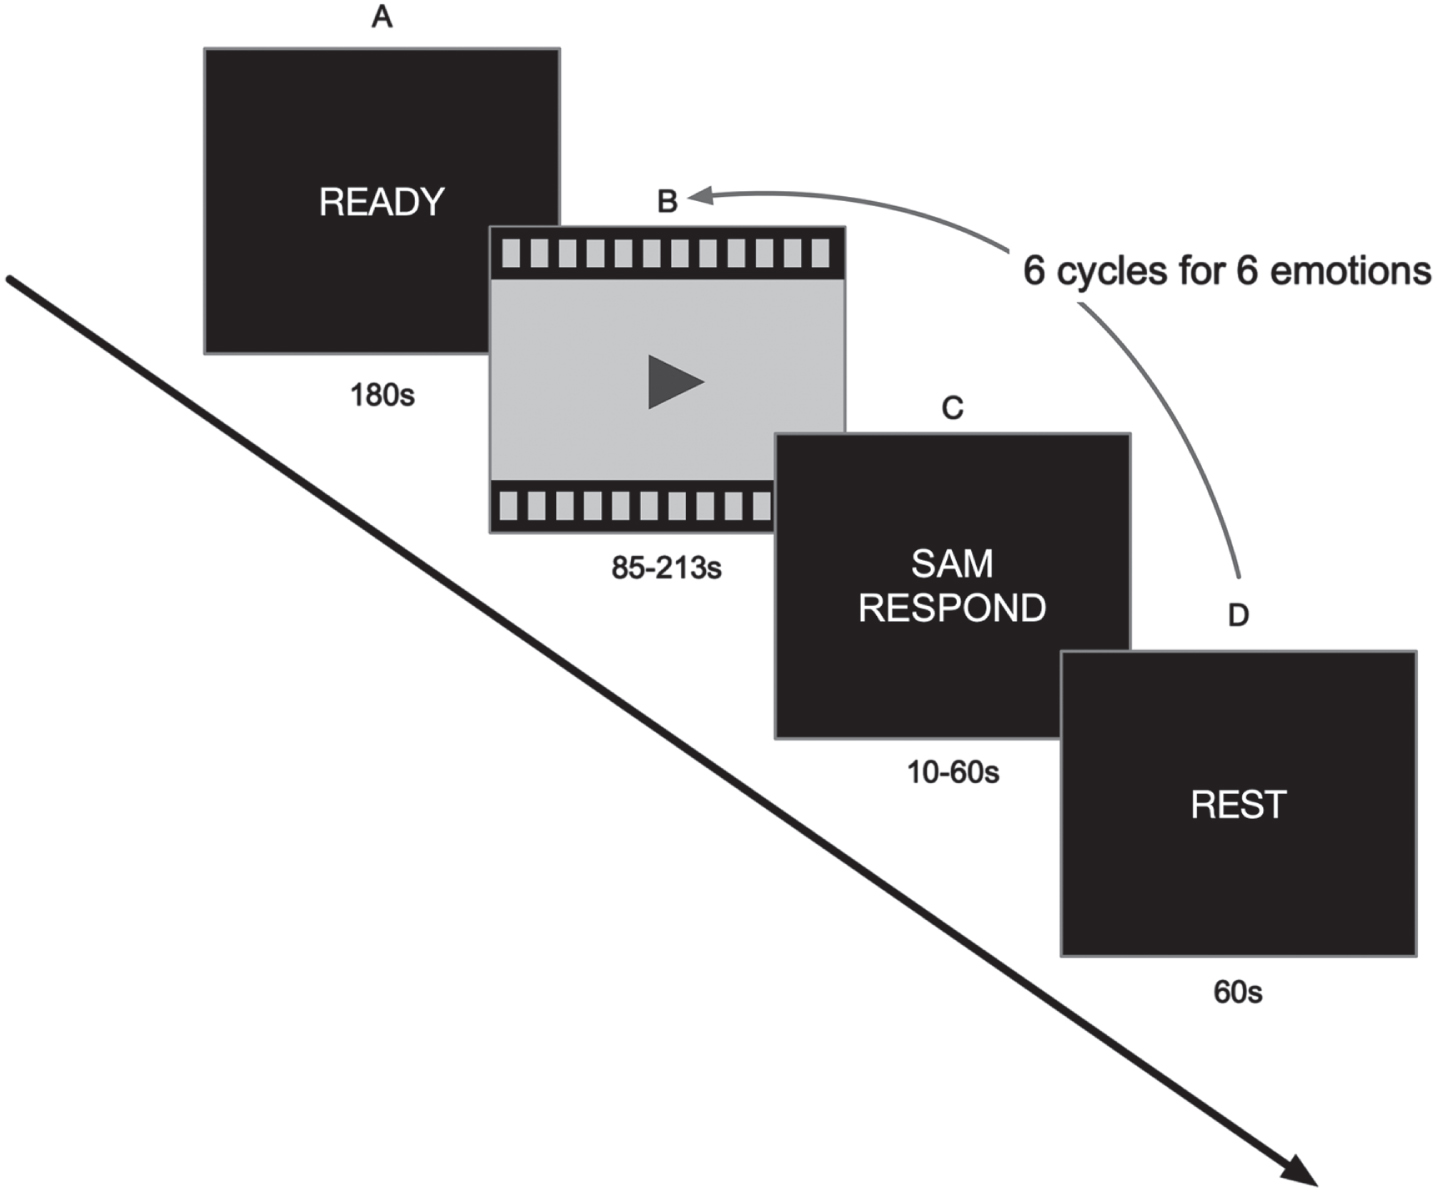
Overall experiment protocol: (A) baseline measurement; (B) emotion film clips watching; (C) subjective measurement for mental features; (D) rest period.
Data collection
Data was collected in quiet and comfortable environment. Data with incomplete coverage of face during capture or significant EDA noise due to hand movement were excluded from analysis. A total number of 30 probable AD patients, 23 MCI patients, and 26 HC individuals were included in our analysis.
Development of the model
Features extraction
To extract facial emotion features, the two-dimensional continuous model of valence and arousal [47] was used to represent facial emotions (Fig. 2). The advantage of this expression definition method is that it can distinguish subtle differences between different expressions with the help of continuous values, thereby helping computers to better understand human expressions.
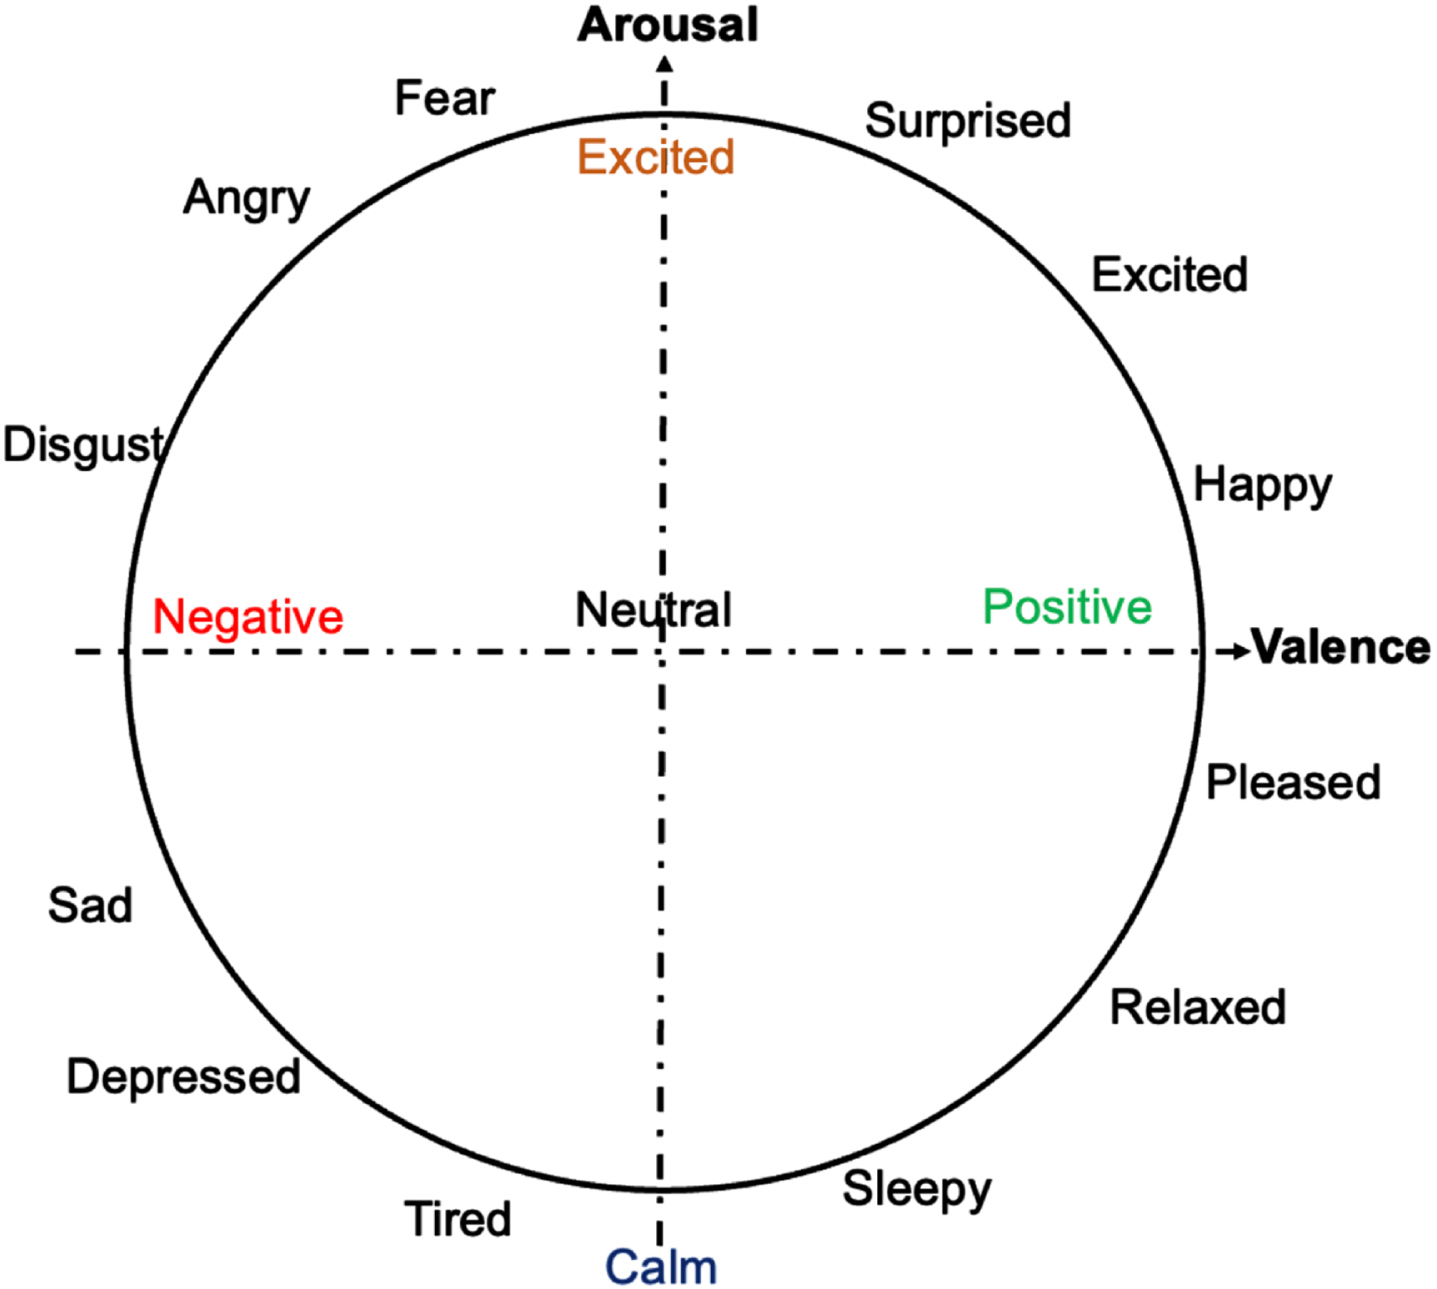
Two-dimension continuous valence and arousal features.
EmoNet is a deep neural network framework developed by Samsung AI Research Institute and Imperial College London (https://github.com/face-analysis/emonet). EmoNet is an expression recognition model based on deep learning, which can perform emotion classification on face images, and accurately recognize the emotions expressed by facial expressions, such as happiness, sadness, anger, etc. The underlying architecture adopts Convolutional Neural Network (CNN), which can automatically extract image features, thereby effectively capturing the details and characteristics of human facial expressions, and then perform emotion classification. EmoNet is a neural network developed from a database of 2,185 videos to be classified by using color, spatial power spectrum, and the presence of objects and faces in images. The concordance correlation coefficient (CCC) and Pearson correlation coefficient (PCC) evaluation indicators of the EmoNet model performed well in the three data sets of AFEW-VA, AffectNet, and SEWA [48]. Importantly, EmoNet has been widely used in the emotion literature [49–51]. We used the pre-trained Emonet network model to extract two-dimensional Valence-Arousal continuous features from the collected videos frame by frame:
Among them, v fn and a fn respectively represent the valence value and the arousal value of the nth frame of videos (Fig. 3).

Two-dimensional valence-arousal continuous features in a time series.
According to the preprocessing result of the formula (1), we extracted a four-dimensional representation for the two-dimensional continuous emotional feature trajectory line between the two adjacent frames of each video:
Where Δv i = vi+1 - v i , Δa i = ai+1 - a i respectively represent the difference in the value of arousal/valence between two adjacent frames, which represent the intensity of emotional change. Through the representation conversion method of Eq. (2), we can extract two-dimensional valence-arousal continuous features [[v f1, a f1], [v f2, a f2],..., [v fn, a fn]] convert to [E1, E2, …, E n ].
For EDA data, we performed continuous decomposition analysis (CDA) and standard trough to peak (TTP) on the original skin electrical signal based on the Ledalab toolbox. Ledalab toolbox is an open source Matlab-based software for analysis of skin conductance data and it has been widely used for research purpose. CDA decomposes the original signal into continuous phase and tonic activity signals. This method extracts the phasic (driver) information underlying EDA and aims at retrieving the signal characteristics of the underlying sudomotor nerve activity (SNA). This is useful for all unbiased scoring analysis of staged and stressful activities, and the event related activation finally obtained. The TTP is working as below. First, detection of skin conductance response (SCR) that is the segment of the data corresponding to physiological responses. Second, identification of trough and peak. The trough is the lowest point in skin conductance within the SCR, which represents the baseline skin conductance level when individual is at rest. The peak is the highest point in skin conductance within the SCR, which represents the highest skin conductance level reached during the response. Finally, the amplitude of the SCR is calculated as the difference between the peak and the trough, which is often expressed as “Amplitude = Peak – Trough”.
Recurrent neural network (RNN)
The RNN has strong processing capacity for variable length sequence data since it can well mine the timing information and semantic information in data. In current study, we used bidirectional long short-term memory (Bi-LSTM) [52] to train classification model. LSTM is designed to address the issues of gradient explosion and gradient disappearance commonly observed in general cyclic neural networks by adjusting the gradient through the use of a cell state. Its effectiveness has been widely demonstrated in various deep learning areas, such as time series prediction. First, we analyzed the EDA and facial video clips, including the stages of recognition, extraction feature fusion, and PCA dimensionality reduction, and then incorporate the preprocessed information into the RNN model. Our study used data augmentation methods for multimodal datasets, including adding noise and random window sampling. We adopted two-layer Bi-LSTM networks to improve the generalization performance. The number of neurons in each layer was set 100 and the dropout was set as 0.8. The optimizer adopts Adam, where the batch size and the initial learning rate were set 256 and 0.001 respectively [53].
Multimodal fusion
Multimodal fusion aims to improve the accuracy of data analysis by leveraging the complementary information between different modal data. Multimodal fusion strategies mainly include data fusion, feature fusion, decision fusion, and hybrid fusion. Among these, feature fusion refers to the fusion of multiple independent data sets into a single feature vector that as the input into the machine learning classifier. Decision fusion is to fuse the output decisions of the classifiers trained separately with a single modality. Hybrid fusion can combine the advantages of both early feature fusion and late decision fusion strategies. Therefore, this study adopted a hybrid fusion strategy to investigate the performance and practicality of multimodal cognitive dysfunction recognition.
Overall architecture
The overall framework of hybrid fusion cognitive dysfunction recognition method based on multiple attention mechanism is shown in Fig. 4. We summarize the framework as below. First, mono-modal feature extraction and fusion. The facial expression module took facial expression videos from six different induced scenarios and fed them into a pre-trained EmoNet model to extract facial features, including categorical emotions, predicted valence and arousal values, as well as facial landmarks. These facial features were combined into a composite vector using an “add” parallel fusion strategy. The composite vector was then input into PCA and Bi-LSTM to extract well-fused mono-modal features. The EDA module follows a similar process, and it used a fully connected layer as the input layer rather than the EmoNet model. The SAM module took subjective emotional assessment and input it into two Conv1D layers for convolution operations, extracting features from the data. Second, multi-modal feature fusion. The extracted feature data from the mono-modal feature fusion stage was input into a fully connected layer. This layer cross-connected feature information from different branches and fed it into the Multi-Head Attention Mechanism module. This allows the model to effectively organize and utilize the features extracted during the first stage. Finally, multi-modal fusion feature classification. After aggregating mono-modal features through the Multi-Head Attention Mechanism, the final output was fed into a softmax classifier to achieve the ultimate output.

Overall framework of hybrid fusion.
Data augmentation
For the facial expression data, we used the Dlib tool to detect the faces on each frame of the videos. The size of the cropped face area will be resized to (256, 256). Given the valence-arousal two-dimensional emotion representation, we used upsampling to obtain more label data, and unified the data of various scales for machine learning. “Upsampling” is a method used to increase the amount of data available for training machine learning models. Six video clips were presented and the duration of each clip ranged from 1 min 25 s to 3 min 32 s. The clips were standardized as below. The sampling interval τ is determined by both the length of the sequence VA
L
and the first dimension of the input tensor of RNN Seq
len
:
In our experiment, Seq len was set as 300, and the length of two-dimensional emotional representation sequence VA L is the total number of frames of video N frame, which is determined by the total duration of the video T video and the frame rate of video fps, as N frame = T video * fps. Based on cross-correlation experiments using a sliding window on the facial feature sequences, we found that windows with higher cross-correlation coefficients were mostly occurred at the later stage of the time series. Then we selected the second half sequence as the effective sequence for data analysis. High cross-correlation between different sequences or data signals is important because it indicates a strong linear relationship or similarity between them. High cross-correlation suggests that these data segments share consistent patterns or features across different individuals or conditions, making them more effective in capturing relevant emotional responses or patterns of the participants. Moreover, the patterns identified in this segment are less affected by individual differences or noise, thus enhancing the reliability of emotional responses [54, 55]. Since the training data set has a small amount of data, and the network is easy to overfit, our study used data augmentation methods for multimodal datasets, including adding noise and random window sampling. In our experiments, we augmented the original data from each subject to generate 10 multimodal data entries by introducing noise and employing random window sampling. We divided the dataset into a training set and a testing set to ensure that there is no information leakage when training the model on the augmented dataset. Adding noise means randomly adding a certain amount of Gaussian noise to each value to generate a new sequence without affecting the overall properties and label information of the sequence, to prevent the machine learning model from over fitting. The Gaussian noise is a subtype of statistical noise that follows a Gaussian distribution (normal distribution). It is a random noise with a mean (average) of zero and a symmetric, bell-shaped probability density function. In the context of data and signal processing, Gaussian noise is used to represent random variations and uncertainties in measurements or data. Random window sampling involves definition of a fixed-length window at the beginning of the original data sequence. Within this window of 3 to 5 s, a random position is selected, and data points are sampled at a specified sampling frequency (300 frames per video data sample) starting from that position to create a new sequence. This process can be repeated multiple times to generate multiple training sample datasets from the original data of a subject. We adopted two-layer BI-LSTM networks to improve the generalization performance. The number of neurons in each layer was set 100 and the dropout was set as 0.8. The optimizer adopts Adam [56], where the batch size and the initial learning rate were set 256 and 0.001 respectively. The division ratio of training set and test set is 9 : 1. Since there are a limited number of samples in the dataset, we evaluate the performance using K-fold cross-validation, in which a small part of the samples constitutes the testing set, while most of samples are used to train the model. Specifically, we employed the k-fold cross-validation approach. Initially, the dataset D was randomly divided into k equally sized mutually exclusive subsets. In each iteration, k-1 subsets were randomly chosen as the training set, with the remaining 1 subset being used as the test set. In our experiments, the training-to-testing ratio was 9:1, resulting in K = 10. Augmented sequences from the same subject were exclusively present in the training set to prevent any information leakage. If they were included in the test set, it would induce information leakage issues. As a result, the model’s generalization performance in real-world scenarios was preserved. All models have been implemented using Keras library with Tensorflow as backend and run on a NVIDIA titan-x 12 g GPU.
Transparency and openness
Since our data involves faces privacy of the participants, the material has not been made accessible. The analytic plan was not preregistered. The analysis code is available in https://github.com/funkylun/emotion_machine_learning. We calculated the statistical power, using the G * Power software (v. 3.1.9.6.) for the one-way ANOVA. For an effect size f = 0.4, α= 0.05, 1-β= 0.80. We calculated the total sample size being 66, non-centrality parameter λ = 10.56, critical F = 3.14, actual power = 0.82. Referring to previous studies of facial machine learning [22] and considering 10% of the lost, we finally determined the minimum total sample size as 73.
RESULTS
The demographic and neuropsychological characteristics are shown in Table 1. Descriptive statistics (mean and standard deviation) were performed on participants’ sociodemographic information and neuropsychological test results. Analysis of variance (ANOVA) and t-test were used to examine group differences for continuous variables (age, MMSE and MoCA scale scores), and the chi-square test examined group differences on gender and education level. Between-group differences were not significant in age, gender, and education level (p > 0.05) and significant in neuropsychological assessments (p < 0.05).
Demographic and neuropsychological scores of the participants
We have investigated three binary classification tasks: (I) HC versus probable AD, (II) MCI versus probable AD, and (III) HC versus MCI. The classification results are shown in Table 2. The performances show as mean±standard deviation (STD) over the 10 runs of 4 methods. Compared with the single feature method, the multimodal fusion feature method improved the performance. Among the three classification tasks, classification between HC and probable AD demonstrated the best classification effect (Accuracy (ACC): 88.3±5.1%; Specificity (SPE): 89.3±3.0%; Sensitivity (SEN): 86.1±5.1% F1-score: 86.8±4.4%), followed by classification between MCI and probable AD (ACC: 87.3±4.8%; SPE: 88.3±4.3%; SEN: 85.3±4.3%; F1-score: 85.7±5.3%) and classification between HC and MCI (ACC: 76.6±6.4%; SPE: 80.3±4.4%; SEN: 75.6±4.4%; F1-score: 76.2±3.4%). The ROC results are shown in Fig. 5. Among the three tasks, the best AUC effect was HC versus probable AD (AUC = 0.92), followed by MCI versus probable AD (AUC = 0.88) and HC versus MCI (AUC = 0.82).
The performance of different features
1Determined by ANOVA or chi-square test.

ROC curve in classification tasks.
DISCUSSION
Our developed model demonstrates a strong predictive power to differentiate between old adults with normal cognition, patients with MCI, and patients with probable AD. By using multidimensional emotion variables, the system is a good supplementary for cognitive assessment among older adults. Importantly, the new automatic system is convenient and cost-effective for large-scale screening for cognitive impairment in community settings, showing great clinical implications and potential value for public health.
Emotion is intercorrelated with cognition [57]. It is well established that individuals with cognitive impairments demonstrate deficits in emotion perception [58]. For instance, AD patients had difficulties in identifying or recognizing negative emotions [20]. Furthermore, accumulating evidence has indicated that cognitive deficits are associated with less specific facial expressions, suggesting that AD individuals may have difficulties in expressing emotions [16]. These emotional deficits may be attributed to the atrophy and neuropathological changes in the amygdala and hippocampus that occur in older adults with cognitive impairment [59]. On the other hand, reduced episodic memory in AD patients could further hinder their ability to respond to emotional stimuli [60]. The deficits in emotion processing could occur early at the MCI stage [61], although several studies have suggested that the MCI individuals and healthy older adults have comparable performance at the emotion recognition task [62]. Nevertheless, the evidence on emotional deficits is not enough in the populations of MCI.
We used multi-dimensional data, including subjective questionnaire data, electrodermal activity, and facial expressions, to differentiate and to predict AD, MCI, and healthy individuals. Each of this method has strengths and weaknesses, making it challenging to accurately predict cognitive status using any single method. Subjective emotional questionnaires collect specific information about individual’s emotional experiences, reflecting their subjective emotional feelings [63]. However, AD patients often have cognitive impairments that affect their reading, comprehension, and language abilities, making it difficult for them to accurately express their emotions [16]. Additionally, AD patients may have memory biases that lead to inconsistencies between questionnaire results and their actual emotional experiences. Emotion and attention are interleaved. By enhancing attention, individuals can increase the ability to detect emotional stimuli. Skin conductance responses can detect emotional physiological information objectively, even if emotional target stimuli are not perceived [64]. Physiological signals have the advantage of providing accurate and objective emotional physiological information and can record on-line emotional physiological responses during stimulus presentation [65], which can also minimize the influence of recall bias and memory errors. Facial expressions reflect an individual’s inner feelings, emotions, motivations, and needs [66]. Recognizing facial expressions involves perceiving visual configurations, evaluating emotional values. Taken together, the three methods (subjective rating, skin conductance, and facial expressions) complement each other and provide a whole picture of emotion.
It is noticed that the MCI versus HC classification showed the worst SPE, SEN, and AUC values compared with the other two classification tasks. The possible reasons for this phenomenon are summarized as below. First, emotion and cognition are highly correlated [67]. A systematic review concluded that emotional processing ability will further deteriorate with the continuous progression of neurodegenerative diseases [68]. In other words, emotion impairment is more pronounced in AD than MCI [69]. Second, the findings on emotion impairment in MCI are not consistent [68]. For example, amnestic MCI multiple domain patients demonstrated impairments in emotion recognition, but this impairment could not be found in amnestic MCI single domain [70]. The current study did not differentiate between sub-types of MCI. Finally, we did not find significant difference in the skin conductance response and questionnaire evaluation between MCI individuals and HC, which in agreement with the poor classification results by machine learning.
A convenient screening instrument to assess cognitive impairment in community-dwelling older adults would be beneficial for public health. Currently, evaluation of probable AD and MCI requires a cognitive examination, primarily based on face-to-face interviews with patients or their caregivers. Two commonly used screening tools are MMSE and MoCA, which rely on experienced clinicians or neurologists and require 10 to 20 min to administer. These two instruments should consider a variety of factors, such as culture, language, and education level [39, 71]. Recent advances in technology showed promises in promoting sensitivity and specificity for identifying AD. For instance, the PET could show abnormalities suggestive of AD with a sensitivity of 91% and a specificity of 85% [72, 73]. A recent study used electroencephalogram (EEG) metrics to detect preclinical AD, which found a non-linear relationship between amyloid burden and EEG metrics [24]. Although above methods can reliably detect AD/MCI, these approaches are expensive and require presence in hospitals. A more automated screening method for AD/MCI is needed. For instance, a recent study presented a new automatic method could successfully detect apathy symptom in dementia by analyzing facial emotion and motion [22]. We observed excellent predictive power by emotion assessment, achieving 92.5% AUC for HC versus probable AD, 88.9% AUC for MCI versus probable AD, and 82.7% AUC for HC versus MCI. The performance demonstrated higher power than natural language processing approach that using voice recordings in a recent study [74]. Importantly, the proposed method seems to be more convenient and cost-effective for screening AD and MCI by collecting multimodal emotional data in community-dwelling individuals.
The current study is not without limitations. First, the study only recruited individuals with probable AD and MCI. Different neuropsychiatric disorders have different emotion features. For example, older adults with depression tended to perceive neutral or ambiguous facial expressions as sadness and had reduced abilities in recognizing all basic emotions except sadness [75]. Post-stroke mood and emotional disturbances were frequent and common, which had diverse manifestations in symptoms [76]. The practical application of this method requires further investigations in other neuropsychiatric disorders. Second, although the MMSE and MoCA are standard measures for determining the cognitive status of older adults, the diagnosis of AD and MCI is not confirmed by biomarker or brain imaging evidence. The cost of collecting biomarkers, such as CSF and PET imaging, is very expensive and may carry certain risks and side effects. In addition, the participants were recruited among residents in the long-term care facilities and the community, where the diagnostic biomarkers were not available. In future, it is hoped to use PET imaging, CSF, and other objective indicators to confirm the diagnosis of AD and MCI. Finally, the results cannot be extended by using multivariate classification to differentiate HC/MCI/probable AD, due to the limited sample size. In future, it is hoped to investigate the multivariate classification of cognitive disorders in a large sample.
Footnotes
CONCLUSION
Our method demonstrated an excellent predictive power by fusion of multiple emotion features. This study provides a cost-effective, automated method that can help detecting probable AD and MCI accurately.
ACKNOWLEDGMENTS
We thank all the participants who enthusiastically participated in the research.
FUNDING
This work was funded by research grants from the National Key R & D Program of China (2020YFC2005802); the National Natural Science Foundation of China (82172530).
CONFLICT OF INTEREST
The authors have no competing interests to declare.
DATA AVAILABILITY
The data supporting the findings of this study are available on request from the corresponding author. The data are not publicly available due to privacy or ethical restrictions.
