
Abstract
Background:
There is a lack of understanding in the molecular and cellular mechanisms of Alzheimer’s disease that has hindered progress on therapeutic development. The focus has been on targeting toxic amyloid-β (Aβ) pathology, but these therapeutics have generally failed in clinical trials. Aβ is an aggregation-prone protein that has been shown to disrupt cell membrane structure in molecular biophysics studies and interfere with membrane receptor signaling in cell and animal studies. Whether the lipid membrane or specific receptors are the primary target of attack has not been determined.
Objective:
This work elucidates some of the interplay between membrane cholesterol and Aβ42 on HT22 neuronal cell viability, morphology, and platelet-derived growth factor (PDGF) signaling pathways.
Methods:
The effects of cholesterol depletion by methyl-β-cyclodextrin followed by treatment with Aβ and/or PDGF-AA were assessed by MTT cell viability assays, western blot, optical and AFM microscopy.
Results:
Cell viability studies show that cholesterol depletion was mildly protective against Aβ toxicity. Together cholesterol reduction and Aβ42 treatment compounded the disruption of the PDGFα receptor activation. Phase contrast optical microscopy and live cell atomic force microscopy imaging revealed that cytotoxic levels of Aβ42 caused morphological changes including cell membrane damage, cytoskeletal disruption, and impaired cell adhesion; cell damage was ameliorated by cellular cholesterol depletion.
Conclusions:
Cholesterol depletion impacted the effects of Aβ42 on HT22 cell viability, morphology, and receptor tyrosine kinase signaling.
Keywords
INTRODUCTION
The lipid membrane plays a pivotal role in the pathogenesis of Alzheimer’s disease (AD) [1], both as the site of production of amyloid-β (Aβ) and a target for Aβ disruption. In AD, synapses and dendritic spines are lost through a process involving the accumulation of toxic Aβ; however, the hypothesis that amyloid is the primary cause of AD (“amyloid cascade hypothesis”) has been called into question as a result of failed clinical trials and a lack of correlation between amyloid load and disease progression [2, 3]. Regardless of whether or not amyloid is the primary cause or a secondary downstream insult, the factors that predispose neurons to amyloid toxicity need to be fully elucidated. The initial events that lead to amyloid overproduction, accumulation, and toxicity are not precisely clear, though multiple lines of evidence point to a role for lipids in AD pathogenesis. Epidemiology and genetic studies have identified a connection between AD and lipid homeostasis, such as in chronic metabolic disease (e.g., type II diabetes), dyslipidemia, and the strong association of AD risk with apolipoprotein (APOE) allele [4]. Moreover, direct brain lipidomic studies show changes in brain lipid composition in AD patients compared to age-matched controls [5, 6]. Studies into the molecular and cellular mechanisms of AD also indicate a role for lipids in the production and toxicity of Aβ. The production of Aβ from the amyloid-β protein precursor (AβPP) occurs at and depends on the lipid membrane as it is initiated by membrane-associated enzymes, β- and γ-secretases [4, 7]. For example, Aβ production has been shown to increase with membrane cholesterol levels as a result of presenilin 1 and 2 recruitment to the lipid bilayer where AβPP is cleaved [8, 9]. Accumulation of Aβ results in toxic aggregation that damages the neuronal membrane [10], interferes with specific receptors [6], and causes downstream neuronal signaling disruptions which appear to be connected neuronal and glial cholesterol [8, 11].
Aβ is known to disrupt the lipid membrane which is thought to trigger cell toxicity mechanisms through increased membrane permeability, oxidative stress, and metabolic dysfunction [12, 13]. Aβ aggregates into different structures which can have unique interactions with the lipid membrane [14, 15]. Binding of Aβ oligomers to the lipid membrane produces topographical defects which result in structural changes to the lipid membrane that can increase membrane permeability, causes depolarization of the membrane, and eventually oxidative stress—overall resulting in cellular toxicity [15–22]. In model lipid systems, membrane lipid composition has been shown to render lipid membranes more susceptible to amyloid-induced membrane permeabilization, which has been associated with changes in membrane structure [23]. In cells, the binding of Aβ to neuronal cell membranes can also interfere with neuron signaling, whether through direct binding of Aβ to membrane receptors, or again, indirectly, through non-specific binding and disruption of the lipid membrane [6, 25]. The extensive loss of grey matter in AD is preceded by morphological changes at the cellular level where synaptic density of dendritic spines is reduced, effectively decreasing the number of connections between neurons [10, 27]. Aβ also appears to exhibit toxic effects that are cholesterol dependent, where increased cholesterol content increased susceptibility of cells to Aβ toxicity; however, there have been conflicting reports in this area reporting the opposite effect in different models [11, 29]. Cholesterol and sphingomyelin-enriched lipid rafts compartmentalize different membrane receptor signaling pathways, with Aβ binding preferentially to lipid rafts containing gangliosides [14, 30–34]. The membrane properties of lipid rafts can affect receptor signaling pathways through mechanisms involving membrane protein conformational dynamics, protein recycling, trafficking, and distribution [35, 36]. Therefore, it should be expected that there are direct and indirect effects of amyloid on membrane receptors, those due to amyloid binding to the receptor and those due to disruption of membrane structures.
Several receptor signaling pathways have been shown to be impaired by Aβ, including: vascular endothelial growth factor (VEGF) receptor [24, 38]; insulin receptor [39, 40]; glutamate receptors, both metabotropic and ionotropic receptors [6, 41]; tyrosine receptor kinase B (TrkB) receptors, whose ligands are neurotrophin-3 and brain-derived neurotrophic factor [42–44]; and platelet-derived growth factor receptor-β (PDGFR-β) [45]. Many of these belong to the class of growth factor receptors called receptor tyrosine kinases (RTKs), which are important for growth and differentiation during development, and for maintenance of healthy cells and tissues with aging. The canonical signaling pathway of RTKs is initiated by dimerization following ligand binding, a process that depends on lateral trafficking within the membrane [46, 47]. Thus, it could be expected that these receptors are sensitive to changes in membrane microdomain structure induced by alterations in cholesterol content, lipid composition, and Aβ-induced damage in AD [48]. These RTKs and several important downstream secondary messengers have been shown to be involved in AD and Aβ pathology including those in the mitogen-associated protein kinase pathway (MAPK), namely the extracellular receptor kinase 1 and 2 (ERK1/2) [49]; the activation of phospholipase C-γ1 (PLCγ1) which is a membrane-associated protein that directly associates with some RTKs [50, 51]; and glycogen-synthase kinase-3β (GSK3β) which is involved in Aβ toxicity and tau phosphorylation [52, 53].
In this study, the interplay between cholesterol and Aβ1 - 42 on the health, function, and cell signaling of HT22 cells was explored through multidisciplinary approach [54]. Membrane cholesterol was depleted by treatment with methyl-β-cyclodextrin (MβCD), a common approach used to study the cholesterol dependence of membrane microdomains and membrane-receptor interactions [55–57]. Cells with normal and low cholesterol were then exposed to either unaggregated monomeric or preformed oligomeric Aβ42 and the toxicity assessed. To ascertain the effects of combined treatment with Aβ42 and cholesterol depletion on cell signaling, we also applied PDGF-AA to stimulate PDGFRα signaling in the HT22 cells with normal and low cholesterol and in combination with low and high concentration Aβ42. After confirming that MβCD was effective at reducing cell cholesterol and that Aβ42 had no effect on cholesterol metabolism we measured the combined effects of Aβ42, cholesterol depletion, and PDGF-AA treatment on cell toxicity and signaling. RTK proteomic ELISA profiler kit was used to identify PDGFRα as a dominant RTK in HT22 cells. Thus, PDGF-AA was chosen to stimulate HT22 cells to assess the effects of Aβ and cholesterol depletion on RTK signaling. We measured expression and activation of PDGFRα and several downstream targets, including ERK1/2, GSK3β, and PLCγ1 by western blot. Phase contrast optical microscopy was used in combination with atomic force microscopy (AFM) to characterize 2D and 3D morphological effects of cholesterol and Aβ42 on HT22 cells. Overall, cholesterol depletion was mildly protective against Aβ42. Although Aβ42 interfered with PDGFRα signaling, cholesterol depletion was far more disruptive to PDGFRα signaling. In addition, cholesterol depleted cells were more susceptible to Aβ42 induced receptor disruption following PDGF-AA stimulation. This work contributes to a further understanding of the mechanisms of amyloid toxicity pertaining to lipid membrane composition, especially cholesterol, and demonstrates that both cholesterol and amyloid disrupt RTK signaling in HT22 neuronal cells.
MATERIALS AND METHODS
Cell culture
HT22 cells were cultured in Hyclone DMEM/F12 media (Cytiva, USA) supplemented with 10% FBS (Hyclone characterized, Canadian origin, Cytiva, USA), and 1% pen/strep (Gibco, Thermo Scientific, USA) at 37°C with 5% CO2 in a humidified environment. Cells were plated into 96- or 6-well BioLite cell culture treated plates (Thermo Scientific, USA) at a cell density of 100,000 cells/ml. For MTT assays, cells were plated in 96-well plates, and treated in triplicate. For cholesterol oxidase assays, western blot, and optical microscopy HT22 were cultured in 6-well. Cells were incubated for 20-24 h until 50–60% confluent, then cell culture media was exchanged to differentiation media composed of phenol-red free Neurobasal media (Gibco, Thermo Scientific, USA), with N2 supplement (Gibco, Thermo Scientific, USA), and 2 mM L-glutamine (Gibco, Thermo Scientific, USA) according to protocols commonly used in HT22 cells elsewhere [58, 59]. Cells were left to differentiate for 22–24 h until 75% confluent. After differentiation, cells were treated with 0.5% methyl-β cyclodextrin (BioReagent for cell culture, Sigma Aldrich, USA) for 1 h to remove cholesterol. Cell culture media was then replaced with fresh differentiation media and treated with Aβ in different aggregation states across a range of concentrations from 1 to 10μM for 24 h before further analysis. Cell culture scheme is shown in Fig. 1.
Amyloid-β preparation and structural analysis
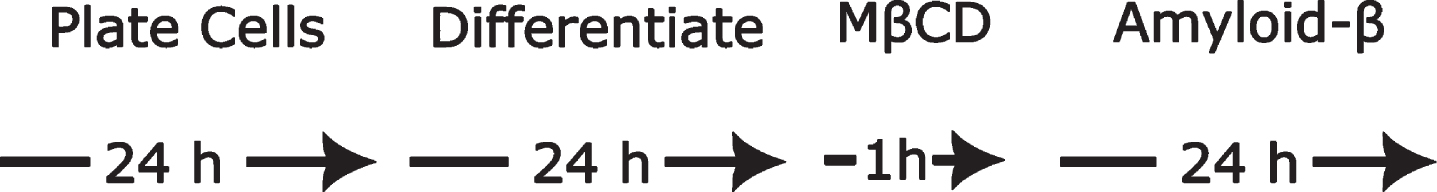
Cell culture model with readouts performed following Aβ42 treatment.
Recombinant Aβ1 - 42 HFIP (hexafluoroisopropanol) (rPeptide, USA) was prepared in monomeric or oligomeric forms according to a modified version of protocols by Stine et al. [60], similar to previous studies [45, 61]. Briefly, 1 mg lyophilized Aβ1 - 42 was dissolved in 1 ml HFIP, and 100μg was aliquoted into microcentrifuge tubes where HFIP was left to evaporated under anhydrous vacuum for 24 h, before being moved to –20°C freezer until needed. To produce monomeric Aβ, on treatment day, 100μg Aβ was dissolved in 4.17μl DMSO (5 mM solution), sonicated for 10 min, then diluted to 100μM in supplemented neurobasal media. For oligomeric Aβ, monomeric solution is prepared as above and then incubated overnight at 4°C for 24 h. To characterize the structure of Aβ monomers and oligomers, solutions were diluted in MilliQ water (18.2 MΩ) to 10μM than solutions were pipetted onto freshly cleaved mica substrate for 10 to 15 min. Aβ solution on mica was then rinsed with equivalent volume of MilliQ water 3 times then samples were dried and placed into clean petri dishes for later imaging. Imaging was performed using JPK Nanowizard II, in tapping mode using TESP-V2 (tapping-mode etched silicon probes) from Bruker, USA.
Cholesterol oxidase assay
Fluorometric Amplex Red Cholesterol Assay Kit (ThermoFisher Scientific, USA) was used to measure cholesterol content of HT22 cells, with modifications for cell culture applications. Cells were plated into 6-well plates. After treatment, cells were washed with 1 ml ice-cold PBS. 500μL of reaction buffer (according to manufacturer’s instructions), was added to each well, a cell scraper was used to remove cells, homogenized through high gauge (0.22) needle, then transferred to microcentrifuge tube by pipet. Samples were then boiled for 10 min to inactivate endogenous cellular cholesterol esterases and other enzymes that might interfere with Amplex detection reagent. Reaction reagents were prepared according to manufacturer’s instructions (Amplex Red, HRP, cholesterol oxidase) and loaded into 96-well plates in triplicate. Homogenates were then transferred into reaction reagent solution in 96-well plate, placed in incubator for 30 min at 37°C, then read in plate reader at 530 to 560 nm excitation and 587 nm emission. The bicinchoninic acid (BCA) protein assay (Thermo Scientific, USA) was used to normalize for total protein content.
MTT assay
3-(4,5-dimethylthiazol-2-yl)-2,5-diphenyltetrazo-lium bromide (MTT) assay (Sigma-Aldrich, USA) was used to measure Aβ toxicity after cholesterol removal. After treatment, cell culture media was exchanged for supplemented neurobasal media containing 0.5 mg/ml MTT solution, then cell culture plates were returned to 37°C at 5% CO2 in a humidified environment for 3.5 h. After incubation, cells were lysed and formazan product within cells was solubilized using a 0.1% HCl, 90% isopropanol, and 10% Triton X-100 solution. Absorbance measurements were then made at 570 and 690 nm, with the 690 nm background signal subtracted from the 570 nm signal for data analysis. The effect of recombinant human PDGF-AA (Cedarlane, Canada) and cholesterol depletion to rescue cells from 5μM Aβ toxicity was also measured using the MTT assay. Following cholesterol depletion with MβCD, cells were treated with either 5μM Aβ monomers, 25 ng/ml PDGF-AA (approximately 0.865 nM dimers), or both for 24 h. MTT assay was performed as described.
Phase contrast optical microscopy
After treatment, cells were imaged using Olympus IX51 compound inverted optical microscope at 4x and 10x magnification using identical lighting, contrast, and camera settings. For both monomers and oligomers, n = 6 independent plates across multiple passage numbers were imaged, with n = 2 wells per passage for a total of N = 12 images analyzed per treatment group. For image quantification (Supplementary Figures 10 and 11), raw data was imported into ImageJ, converted into 8-bit grey scale, contrast enhancement of 5% (including histogram normalization) for each image was applied. Threshold was set manually for each image to minimize background image artifacts (caused by shadows from condensation in the plate lids, differences in cell culture plate plastic, particulate within media), typical thresholds spanned 63 to 70 arbitrary units, varying no more than 10%. Noise was then reduced using the despeckle feature. ImageJ Analyze Particle feature (with Shape Descriptors, Area, and Perimeter) was then used to count cells and extract quantitative cell measurements. Size threshold for particles were set to 125μm2 and 175μm2 analysis was performed for both, circularity threshold was set from 0.00 to 1.00.
Atomic force microscopy/phase contrast optical microscopy overlays
After treatment HT22 cells were maintained at 37°C until ready for imaging. JPK Nanowizard II AFM (Bruker, USA), mounted on Olympus IX71 equipped with 40x LCAchN objective was used for phase contrast microscopy. MLCT AFM probes were used for contact mode imaging, cantilever nominal spring constant k = 0.01 N/m with nominal tip radius 20 nm. Immediately prior to imaging, cell media was exchanged for Hanks Buffered Saline Solution (calcium, magnesium, no phenol red from Gibco). Live cells were then imaged in ambient conditions for no more than 45 min.
Western blot
HT22 cells were cultured and treated as described above. After imaging, cells were treated with 32 ng/ml PDGF-AA (Cedarlane, Canada) for 10 min or left as untreated controls (baseline), n = 5 was performed for cells treated with monomers and oligomers. To harvest cells after treatment, the 6-well plates were placed on ice, then cells were washed with ice cold phosphate buffered saline (PBS). Next, 70μL of solubilization buffer (20 mM Tris-HCl at pH 7.5, 150 mM NaCl, 1 mM EDTA, 1 mM EGTA, 30 mM sodium pyrophosphate, 1 mM β-glycerophosphate, 1 mM sodium orthovanadate), containing Triton X-100 detergent (1%) and HALT protease and phosphatase inhibitor (Thermo Scientific, USA) was added to each plate and cells were detached using a cell scraper. Cells were then transferred into chilled microcentrifuge tubes and lysed through a cold 22-gauge hypodermic needle at least 20 times. After lysing, cells were spun in centrifuge at 15,000× g for 20 min to separate the supernatant. Supernatant was transferred to cold microcentrifuge tube and stored at –20°C until ready for western blot.
Total protein concentration was quantified for each sample by BCA assay. Samples were mixed with 3x loading buffer (240 mM Tris-HCl at pH 6.8, 6% w/v sodium dodecyl sulfate (SDS), 30% v/v glycerol, 0.02% w/v bromophenol blue, 50 mM DTT, and 5% v/v β-mercaptoethanol) and boiled for 5 min before 15μg of total protein was loaded into 8% or 4–16% gradient polyacrylamide gels for electrophoresis (PAGE). SDS-PAGE was run on 15-well, 1.5 mm gels with Fisher EZ run pre-stained Rec protein ladder with 1-2 control lanes per gel at 70 V for 30 min and then at 120 V for 90–120 min. Running buffer composition was 25 mM tris base, 190 mM glycine, 3.5 mM sodium dodecyl sulfate. After SDS-PAGE, protein was transferred to nitrocellulose membranes in chilled transfer buffer (25 mM Tris-HCl, 190 mM Glycine and 20% v/v methanol) for 90 min in constant voltage mode at 100 V, or for 16 h in constant current mode at 42–50 mA such that the resultant voltage was ∼30 V. Membranes were than washed in Milli-Q water before being placed into blocking buffer (tris buffered saline 20 mM Tris, 150 mM NaCl, pH 7.4 plus 0.1% Tween (TBST)) containing either 5% non-fat milk or 5% bovine serum albumin (BSA, Promega, USA) for minimum 1 h at room temperature or overnight at 4°C. Membranes were then incubated in primary antibody in matching blocking buffer for 1-2 h at room temperature or 12-18 h at 4°C on a rocker. After incubation with primary antibody membranes were washed in TBST three times for 10 min under gentle rocking. Secondary antibody was diluted at 1:5,000-10,000 in blocking buffer and was added to the membranes for 1 h. Membranes were then washed three times for 10 min in TBST. Luminata crescendo Western HRP substrate (Sigma Millipore, USA) for chemiluminescence detection was then added to membrane for 5 min. Membranes were then imaged using iBright FL1500 imaging station (ThermoFisher, USA) using the auto-exposure setting, if pixel saturation was observed, reduction in exposure time was adjusted manually. The background corrected density was computed by the iBright system and used for analysis. Phosphorylated protein levels were measured as a means to quantify protein activation and were expressed as a fraction of the normalized total protein signal.
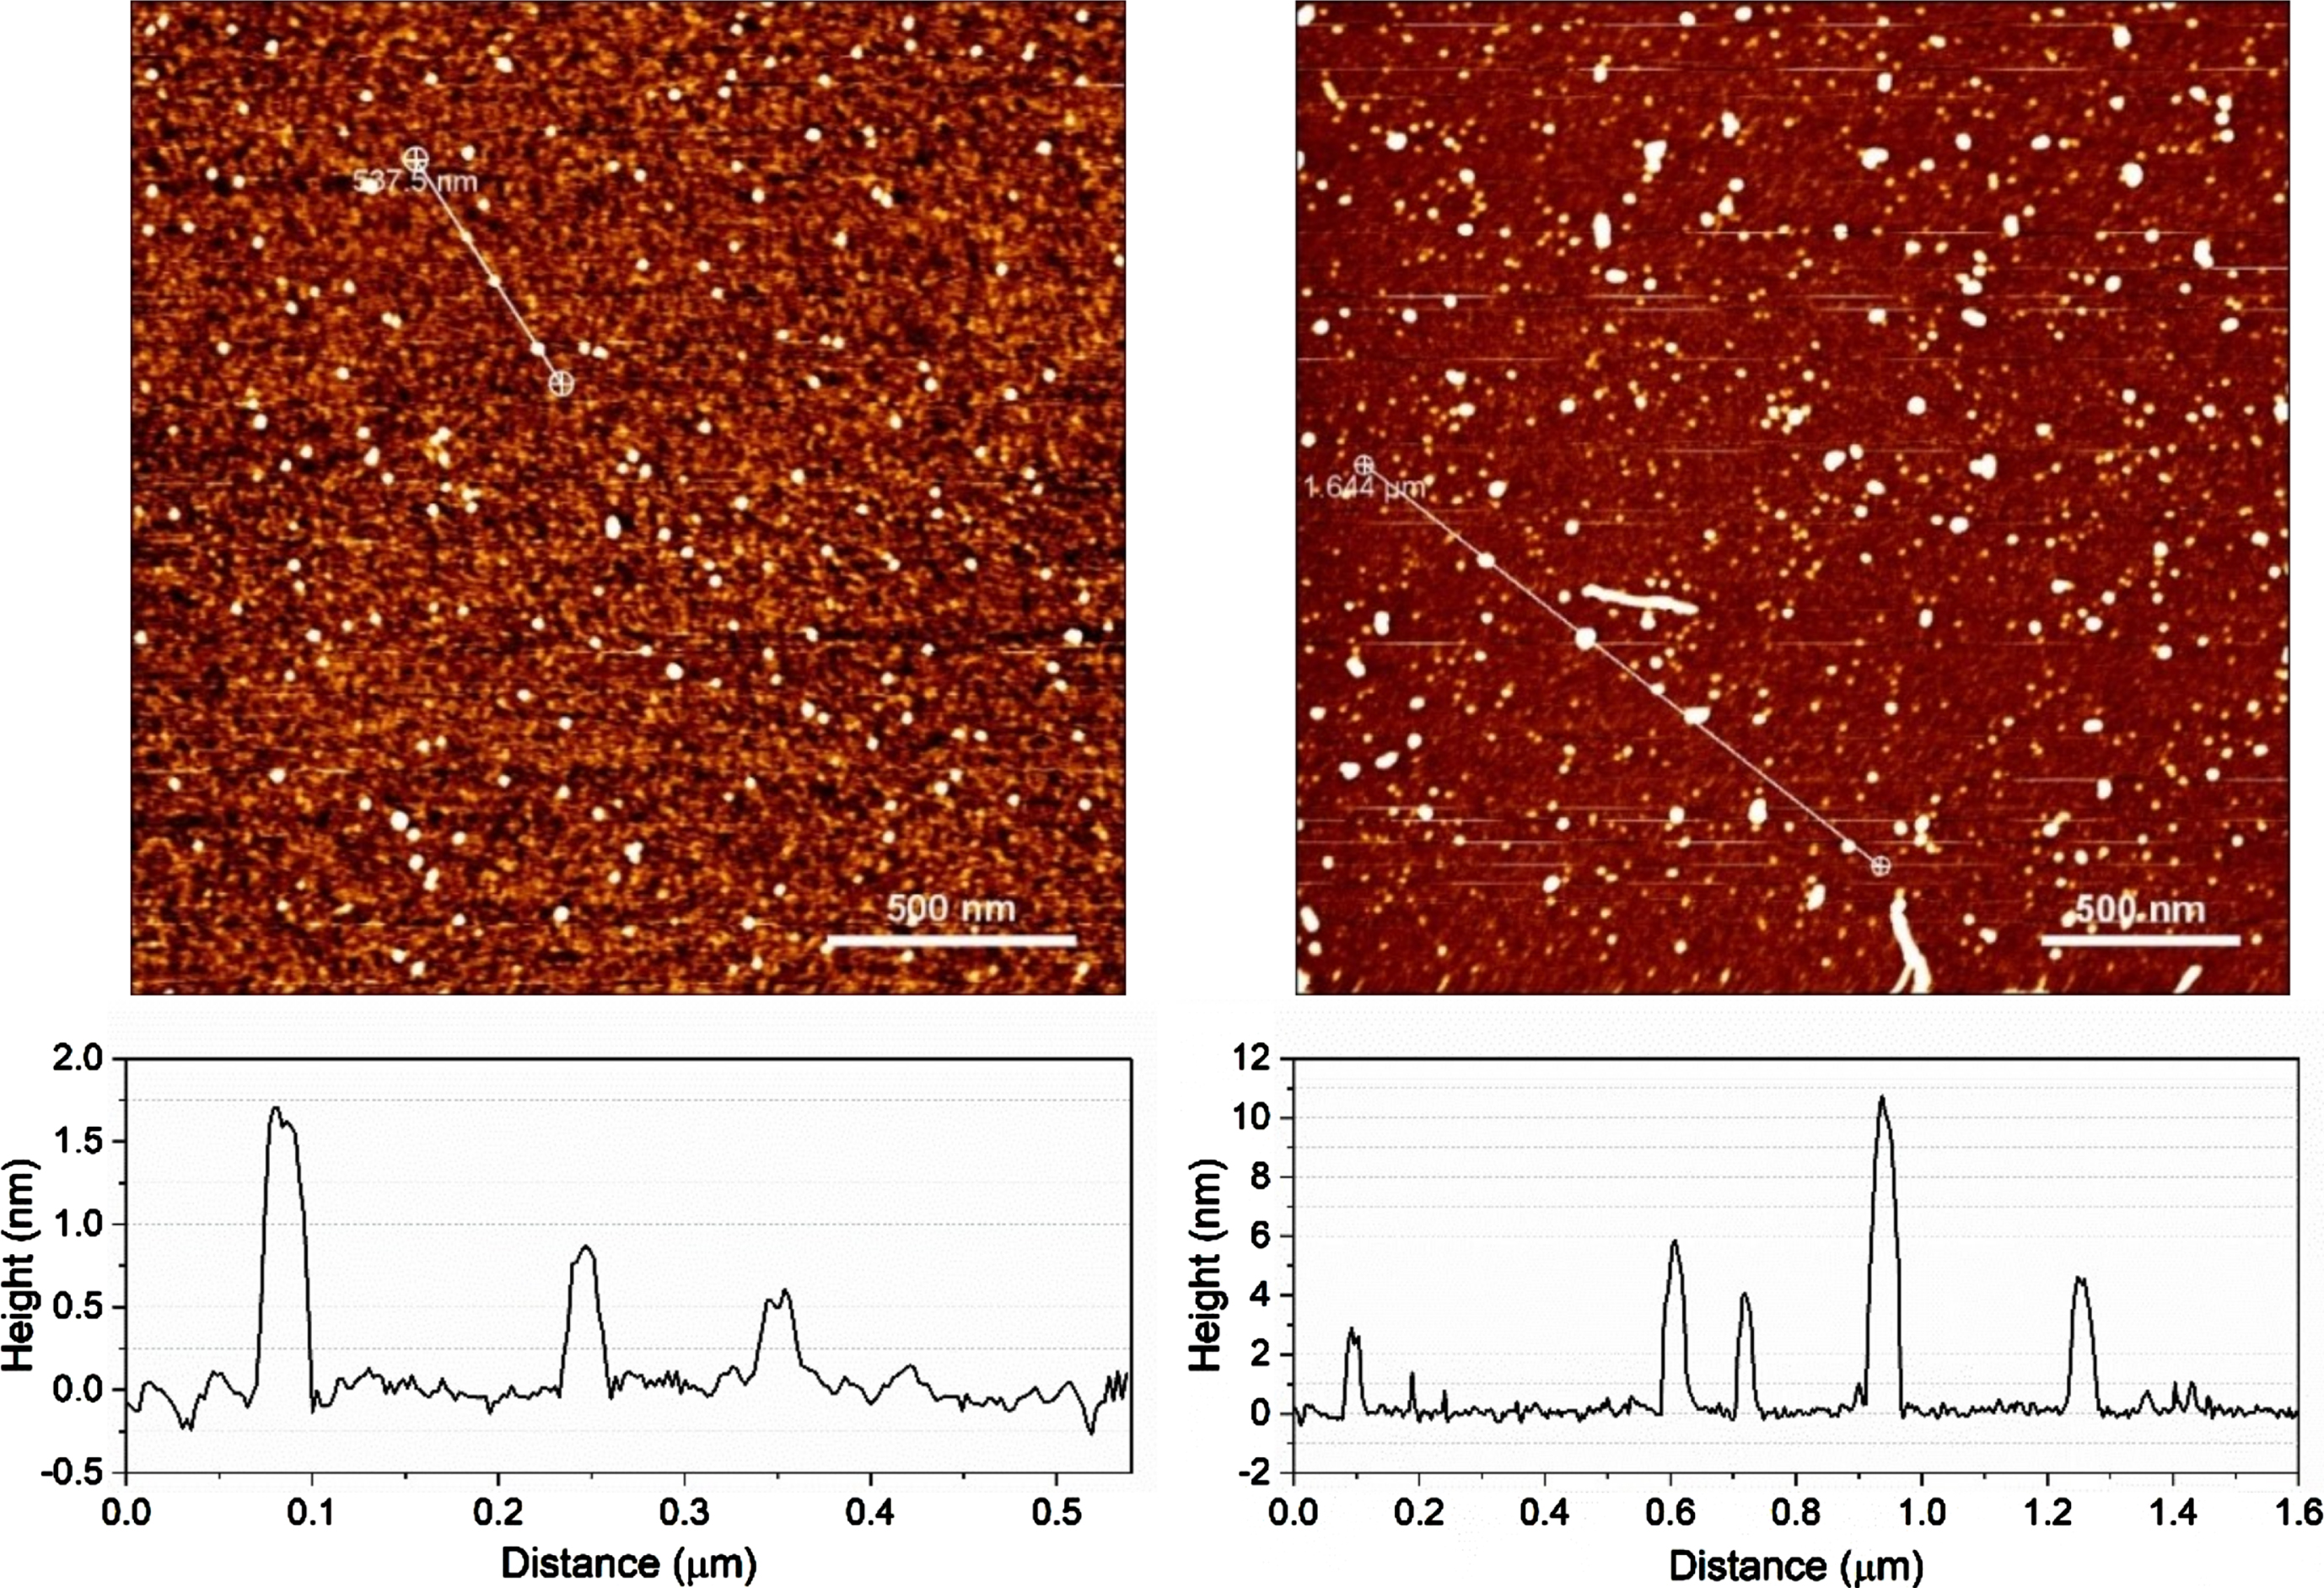
AFM images of monomeric and oligomeric amyloid-β on mica. (left) Monomeric Aβ had typical particle size of 0.5–1.5 nm, (right) whereas Aβ oligomers were much larger with particle sizes ranging from 0.5 to 12 nm.
Statistical analysis
For amyloid dose response MTT assays, ordinary two-way ANOVA was performed with cholesterol and Aβ as the two main factors, α= 0.05, for at least n = 5; Tukey’s multiple comparisons post hoc test was used to identify significance of cholesterol’s protective effect at specific Aβ doses. For PDGF-AA MTT assays, ordinary two-way ANOVA was performed with PDGF-AA and Aβ as the two main factors for low and normal cholesterol separately, α= 0.05, n = 5; Tukey’s multiple comparisons post hoc test was used for pairwise comparison between PDGF-AA versus no PDGF-AA. For western blotting data, ordinary two-way ANOVA (with Tukey’s multiple comparisons), was used to assess the significance of PDGFRα activation with cholesterol and Aβ as the two factors, α= 0.05, for n = 5. The ANOVAs were performed separately for baseline cells and cells stimulated with PDGF-AA.
RESULTS
Verification of Aβ42 aggregate structure
AFM was used to characterize the aggregation state of Aβ42 and to confirm that preparations contained little to no fibrils (Fig. 2). Monomeric Aβ42 had typical particle sizes of 0.5–4 nm, whereas Aβ42 oligomers had larger particle sizes and higher variability ranging from 2 to 15 nm, with some protofibrils detected. A total of n = 6 independent Aβ42 oligomer preparations with N = 24 images and a total of n = 4 monomeric preparations with N = 11 images were collected.
HT22 cholesterol metabolism
In this report, 0.5% MβCD treatment for 1 h was sufficient to cause a reduction in cholesterol levels immediately following treatment to 52±9 % of control levels. Cholesterol content returned to 57±4 % at 8 h and to nearly normal control levels (90±20 %) after 24 h, though large variance was observed at this longer time point (Fig. 3). There was no statistically significant difference in the levels of cholesterol or the rate of cholesterol recovery when HT22 cells were treated with unaggregated Aβ42 monomers (Fig. 3).
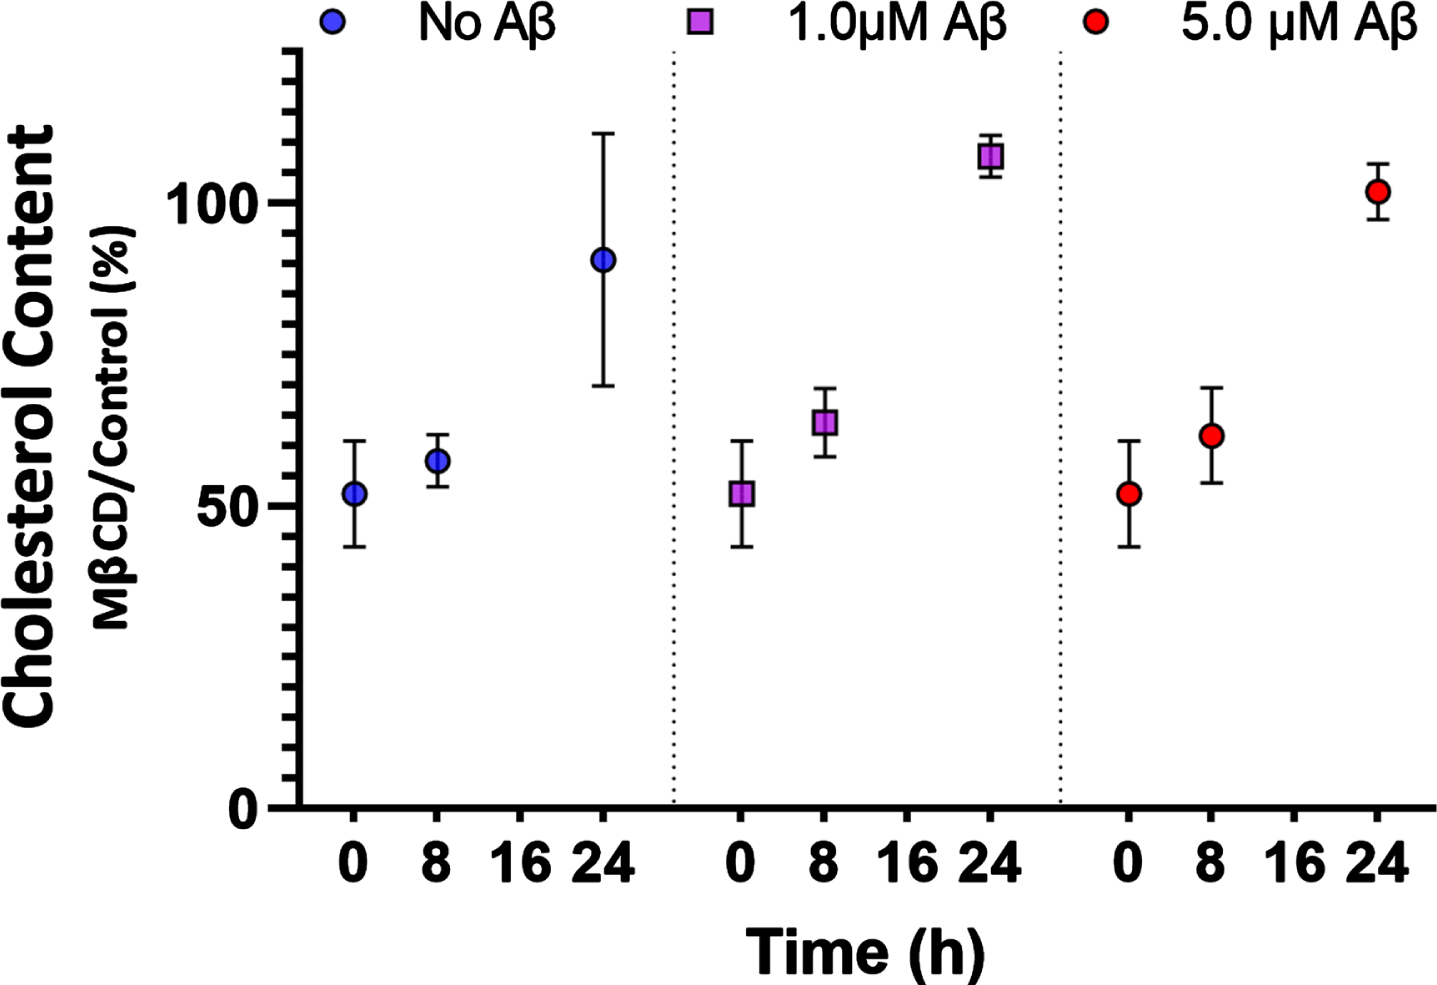
Cholesterol reduction following MβCD treatment (0 h) was 52±9 % (n = 6). Cholesterol remained low after 8 h at 57±4 % (n = 4) but was fully recovered after 24 h to 90±20 % (n = 4). Aβ42 at 1.0μM and 5.0μM did not affect cholesterol recovery (n = 4). Plotted as mean±SEM.
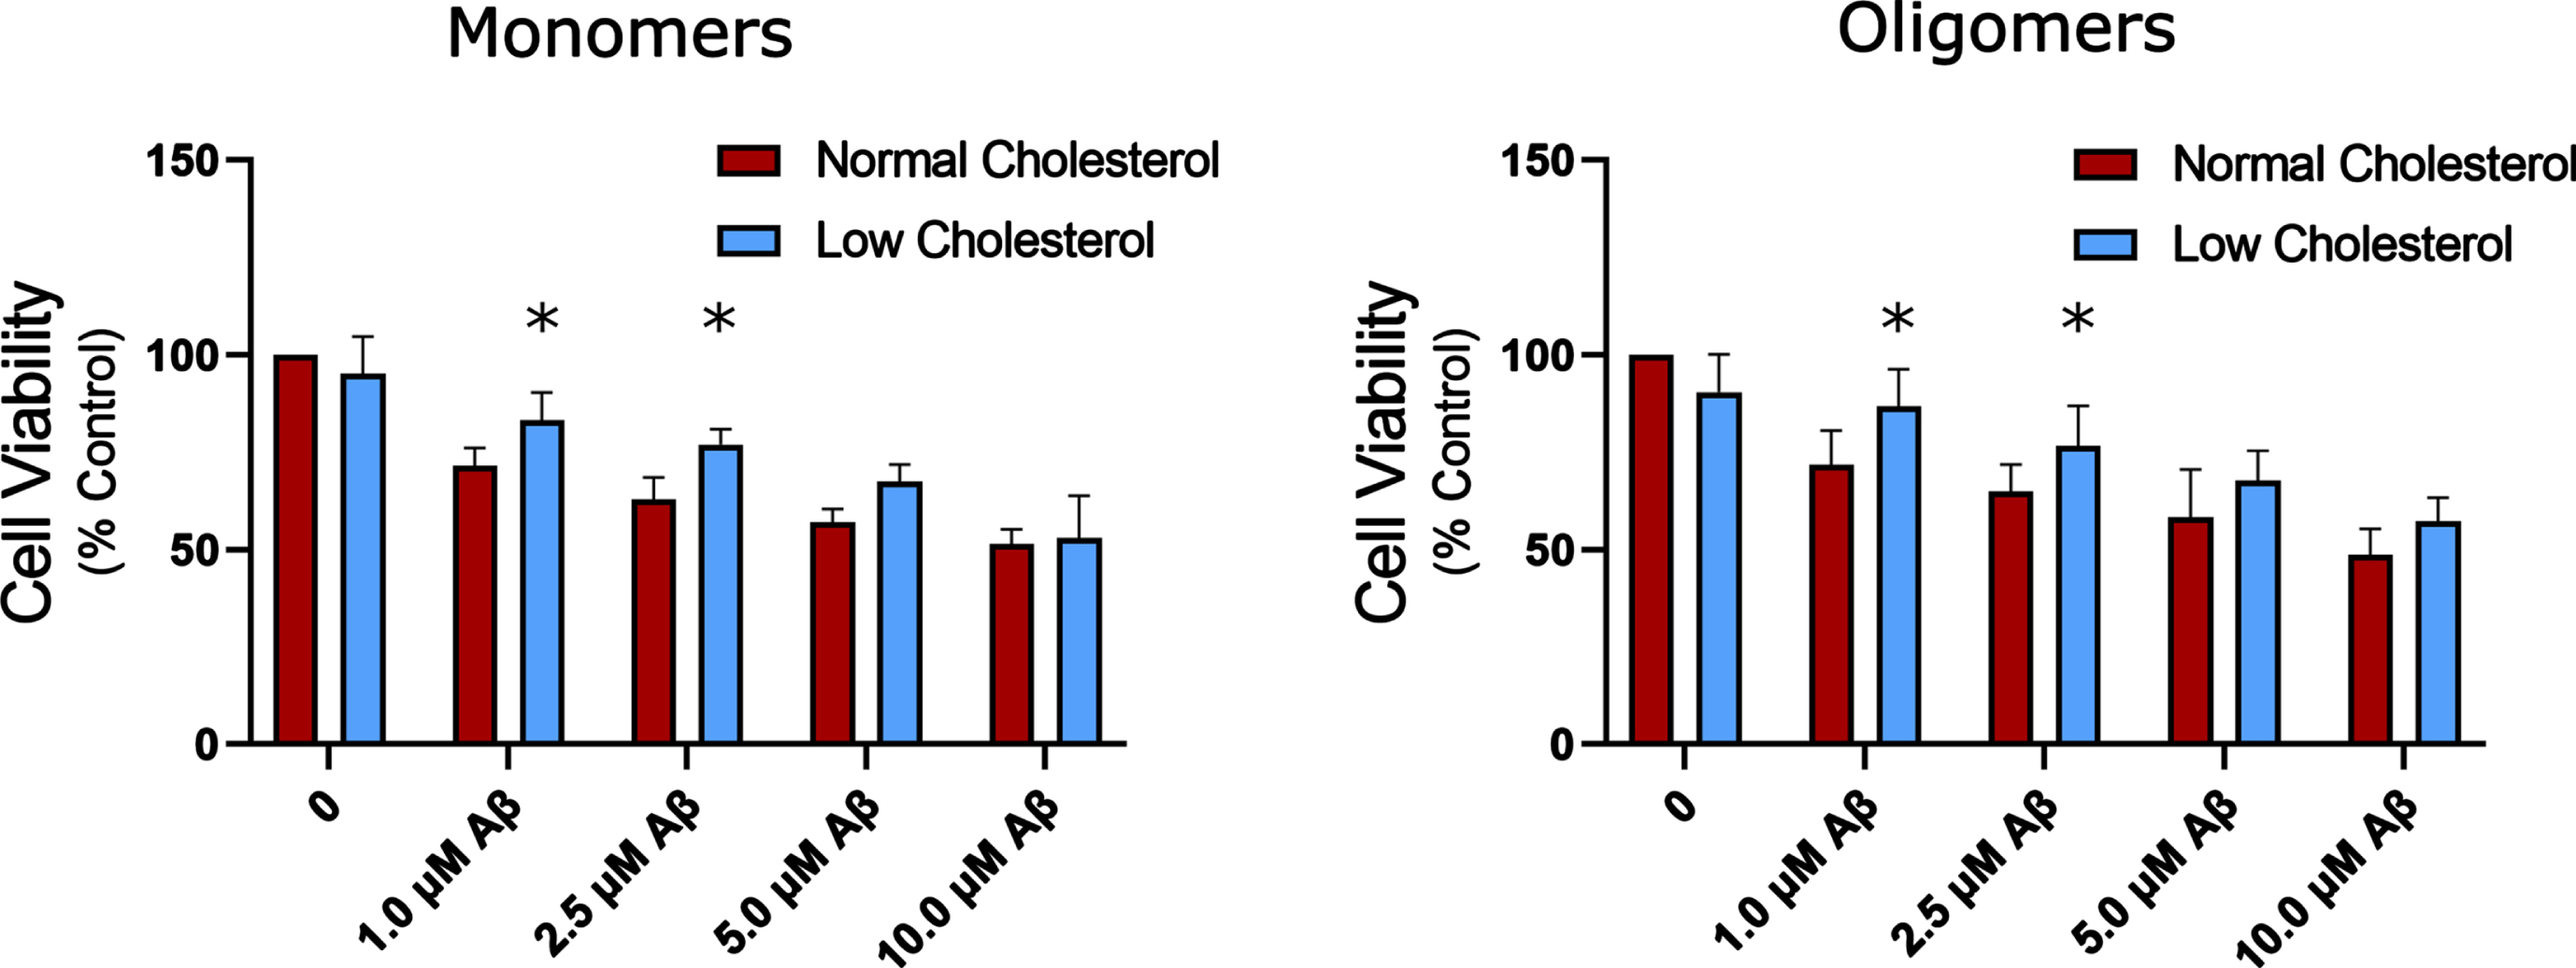
Cell viability following application of increasing Aβ monomers and oligomers to HT22 cells with normal and depleted cholesterol levels. Two-way ANOVA found no interaction between cholesterol depletion and amyloid. A Statistically significant main effect was found showing cholesterol depletion has a small protective effect compared to normal cholesterol for both oligomers and monomers (n = 4 for monomers, n = 7 for oligomers). Plotted as mean + SEM; * indicates p < 0.05 compared to normal cholesterol, two-way ANOVA with Tukey’s multiple comparison.
The effect of cholesterol reduction on amyloid-β toxicity
In the present study, monomers did not exhibit any significant reduction in toxicity compared to oligomers on HT22 cells, where unaggregated monomeric and oligomeric Aβ42 exhibited nearly identical dose response (Fig. 4). This is most likely due to substantial aggregation over the 24 h, 37°C treatment period. This indicates that for HT22 cells, incubation times of 24 h are likely too long to properly assess differences in monomer vs oligomer Aβ42 toxicity prepared according to Stine et al. using the MTT assay. Regardless, cholesterol depletion was protective against both forms of Aβ42 (Fig. 4) as indicated by two-way ANOVA, with a mean main effect for cholesterol depletion of 10 to 12%, n = 4 and n = 7 for monomers and oligomers. When looking more closely at each concentration, with Tukey’s multiple comparison, cholesterol reduction exhibited a statistically significant reduction in Aβ42 monomer toxicity at 1μM and 2.5μM with an increase in cell viability of 11% and 14%, respectively. Cholesterol reduction also exhibited a protective effect against oligomeric Aβ42 at 1.0μM and 2.5μM of 15% and 12%.
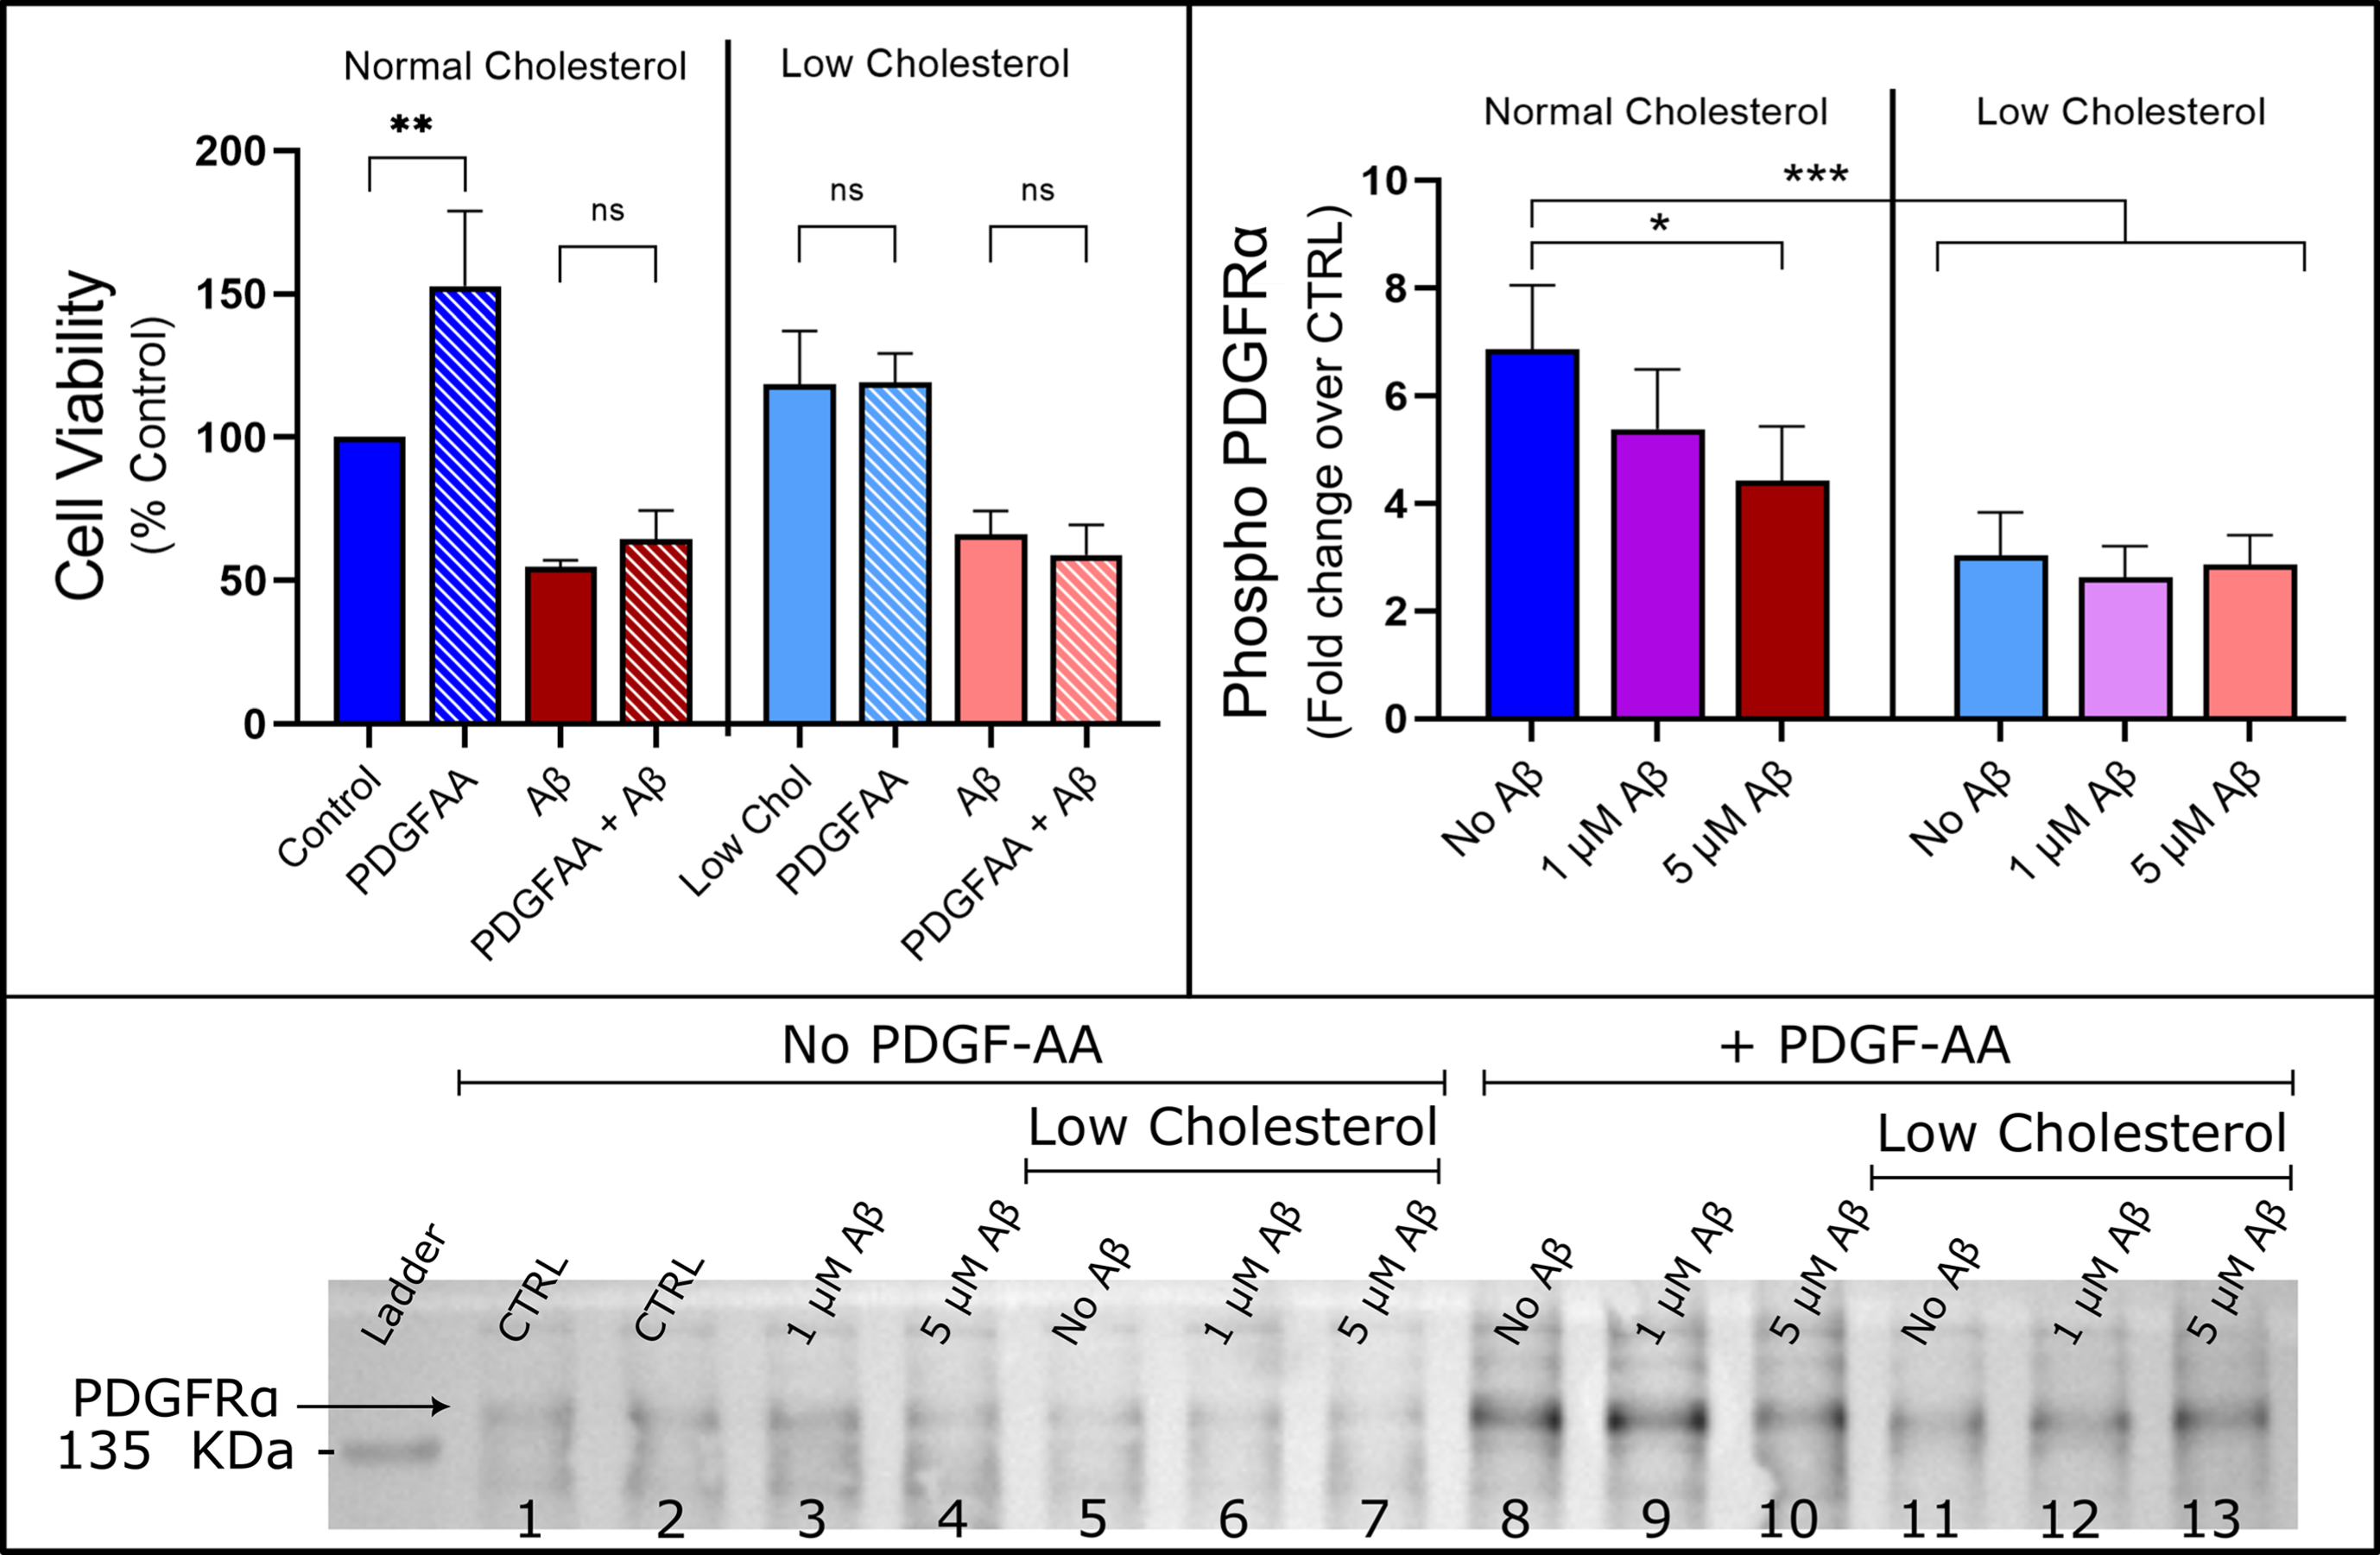
Aβ and cholesterol abolishes proliferation caused by PDGF-AA and reduces activation of PDGFRα receptor. Left: PDGF-AA increased cell viability by 53% over control (p < 0.05) but failed to rescue HT22 cells from Aβ toxicity. Cholesterol reduction had no statistically significant effect on cell viability and abolished the increase in cell viability caused by PDGF-AA by two-way ANOVA with Tukey’s multiple comparison (n = 5, Mean±SEM). Right: Cholesterol depletion and high concentration Aβ reduced phospho-PDGFRα levels (two-way ANOVA detected a main effect for amyloid and cholesterol depletion), n = 5. Mean±SEM. Bottom: Representative Western blot is shown for anti-Phospho-PDGFRα-Tyr849 antibody, summary data of the PDGF-AA negative controls are shown in the Supplementary Figure 4.
Effects of cholesterol and Aβ on PDGFRα signaling
We used a phospho-RTK proteomic profiler kit to identify active RTKs in unstimulated HT22 cells (Supplementary Figure 1). Only PDGFRα and ErbB2 receptors were identified as having significant baseline phospho-RTK activity and we confirmed the PDGF-AA stimulated the PDGFRα also using the phospho-RTK kit (Supplementary Figure 1). Using western blot, total TrkB expression in unstimulated HT22 cells was measured, with antibody that was raised against the extracellular ligand binding domain (data shown in Supplementary Figure 2). Total full-length TrkB could not be detected in differentiated HT22 cells, only truncated TrkB-Shc (truncated at the Src-homology domain-containing binding site) was able to be detected, with cholesterol depletion reducing the total amount of TrkB-Shc (Supplementary Figure 2). We sought to determine the effects of Aβ42 and cholesterol depletion on baseline PDGFRα signaling followed by PDGF-AA treatment to stimulate phosphorylation of PDGFRα and select downstream secondary messengers (ERK1/2, PLCγ1, and GSK3β). Overnight, 24 h, PDGF-AA treatment increased cell viability to 153±18% of control (Fig. 5). However, PDGF-AA failed to rescue HT22 cells from 5μM Aβ42 toxicity; there was no statistically significant difference between cells treated with 5μM Aβ42 alone (55±2%) and cells treated with combination of 25 ng/ml PDGF-AA and 5μM Aβ42 (64±10%). Cholesterol-depleted cells were unresponsive to PDGF-AA treatment at the level of cell viability as tested with the MTT assay (118±19% compared to 119±10%), implying PDGF-AA was not able to stimulate metabolic activity of cholesterol-depleted HT22 cells. Cholesterol-depleted HT22 cells were modestly protected from Aβ42 (66±8%), while PDGF-AA had no protective effect on viability of cholesterol depleted cells (59±10%). This agrees with previous work in our lab, that indicated PDGF-BB induced proliferation of SH-SY5Y cells was impaired by 5μM Aβ42 [45].
We sought to characterize the effects of Aβ42 oligomers, cholesterol depletion and their interaction on PDGFRα signaling by western blot, measuring total, and phosphorylated (phospho) protein levels of PDGFRα, ERK1/2, PLCγ1, and GSK3β. To do so, following differentiation protocol, cells were treated with 1μM Aβ42, 5μM Aβ42, or were depleted of cholesterol using MβCD and then treated with 1μM Aβ42 or 5μM Aβ42 before harvesting cells and measuring PDGFRα signaling to establish the effect on baseline activity. The same experimental conditions were then used but cells were stimulated with a 10 min PDGF-AA treatment prior to harvesting and western blot. Representative blots for all targets are shown in Supplementary Figure 9. In this study, PDGFRα expression was significantly reduced for both baseline and stimulated datasets in cholesterol depleted cells by approximately 40% for the baseline levels and 60% for stimulated cells (Supplementary Figure 3). When looking at PDGFRα expression there was no effect of Aβ42 at any concentration in baseline or stimulated HT22 cells. There was also no interaction detected between Aβ42 treatment or cholesterol reduction in the total level of PDGFRα (two-way ANOVA).

ERK1 and ERK2 phosphorylation on baseline (Left) and PDGF-AA stimulated (Right) HT22. Left: 5μM Aβ oligomers caused an increase in baseline phosphorylation of ERK2. This effect was not observed in cholesterol reduced cells and an interaction between cholesterol and Aβ was detected by two-way ANOVA p < 0.05. There was a clear and consistent trend of PDGF-AA treatment activating downstream ERK2 causing phosphorylation. Unlike in baseline, there was no significant increase in ERK2 activation following PDGF-AA treatment in the high concentration Aβ group two-way (n = 5). ERK1/2 phosphorylation induced by PDGF-AA was significantly decreased in all low cholesterol groups (two-way ANOVA, Tukey’s multiple comparison p < 0.05*), an effect further compounded with high Aβ concentration (p < 0.01**). Mean±SEM reported (n = 5).
When looking at PDGFRα activation there was good phosphorylation signal at the tyrosine-857 residue, however neither the anti-phospho-PDGFRα Tyr754 nor Tyr1018 antibodies yielded signal (data not shown). PDGFRα activation was expressed as the ratio of phospho-PDFGRα-Tyr-857 to total PDGFRα, to account for changes in total receptor levels. There was no significant effect on baseline phospho-PDGFRα in any of the low cholesterol, Aβ42 treatment, or combination treatment groups (Supplementary Figure 4). However, following PDGF-AA treatment (Fig. 5, right pane), stimulated HT22 cells exhibited a large increase in PDFGRα activation over control baseline levels by a factor of 2.4 to 4.0 depending on cholesterol and Aβ42 treatment. In comparing the effects of Aβ42 treatment following PDGF-AA treatment there was a significant decrease in phosphorylation ratio in the normal cholesterol cells treated with 5μM Aβ42 oligomers by a factor of 2.4 (two-Way ANOVA, *p < 0.05 with Tukey’s multiple comparison). This suggests Aβ42 is disruptive to PDGFRα activation, which correlates with the observation from the MTT data (Fig. 5). There was a main effect for cholesterol depletion with a significant decrease in phosphorylation compared to cells with normal cholesterol levels by a factor of 3.8 to 4.0 (***p < 0.001, ANOVA with Tukey’s multiple comparisons). No interaction between cholesterol-depleted cells and Aβ42 treatment was detected. Overall, cholesterol reduction by MβCD had a far greater impact on disrupting PDGFRα receptor levels and activation than Aβ42, although the effects on the MTT assay from cholesterol depletion were not significant. PDGF-AA is a mitotic growth factor and thus the increase in cell viability could be due to increased proliferation of HT22 cells. PDGF-AA failed to rescue HT22 cells from Aβ42 toxicity and cholesterol reduction abolished the effect of PDGF-AA stimulation on HT22 cells.
In these experiments, there was no effect of any of the treatments on the total ERK1/2 expression levels (Supplementary Figure 5). Activation of ERK 1/2 was measured by dividing the phospho-ERK Threonine 202/204 signal by the total ERK signal for both ERK 1 and ERK 2, separately. The trends for ERK1 and ERK2 were nearly identical, the data for ERK2 is shown due to the better signal to noise. There was an interaction found between Aβ and cholesterol depletion in the ERK1/2 data. Where an increase in baseline ERK2 phosphorylation levels in response to toxic levels of Aβ42 (5μM) treatment (Fig. 6, left pane) was detected. However, this effect was abolished in cholesterol-depleted cells, which is in accordance with an interaction detected between cholesterol and amyloid in ERK1/2 activation in baseline HT22 cells.
The effects of Aβ42 and cholesterol depletion in stimulated cells after treatment with PDGF-AA on ERK1/2 activation are shown in Fig. 6 (right pane). The phospho/total ERK ratio was significantly increased for control HT22 cells by a factor of approximately 6.5±2.5 following PDGF-AA application. There was trend towards decreased ERK activation with increasing Aβ concentration, but the result was not significant (two-way ANOVA, n = 5). This is in stark contrast to the baseline data where an increase was detected at higher Aβ42 concentration. Significant decreases in ERK1/2 phosphorylation were detected in all stimulated, low cholesterol HT22 cells, with a compounding effect for low cholesterol cells treated with 5μM Aβ42 (Fig. 6, right pane).
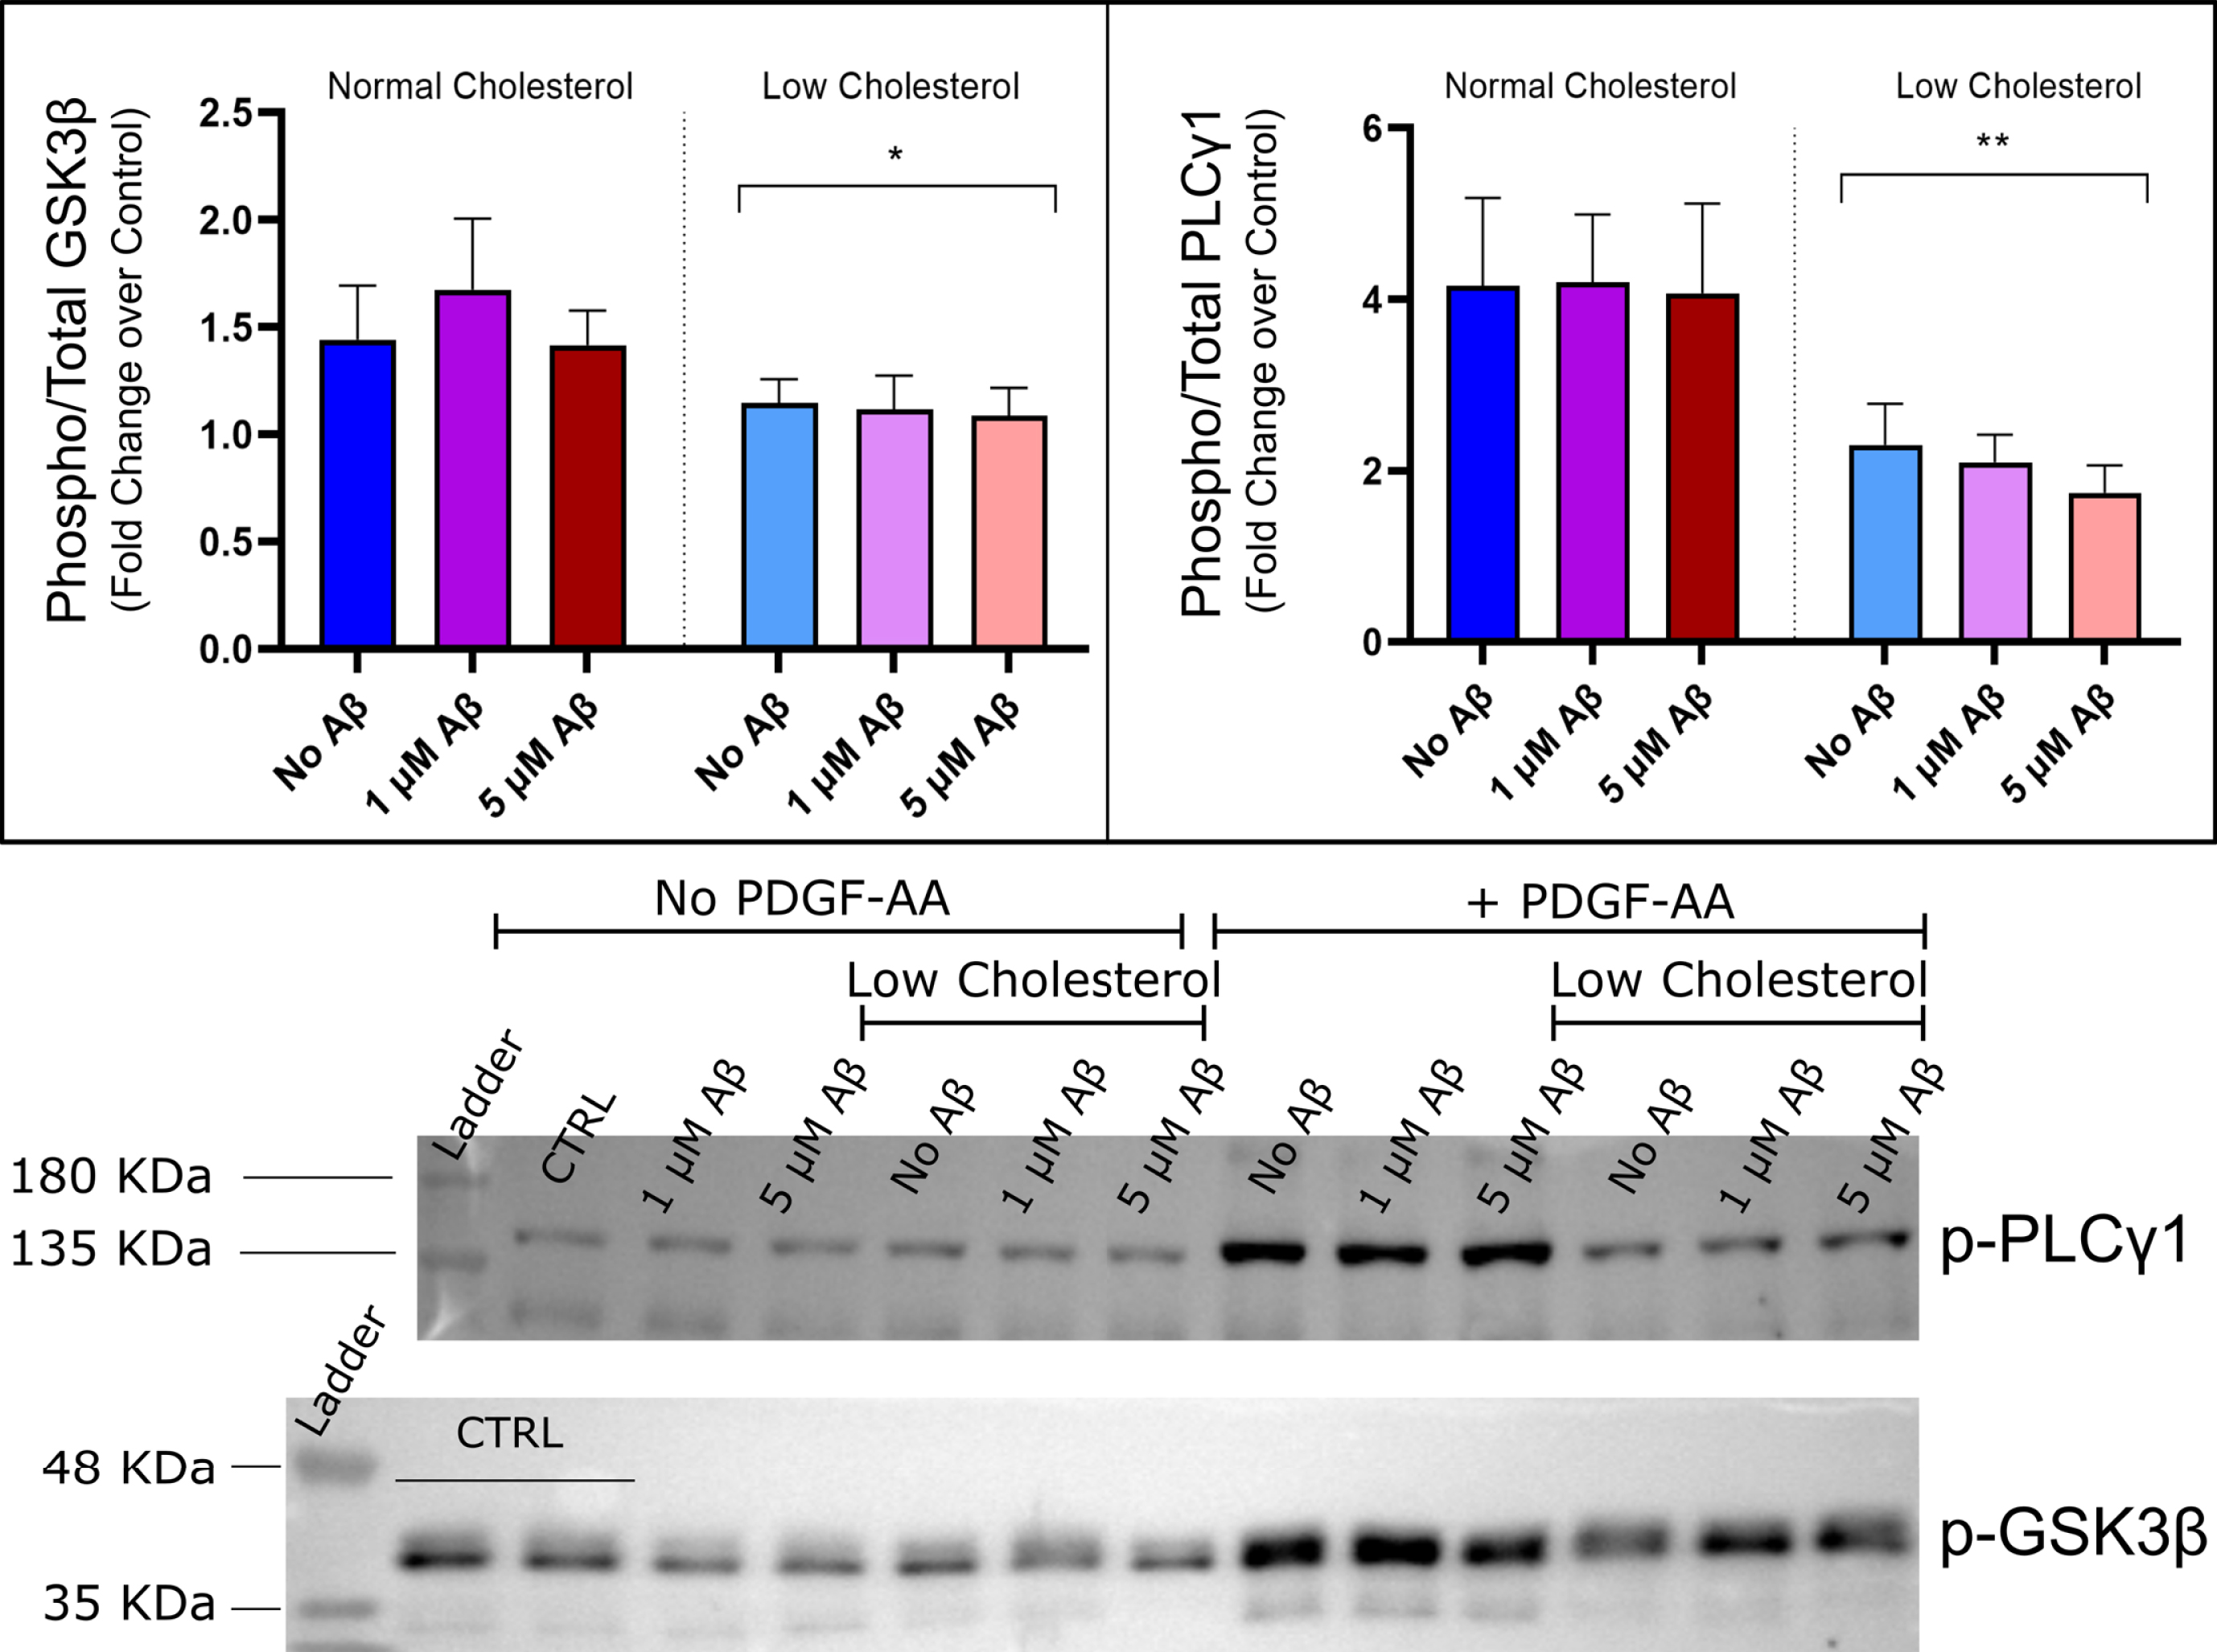
Effects on phospho-GSK3β-Ser9 and phosphor-PLCγ1 levels in cells stimulated with PDGF-AA. No interaction between amyloid and cholesterol factors were detected by two-way ANOVA. Observed a significant decrease in GSK3β Ser-9 and PLCγ1-Tyr-783 phosphorylation levels in low cholesterol groups compared to normal cholesterol. No effect of Aβ42 was detected, by two-way ANOVA, p < 0.05*. Mean±SEM reported (n = 5). Bottom: Representative Western blots are shown for anti-phospho-GSK-Ser9 and for anti-phospho-PLC?1-Tyr783 antibody, summary data of the PDGF-AA negative controls are shown in the Supplementary Figure 8.
PLCγ is a major downstream effector of many RTKs, with PLCγ1 being expressed in neuronal cell types. The effects of cholesterol depletion and Aβ42 treatment on PDGF-AA induced activation of PLCγ1 correlate with activation of PDGFRα and ERK1/2 signaling, results shown in Fig. 7 (right pane). Activation of PLCγ1 was measured by the phosphorylation of tyrosine-783 expressed as a relative ratio over the total PLC γ1 protein level. Like other experiments, there was no significant effect of any of the treatments on total protein levels in either the baseline or stimulated datasets (Supplementary Figure 6). Under baseline conditions there was no effect of Aβ42 or cholesterol depletion on phosphoPLCγ1 levels (Supplementary Figure 7, right). PDGF-AA stimulation resulted in activation of PLCγ1 as measured by a 4-fold increase in phosphorylation levels over untreated control. In the two-way ANOVA, there was no main effect of Aβ42, implying Aβ42 had no detectable effect of PLCγ1 activation (α= 0.05, n = 5). However, cholesterol depletion significantly reduced the levels of phosphorylation in all low cholesterol groups (two-way ANOVA, p < 0.05, n = 5), by approximately 2-fold. Under low cholesterol conditions, PLCγ1 activation was more significant and had a greater reduction with increasing Aβ42 concentration, shown in Fig. 7 (right pane) (p < 0.05* for low cholesterol, p < 0.01** for low cholesterol + 1μM Aβ and 5μM Aβ groups). Again, it was observed that cholesterol has a pronounced influence on the disruption of PDGF-AA induced activation of RTK signaling pathways that may be compounded by high concentration Aβ42, as with phospho-ERK1/2 data.
In the present study, there was no effect of any treatment on total GSK3β protein levels in HT-22 cells for baseline or stimulated data (Supplementary Figure 8). There were no effects observed here of cholesterol depletion or Aβ42 treatment on baseline GSK3β phosphorylation of serine-9 (Supplementary Figure 8). A small increase in serine-9 phosphorylation occurred with PDGF-AA stimulation by 40 to 70% for cells with normal cholesterol (Fig. 7, left pane). This increase did not occur for low cholesterol cells and was statistically lower than in normal cholesterol groups (two-way ANOVA, *p < 0.05, n = 5).
Atomic force microscopy and phase contrast optical microscopy
AFM can be combined with basic optical or fluorescence microscopy to correlate optical features with surface topology, in addition AFM can be used to probe cellular mechanics such as elastic modulus [22, 62–65]. Live AFM imaging of HT22 cells revealed valuable information about cell morphology not only overall shape, 3D volume, but also the actin-myosin cytoskeleton structure and cell surface topography. Figures in the Supplementary Material show several different representative undifferentiated (Supplementary Figure 13), differentiated (Supplementary Figure 14), and 5μM Aβ-treated differentiated HT22 cells (Supplementary Figure 15). The important quantities that can be extracted from AFM height images are cell volume and height profile of different regions of cells. There are two size regimes of cell topography, the overall size of the cell, on the order of 1.5–4μm, and the local nanoscale topography of the cell surface which includes lipid membrane and cytoskeletal features having height features under 100 nm. Imaging both simultaneously is not possible with standard contact mode AFM due to the extremely large differences in the scale of the overall cell and these nanoscale features, which vary by orders of magnitude. More specifically, optimization of the nanoscale structure of the cell would result in feedback parameters that are too sensitive to account for huge changes in vertical height, this results in oscillations of the AFM cantilever and probe that can damage cells. Therefore, feedback parameters were set to lower gain values to image the largescale structure of the cell, at the expense of the AFM height following the nanoscale topography. Even though the height images are not able to capture the nanoscale topography of some cells, bending of the cantilever under contact force allows for visualization of the actin-myosin cytoskeleton in the deflection images. The 3D shading effect occurs as the probe climbs up the cell exerting a greater force (higher intensity showing as bright on the image), than when the probe descends the other side of the cell (lower intensity showing up darker on the image). Because the membrane is susceptible to deformation and penetration, forces must be kept under 1 nN. Deformation of the cell under contact forces is still inevitable, so the AFM images provide an estimation of cell height and cytoskeletal structure under force, and a representation of a cell under vertical compression and shear stress.
AFM height images of HT22 cells can be analyzed to estimate cell volume and the heights of various parts of cells, for instance the cell body, or soma, which contains the nucleus, as well as the peripheral regions of the cell. In Fig. 8, the height distributions of HT22 cell soma containing the nucleus are presented for undifferentiated, differentiated and Aβ-treated cells. Undifferentiated cells were significantly taller than differentiated cells with a broader distribution of heights, 2.8±0.2μm compared to differentiated cells which had an average height of 2.1±0.1μm (mean ± SEM). This may be due to undifferentiated cells being in different stages of the cell cycle. For example, cell 3 in Supplementary Figure 13 shows an undifferentiated cell that is undergoing cell division, this cell has a height of 4.1±0.1μm, the next tallest cell in the undifferentiated cell population also had a much larger cell footprint and exhibited similar morphology. There were no cells detected in the differentiated population that had this large morphology. The differentiated control cells exhibited no significant difference in cell height compared to Aβ-treated differentiated cells 2.1±0.1μm compared to 2.1±0.3μm. The peripheral region of the cells, outside the nuclear region, had large variations in the height of the actin-myosin cytoskeletal stress fibers of over the regions in between them. In general, the heights of these stress fibers are between 90 and 220 nm above the surrounding cell surface regardless of the differentiation or Aβ treatment. The general cross section of cells is parabolic, where more than 90% of the cell volume is in the central region of the cell which contains the nucleus, a representative cross section and image is shown in Fig. 8. The fact that the cytoskeleton is shown with such good contrast on the vertical deflection image and that the height change of the stress fibers is quite high implies that the AFM probe is compressing the cell, especially where the actin-myosin cytoskeleton is absent.
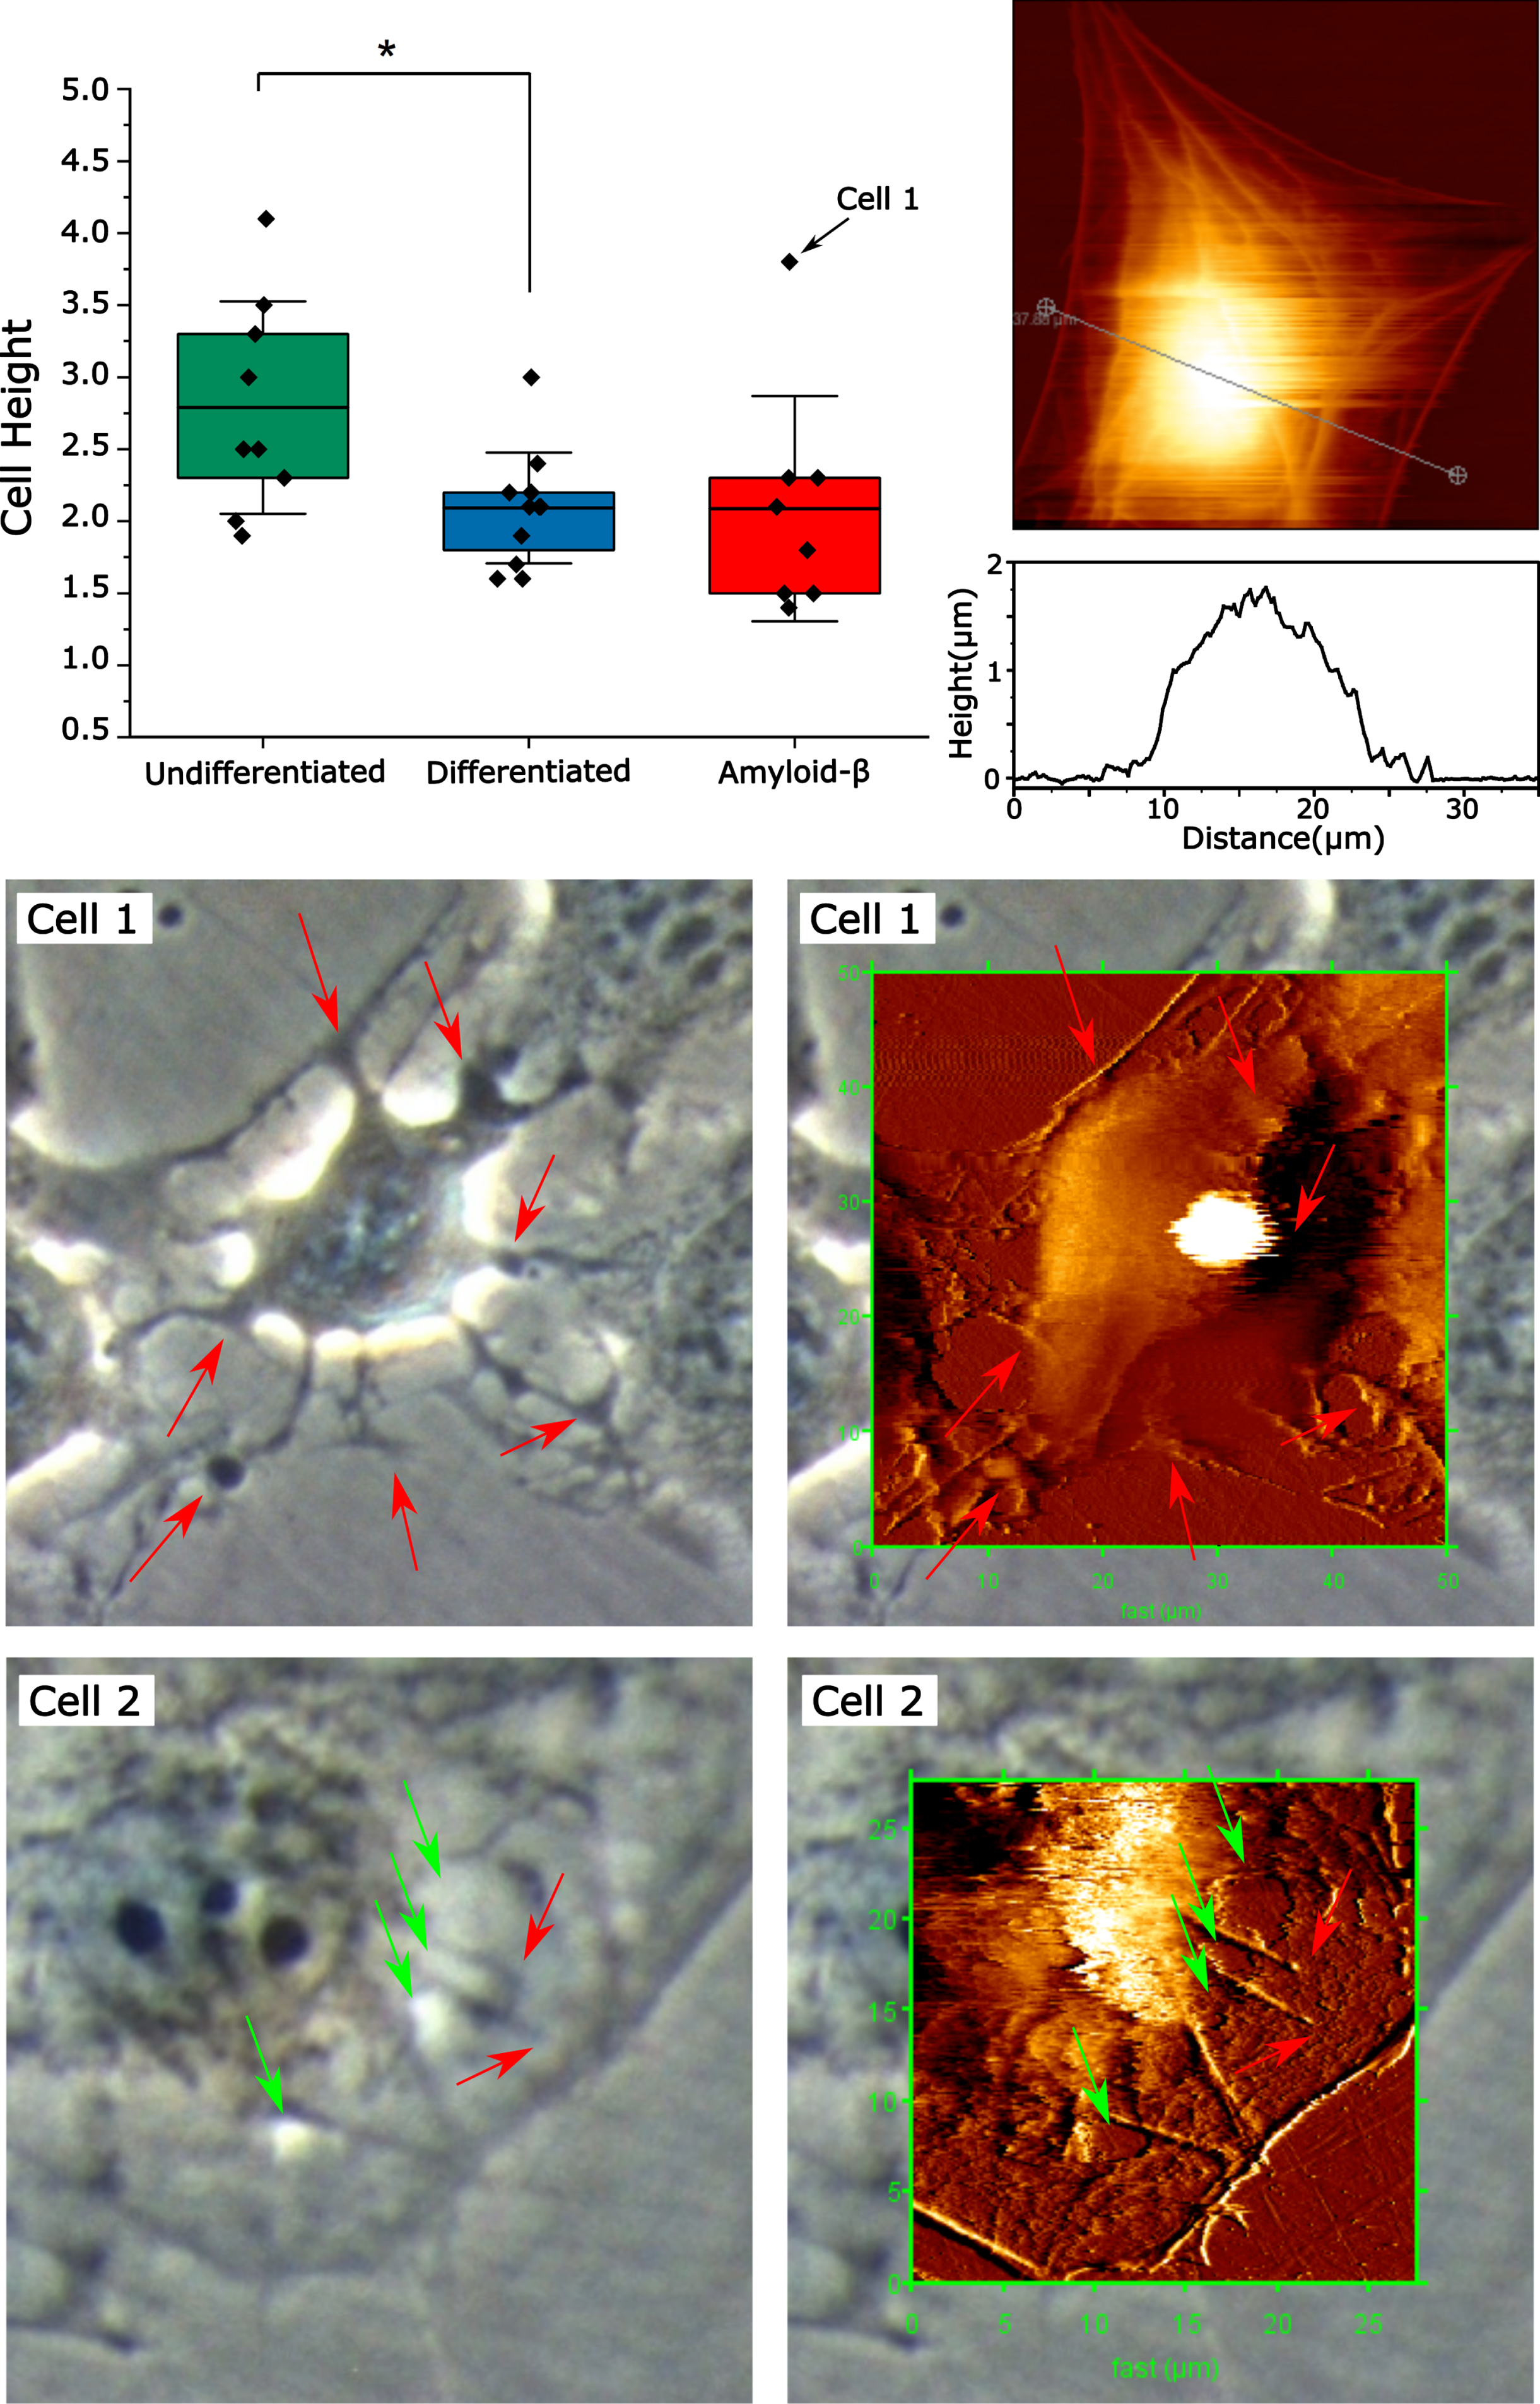
AFM of HT22 cells treated with Aβ42 exhibiting cell membrane, cytoskeletal damage, and disrupted cell adhesion. Top Panel shows control differentiated cell as well as cross section of the cell body, along with the distribution of cell heights for cells under different conditions. Cells 1 and 2 were exposed to Aβ42 for 24 h exhibiting disruption of cell adhesion, cytoskeletal and membrane damage.
In this study, cells were treated with 5μM Aβ42 for 24 h prior to imaging so that the effects of Aβ after longer timescales could be measured and correlated with phase contrast optical microscopy and gain further insights into the effects of amyloid and cholesterol depletion on neuronal health, structure, and function. AFM images of HT22 cells treated with Aβ42 cause several effects on cell morphology. Some HT22 cells treated with 5μM have similar morphology as untreated differentiated cells, these most likely did not have sufficient amyloid accumulation on them to have any detectable effect on cell morphology (Supplementary Figure 15, cell 1). There was a population of HT22 cells, which exhibited contraction along the actin-myosin cytoskeleton during imaging, (Supplementary Figure 15, cell 4), similar to what has been described in an aforementioned report [66]. This contraction along the actin-myosin cytoskeleton was triggered by vertical forces exerted on the cell during AFM imaging, likely as a result of sensitization by Aβ toxicity.

Phase contrast optical microscopy of HT22 cells cholesterol depleted and treated with Aβ. A) control, B) 5μM Aβ, C) cholesterol-depleted control cells, D) cholesterol depleted + 5μM Aβ42. Red arrows point to long cell protrusions. E. Cell circularity of cells treated with 5μM Aβ42 is significantly decreased (p < 0.05), while low cholesterol cells were unaffected (n = 6), *indicates p < 0.05.
A second population of cells was observed wherein cells appear dilapidated with projections from the cell body, these did not have the flat morphology of typical cells and exhibited impaired cell adhesion (Fig. 8, cell 1). This cell has a shriveled/dehydrated morphology, with rough edges and a very bright and large light halo artifact indicating greater cell height. Height image reveals this cell is an outlier in the Aβ42-treated group with a height of 3.8μm compared to the mean of 2.1±0.6μm (indicated by an arrow on Fig. 8). The cells exhibiting these morphological features were far more loosely bound to the cell culture dish, to the point that most could not be imaged. During AFM imaging, under forces from the probe tip (vertical and lateral), it was observed that these cells would become detached from the dish and unable to be imaged. This one cell that was able to be imaged moved substantially under the motion of the cell during AFM scanning by approximate 4.6μm in the fast scan direction. These features indicate that the cells exhibiting this Aβ42-induced morphology were not as well-adhered to the plate, suggesting that Aβ42 toxicity involves interference with cellular adhesion. Cells of this type appear reminiscent of apoptotic cells, with a contracted cell body, and membrane blebbing and spherical cell bodies outside the periphery of the cells (indicated by arrows on Cell 1 in Fig. 8). These partially adherent cells are significantly damaged, but may not yet be completely dead, as they are sufficiently intact to resist the compressive forces of the AFM probe during scanning implying that they have a positive internal pressure, meaning that the lipid bilayer is sufficiently intact to maintain osmotic pressure. A dead cell will rupture completely during imaging and rapidly leaks its internal components once the membrane is damaged, this occurs rapidly within a matter of seconds.
A third population of cells exposed to Aβ42 exhibited cytoskeletal and membrane damage on the phase contrast microscopy and AFM images shown in Fig. 8 (Cell 2). This cell has a peak height of 2.3±0.1 nm, within the range of untreated differentiated cells. The peripheral region of the cell has a relatively flat cross section. The outer peripheral region of the cell has a height of 55±3 nm above the mica, with the outer cytoskeleton ridge being 118±5 nm high. Regions of constructive interference (increased light intensity), on the phase contrast image (left panel, red arrows) correspond to holes in the cell surface topology on the AFM image (right panel, red arrows). These holes are 49±5 nm deep. The cytoskeleton of the peripheral cell region, outside the nuclear envelope, appears on the phase contrast image as lines of destructive interference, darker, lower signal than background, indicating the cytoskeleton is a light absorbing object compared to the cytoplasm. The cytoskeleton is between 110 and 170 nm high above the non-cytoskeletal regions. If the cell surface is expected to be mostly planar, then these large changes in height (from 40 to 50 nm) over the actin-myosin cytoskeleton (100 to 200 nm), imply compression of regions between these stress fibers due to forces exerted during scanning. The vertical compression length between the actin-myosin stress fibers and the rest of the cell appears to be approximately 55 to 70%.
Next, we used phase contrast optical microscopy to compare populations of HT22 cells with normal and low cholesterol treated with Aβ42. The effects of 5μM Aβ42 on HT22 cell morphology compared to control cells (Fig. 9, A versus B) are reflected in the simple image processing and analysis that was performed. Supplementary Figures 10 and 11 show the 2D image quantification scheme. Long protrusions from the cell body and increased roughness of the cell edges are observed in cells indicated by red arrows on Fig. 9. The number of cells exhibiting these long protrusions is dramatically increased for cells treated with 5μM Aβ42 (Fig. 9). These protrusions make the cell less circular and more elongated, or star shaped, which is reflected in the image quantification where an increase in cell area and perimeter (Supplementary Figure 12), and a decrease in cell circularity was observed (Fig. 9E). These dilapidated cells are exemplified by the high-resolution AFM image shown in Fig. 8 (Cell 1). At low concentration (1μM) Aβ42 there were no obvious effects on HT22 cell morphology visually and no significant changes in cell perimeter and area (Supplementary Figures 11 and 12). Similarly, cholesterol depleted cells exhibited a slight increase in cell perimeter and area and decrease in circularity (Fig. 9E and Supplementary Figure 12). In cholesterol depleted cells there was no significant difference between Aβ42-treated cells and non-Aβ42 treated cells, indicating that there was a decrease in the number of cells exhibiting Aβ42 induced changes in cell morphology (Fig. 9E). Thus, the protective effects of cholesterol depletion involve maintenance of HT22 cell morphology, in particular circularity.
DISCUSSION
Effect of Aβ42 on cholesterol metabolism
MβCD is commonly used to sequester cholesterol from lipid bilayers in molecular and cellular studies. Previous studies have shown that 60 to 90% of total cellular cholesterol is found within the plasma membrane of cells in culture [67, 68]. Sterol regulatory element binding proteins (SREBPs) tightly regulate total cellular cholesterol by associating with endoplasmic reticulum cholesterol, which represents less than 5% of total cellular cholesterol [55, 68], while other organelles such as mitochondria contain approximately 2 to 4% of cellular cholesterol [69], though these exact ratios are cell type dependent. The final pool of cholesterol may be found as esterified cholesterol found within lipid droplets within cells; however, our cholesterol oxidase assay was performed without esterase, therefore our assay will not detect esterified lipid droplet cholesterol. Thus, we expect that MβCD treatment is predominantly removing cellular membrane cholesterol, though some fraction of ER cholesterol could also be reduced during treatment. Therefore, MβCD is often used to model the effects of membrane lipid raft disruption and the cholesterol dependence of membrane receptor signaling. For example, MβCD treatment has been shown to lower the levels and modify the trafficking of NMDA receptors in neurons, preventing ischemic injury [56]. This is important as NMDA receptors appear to act as a binding site for Aβ at neuronal membranes, and because cholesterol reduction is implicated in Aβ42 toxicity as mentioned in the introduction, as well, NMDA receptors may act as binding sites for initiating Aβ42 aggregation on lipid membranes [6]. Moreover, glutamate excitotoxicity has been implicated in AD, and one common treatment for AD is memantine which is an NMDA receptor antagonist [70, 71].
The level of cholesterol reduction achieved by MβCD immediately following treatment is similar to what has been reported in other studies [55, 56], though over the course of the 24 h treatment time cholesterol levels returned to normal. Statins are a class of pharmaceutical that inhibit HMG-CoA reductase activity, the rate limiting enzyme in cholesterol biosynthesis. Reduction of HMG-CoA to mevalonic acid also impairs the production of isoprenoids which are a diverse and complex class of molecules that are involved in a large set of physiological processes and are implicated in a wide variety of disorders, including AD [72–74]. Therefore, the use of statins to maintain lower levels of cholesterol throughout the duration of these 24 h experiments could create confounding effects that would make it difficult to ascertain the role of membrane cholesterol specifically. Moreover, statins of different kinds have not been shown to reduce risk of AD [75]. The active cholesterol biosynthesis in HT22 cells is necessary for cell proliferation of immortalized cell lines but is not a feature of mature neurons, which rely on cholesterol produced and trafficked by ApoE from glial cells. Aβ, AβPP, and the secretases that process AβPP have been shown to affect cholesterol and sphingomyelin metabolism as demonstrated in a presenilin knockout embryonic mouse model, wherein Aβ40 was shown to reduce HMG-CoA reductase activity while Aβ42 did not affect cholesterol biosynthesis [76]. The authors of that paper suggested a role for AβPP and its processing into Aβ to act in a regulatory feedback loop on lipid metabolism, further linking lipids and lipid metabolism to the Aβ cascade in AD. However, that report used embryonic mouse cells, whereas HT22 cells used in these experiments is an immortalized cell line with robust cholesterol biosynthesis that may not be present in the embryonic mouse model.
Effects of cholesterol and Aβ42 on cell viability
The protocols to produce different aggregation states of Aβ in this work were adapted from Stine et al. (2011) [60]. In that paper, Aβ toxicity was screened in N2A cells with preformed oligomers exhibiting a reduction in cell viability to 50% of control at a concentration of 0.1μM, whereas unaggregated Aβ only reduced cell viability to around 90% at 0.1μM over 24 h treatment [60]. The lower toxicity of monomer Aβ, compared to oligomer Aβ, has also been reported in other studies, however the difference in toxicity between the two species depends on the cell type [77–79]. The 12–15% reduction in toxicity caused by cholesterol-depletion is on the low end compared to previous Aβ neuroprotective studies in HT22 cells. Other toxicity studies that utilized HT22 cells found reductions in cell viability of 5.0μM Aβ4 to around 50–60% of control [61, 80], which is in line with our study here. In Wu et al., they show that treatment with 100 and 500μM nicotine caused recovery from 5.0μM Aβ42 toxicity by 15% to 20%, in a dose-dependent response [80]. Previously, our group showed that SG pseudopeptide inhibitors prevented toxicity from 5.0μM Aβ42 oligomers by 15% to 18% at 1:1 and 1:2 ratio of inhibitor to Aβ42 [61].
Previous reports have identified important aspects of the impact that cholesterol has on the health and cellular pathology of Aβ-induced neuronal dysfunction [11, 81–83]. Abramov et al. (2011) showed that amyloid toxicity was enhanced in astrocyte/neuronal co-cultures that were enriched in cholesterol [28]. They observed that cholesterol content was higher in astrocytes than neurons, and that astrocytes were more susceptible to increased calcium flux than neurons. They also showed that the presence of cholesterol increased amyloid-induced calcium permeability in unilamellar liposomes, thus demonstrating on the molecular and cellular level that cholesterol was facilitating amyloid-induced membrane calcium permeability. This study also evaluated the proportion of dead cells finding that despite astrocytes having greater calcium permeability and membrane cholesterol, and that cell death of each cell type increased after cholesterol enrichment, though neurons had higher cell death. However, it has been shown that cholesterol can have different effects on amyloid toxicity, depending on the presence of astrocytes, the cell line, and on tau-cleavage pathways [11, 84]. However, little is known about which receptor signaling pathways are of primary importance in mediating the cholesterol-Aβ interaction.
Effects of cholesterol and Aβ42 on PDGFRα signaling in differentiated HT22 cells
Differentiation was achieved using protocols described and characterized previously. This differentiation protocol has been shown to increase NMDAR1 subunit expression and renders cells more susceptible to glutamate excitotoxicity [58, 85], and also has been shown to increase cholinergic signaling via acetylcholine release, expression of choline acetyltransferase, high-affinity choline transporter, and muscarinic acetylcholine receptor [59]. Differentiation also slows cell proliferation and increases neurite outgrowth, in addition differentiation reduced the overall height, effectively flattening the cell. Interestingly, this differentiation protocol does not appear to result in substantial levels of neurotrophic specific receptor tyrosine kinase activation in the HT22 cells, such as by TrkA and TrkB receptors for neurotrophic growth factor and brain-derived growth factor respectively. Full length TrkB receptors were not able to be identified by Western blot, however truncated TrkB was highly abundant.
RTKs are an important class of receptor that serve as growth factor receptors that assist in maintaining health and homeostasis of various brain cells. These have been implicated in some AD studies. Previous work by our group identified that Aβ42 interfered with PDGFRβ signaling in SH-SY5Y cells and thus PDGFRα could be an interesting target to study in relation to AD in HT22 cells [45]. PDGF-AA is a mitogen and increases cellular proliferation of mesenchymal stem cells, osteoblasts and oligodendrocyte precursor cells [86]. PDGFR activation can occur in both lipid rafts and non-lipid rafts, in lipid rafts activation is inhibited by integrin/RhoA-mediated cellular tension, but not in non-lipid rafts, suggesting that non-lipid raft PDGFR are more active, representing a mechanism for membrane lipid domains to regulate receptor activity [87]. In other studies, depleting the cell membrane of cholesterol has been shown to disrupt PDGFRβ signaling in a cell-type specific manner [57]. Cholesterol depletion may lead to increased cell membrane tension and enhances cytoskeleton-membrane protein interactions [88], thus reducing activation of the PDGF receptors. Aβ pathophysiology has been shown to be related to interactions with cholesterol laden membrane microdomains [12], and thus an interplay between cholesterol, membrane raft associated receptors and Aβ may be important.
To further elucidate effects of cholesterol depletion, Aβ42 treatment and their interplay on PDGFRα signaling, downstream effector activation in this RTK signaling pathway were explored and quantified. The MAPK pathway is an important pathway that regulates all kinds of cellular functions, acting as an important signal transduction cascade between extracellular growth factor and hormone signals coming in from the environment at the cell membrane into changes in gene expression for regulating cell and tissue homeostasis. After growth factor-induced dimerization and RTK activation, Ras, a membrane-associated secondary signal, dissociates from the kinase, binds to B-Raf, and activates MEK1/2, then ERK1/2 [89]. ERK1/2 then phosphorylates transcription factors that bind activator protein-1 transcriptional DNA elements which trigger increases in cellular activity, promoting growth, proliferation, and survival. Thus ERK1/2 phosphorylation can be used as a measure of downstream RTK activation, though this is complicated by redundant pathways from other membrane receptors that influence MAPK signaling and feedback from intracellular pathways.
Activation of Ras-ERK signaling has been implicated in the pathophysiology of AD with neuronal exposure to Aβ42 oligomers enhancing Ras/ERK signaling cascade [52, 90]. This may be a counter regulatory factor to increase the chances of cell survival in response to the toxic insult of Aβ but could contribute to toxicity if there is sustained overactivation, taxing cellular regulatory process involved in cell growth and proliferation that are impaired by the initial Aβ insult. In addition, neuroprotective properties of different compounds including agmatine, tanshinone IIA and several different neurosteroids and their metabolites, have been shown to involve reversal of ERK1/2 and GSK3β activation in neuronal cell lines, primary hippocampal cultures and in rodent models in vivo [90–93]. Another previous report showed that toxic levels of Aβ42 increased ERK1/2 activation, while decreased ERK1/2 activation has been shown to correlate with a reduction in Aβ toxicity [90]. The decrease in ERK1/2 signaling from cholesterol reduction in our study is correlated with reductions from PDGFRα; however, membrane cholesterol reduction will undoubtedly affect a whole host of signaling pathways both at the cell membrane and intracellularly through membrane-associated proteins that have effects on MAPK signaling. These neuroprotective mechanisms may include other membrane receptors, as well as Ras and Rho superfamilies which include membrane-dependent GTPases that transduce signals from neuronal membrane receptors to downstream intracellular secondary messengers ultimately affecting gene expression [94]. This aligns with what was observed here that low cholesterol HT22 cells treated with 5μM Aβ42 oligomers had normal levels of ERK1/2 activation, this may be involved in the protective effects of low cholesterol detected by MTT assays. This is consistent with several Aβ toxicity studies where there was no change in total ERK1/2 expression in response to toxic levels of Aβ, across a wide range of concentrations even as high 10μM [91, 93].
GSK3β is an intracellular kinase that has activity on many different substrates including microtubule associated protein tau, and it has been implicated in hyperphosphorylation of tau in AD [52, 95–97]. GSK3β inhibition has been shown to reduce tau hyperphosphorylation and plaque deposition and may be protective against cognitive dysfunction in mice and fly models of AD [53, 98]. GSK3β activation has been previously identified in AD patient brain samples and was detected following Aβ42 application to primary neuron cultures [97, 98]. GSK3β is known to phosphorylate tau protein, and hyperphosphorylated tau is associated with microtubule collapse in the later stages of neuronal death in AD. The serine-9/21 phosphorylation site is inhibitory, thus it could be expected to decrease in response to Aβ42, as suggested by other studies in AβPP knockdown and AD patient brain analysis [52]. The absence of an effect of Aβ42 on GSK3β in HT22 cells may represent a shortcoming of the HT22 cells which do not recapitulate this important neuronal function relevant in the effects of Aβ42 on the GSK3β pathway.
The decrease in activation of PLCγ1 in response to cholesterol depletion was expected. PLCγ1 has membrane lipid raft dependent activity in T-lymphocytes which is likely generalizable to other cell types and signaling pathways due to the non-specific actions of membrane lipid raft disruption [51]. PLCγ2 is a major phospholipase expressed in immune cells (including microglial) that has been shown to have gene variants that modify AD-like pathology in rodent models [99]. PLCγ1 is expressed in neuronal cells and has been connected to the anti-apoptotic effects of ApoE lipoproteins [100]. Though to our knowledge its specific role in AD has not been explored in great detail, our report does not detect a significant role for PLCγ1 in relation to Aβ42 toxicity.
Effects of cholesterol and Aβ42 on cell morphology
Living cells will respond to mechanical stimuli depending on the magnitude, direction, and duration of the force and on the type and state of the cell. The cellular response includes acute changes initially activation of the actin-myosin cytoskeleton to resist mechanical compression, then changes in cell adhesion and other proteins involved in cell migration to move away from mechanical stimuli or shift cellular organelles to reinforce regions of the cell under pressure, and activation of volume/pressure regulating ion channels. Chronic changes in gene expression of these same systems can occur under sustained forces such as pressure and volume regulating ion channel expression (to increase osmotic pressure and resist compression) and increased expression of cytoskeletal proteins and mechanical sensing proteins. Cell mechanics involve several important subsystems including membrane integrity, osmotic pressure regulation (ion channels), and cytoskeleton regulation. Under AFM imaging mechanic stimuli occurs for 12 to 15 min, long enough for some of these acute changes to occur.
Previous AFM studies of the effects of Aβ42 on living cells involved acute treatments of less than 3 h with a focus on the effects of Aβ42 on compressive cellular mechanics [66, 101]. They found morphological changes induced by amyloid, in particular, retraction of the cell along the actin-myosin cytoskeleton. This may be due to amyloid directly, or a combination of amyloid and mechanical stimulation by the probe tip, though control images ascertain that amyloid is required. A force spectroscopy study with AFM showed that 5μM Aβ42 greatly increased the stiffness of both N2A and HT22 cells after only 30 min of treatment, this effect was attributed to increases in osmotic pressure and incorporation of Aβ peptides into the cell membrane causing membrane stiffness to increase [101]. A similar AFM and force spectroscopy study in aging primary culture models yielded the opposite effect, with Aβ decreasing cell membrane stiffness in aged cells, with depleted cholesterol, over similarly short time scales [101, 102]. The difference in these two studies could be related to the choice of cell line versus primary cell culture, the choice of probe, and/or force spectroscopy force regime used. The effects of fresh and globular Aβ oligomers on cultured endothelial cells has also been explored by AFM where morphology changes within as early as 30 min following treatment, where cells appear to contract their cytoskeleton under AFM imaging effects which the authors attribute to Aβ ion channels [66]. The effects of Aβ in chronic cell culture models, rather than acute models, has not been explored by AFM imaging in live cell culture.
Traditional phase contrast optical microscopy does not allow for true quantitative 3D imaging of cells, because the value of each pixel in a sample does not correspond linearly to the path length the light traversed through the sample. However, quantification in the 2D sample plane, or the cell footprint, in the sample population is possible within the limitations imposed by physical sample, microscope resolution, the pixel density of the camera, and the specific parameters of the image processing and analysis algorithm [103]. These approaches have been shown to work adequately for subconfluent cultures where overlapping cells do not interfere with the boundary region between cells that can obscure contrast. If cells are overconfluent under or over counting of cells and obscuring of their morphology in the plane of the dish can occur. Regardless, striking effects of 5μM Aβ42 on HT22 cell morphology was observed, in particular changes in the cell perimeter and circularity through the appearance of cell projections. Cholesterol depleted cells treated with Aβ were less susceptible to morphological changes that were associated with cell damage of varying degree (as revealed by AFM). Control cells and cholesterol depleted cells exhibited no difference in morphology, treatment with 1μM Aβ in both normal and low cholesterol HT22 cells caused no changes to the morphological features. The decrease in a damaged cell morphology in the low cholesterol HT22 cells treated with 5μM Aβ correlated with the small rescue in toxicity assays, thus we attribute the reduction in these morphological changes caused by high concentration Aβ to be related to the protective effects of cholesterol depletion.
CONCLUSION
The effects of cholesterol and Aβ42 interactions in HT 22 cells were explored in this report. We found that Aβ42 did not affect cholesterol metabolism following MβCD sequestration from HT22 cells. Both unaggregated Aβ monomers and preformed oligomers exhibited similar toxicity, with cholesterol depletion being modestly protective against both Aβ42 species, as measured by MTT assay. Aβ42 was shown to interfere with PDGFRα signaling induced by PDGF-AA. MTT cell viability assays demonstrate that PDGF-AA was not protective against Aβ42. Cholesterol sequestration by MβCD reduced PDGFRα signaling. Furthermore, cholesterol-depleted HT22 cells had reduced PDGFRα activation, which correlated with significant decreases in downstream ERK1/2, GSK3β, and PLCγ1 phosphorylation in PDGF-AA stimulated cells. The combination of toxic levels of Aβ42 and reduction in neuronal cholesterol had a compounding effect reducing PDGFRα signaling further. Morphological analyses at the single-cell level by AFM reveal that Aβ42 oligomers cause damage to the cell in the form of large holes in the membrane, alongside cytoskeletal disruption, and impaired cell adhesion. Phase contrast optical microscopy revealed that toxic levels of Aβ42 induce greater levels of these morphological changes which were less pronounced in low cholesterol cells, suggesting that the mild protective mechanisms of cholesterol depletion involve maintenance of cell cytoskeleton and membrane integrity. Combined, this suggests that Aβ42 has a disruptive effect on PDGFRα signaling, especially in combination with cholesterol, and thus PDGFRα signaling is not involved in the protective effects of cholesterol on cell viability and morphology. This implies that other non-RTK receptors, such as NMDA receptors, or changes in the biophysical properties of the membrane are more relevant factors in amyloid toxicity towards HT 22 cells and more studies on the role of lipids in neuroprotective strategies in AD are warranted.
Footnotes
ACKNOWLEDGMENTS
The authors acknowledge Dr. John Mielke for discussions regarding statistical analysis and Dr. Dale Martin for the use of lab space to support atomic force microscopy experiments.
FUNDING
The authors acknowledge funding from Natural Sciences and Engineering Research Council (NSERC) of Canada (to ZL and MB); Canadian Fund for Innovation and Ontario Research Fund (CFI/ORF) funding (to ZL); University of Waterloo Network on Aging Research (NAR) Catalyst grant (to MB, ZL and Ken Stark); and Ontario Graduate Scholarship (OGS) and Waterloo Institute for Nanotechnology (WIN) Nanofellowship awards (to MR).
CONFLICT OF INTEREST
The authors have no conflict of interest to report.
DATA AVAILABILITY
The data supporting the findings of this study are available within the article and or its supplementary material.