
Abstract
Background:
Age is known to be the biggest risk factor for Alzheimer’s disease (AD), and Mexican Americans (MAs), who are one of the fastest-aging populations in the United States, are at a uniquely elevated risk. Mitochondrial stress and dysfunction are key players in the progression of AD and are also known to be impacted by lifestyle and environmental exposures/stressors.
Objective:
This study aimed to identify population-specific differences in indicators of mitochondrial stress and dysfunction associated with AD risk that are detectable in the blood.
Methods:
Examining blood from both non-Hispanic white (NHW) and MA participants (N = 527, MA n = 284, NHW n = 243), mitochondrial DNA (mtDNA) and nuclear DNA (nDNA) copy numbers were assessed through quantitative PCR. Data was stratified by population and sample type, and multiple linear regression analyses were performed to identify factors that may influence this phenotype of mitochondrial dysfunction.
Results:
In the MA cohort, there was a significant relationship between cellular mtDNA:nDNA ratio and body mass index, CDR sum of boxes score, the APOE ɛ2/ɛ3 genotype, and education. Further, there was a significant relationship between cell-free mtDNA copy number and both education and CDR sum score. In the NHW cohort, there was a significant relationship between cellular mtDNA:nDNA ratio and both age and CDR sum score. Age was associated with cell-free mtDNA in the NHW cohort.
Conclusions:
This evidence supports the existence of population-based differences in the factors that are predictive of this blood-based phenotype of mitochondrial dysfunction, which may be indicative of cognitive decline and AD risk.
INTRODUCTION
Alzheimer’s disease (AD) is known to be the most prevalent form of dementia with current estimates reaching as high as 32.3 million individuals suffering from AD dementia worldwide [1]. In the United States (US), it is estimated that roughly 6.5 million individuals are living with AD and an additional 13 million are estimated to have mild cognitive impairment (MCI) [2]. In 2019, over 121,000 Americans were reported to have died from AD, making it the 6th most common cause of death in the US [3]. This statistic is predicted to rise in the coming years as the US population continues to age [4]. Current predictions for the number of individuals with AD by the year 2060 show the number of individuals with AD nearly doubling [2].
In addition to the predicted increase in AD for the general population, there are AD-related ethnic and racial health disparities within the US that increase AD risk in particular populations. One of the most prevalent AD-related health disparities is seen in the Mexican American (MA) population, which is the fastest-growing and fastest-aging population within the US [5]. Therefore, the number of MA individuals diagnosed with AD is expected to increase at an even higher rate in the coming years. Additionally, MAs experience an onset of AD symptoms that is up to 10 years earlier than their non-Hispanic white (NHW) counterparts, and they are more likely to be diagnosed at a later stage of disease progression [6, 7].
The cause behind this increased risk for AD in the MA population is unknown but it may be in part due to differences in inherited genetic risk for AD, as well as differences in social determinants of health which may increase exposure to environmental/lifestyle risk factors. The most prominent genetic variant known to lead to an increased risk for AD is the APOE ɛ4 allele [5, 9]. This has been well established and determined in NHWs, but the same high level of association between this APOE variant and AD has not been clearly established in MAs [5]. Lifestyle risk factors associated with AD differ in the MA population when compared to NHWs. For example, the presence of comorbidities such as type 2 diabetes, cardiovascular disease, and obesity are at increased levels in the MA population [6, 10]. MAs are also known to typically have fewer years of formal education, a factor that has been shown to be protective against AD development [11]. Altogether this highlights the need for further studies looking into the AD health disparity in the MA population.
While mitochondria are best known for their important role in cellular energy production, they also play a vital role in metabolic pathways, reactive oxygen species (ROS) signaling, and other various important cellular functions [12]. There is an abundance of evidence that mitochondrial function declines with age regardless of other health conditions and is one of the main contributors to the biological aging process [13–15]. However, increased levels of mitochondrial dysfunction have also been shown to be present in the brain during MCI and AD [16]. Additionally, mitochondrial dysfunction is theorized to be an early initiator of AD progression [17]. This is thought to occur by many mechanisms including the accumulation of mtDNA mutations, reduced clearance of any damaged mitochondria, and decreased levels of mitochondrial oxidative homeostasis leading to oxidative stress [14, 15].
While ROS are produced under normal physiological conditions, such as in the function of the electron transport chain, mitochondria are also known to play a central role in the cause of oxidative stress when imbalances in ROS formation and antioxidant mechanisms occur. Mitochondrial dysfunction and oxidative stress are also known to increase due to exposure to lifestyle/environmental risk factors (poor diet, smoking, sedentary lifestyle, alcohol abuse, etc.) [16, 18]. Studies have shown that increased exposure to environmental pollutants, such as air pollution and pesticides, can lead to an increase in the generation of ROS which is known to heavily contribute to mitochondrial dysfunction through oxidative modifications to biomolecules located within the mitochondria including proteins, lipids, and nucleic acids [19, 20]. Unhealthy lifestyle habits such as smoking, alcohol abuse, and unbalanced exercise have also been linked to elevated levels of ROS [19]. These enhanced levels of ROS from lifestyle factors and environmental exposures leading to increased mitochondrial dysfunction combined with the normal decline of mitochondrial function in aging may contribute to the abnormal or aberrant aging process [17]. Many of these same lifestyle and environmental stressors have also been linked to one’s risk for developing AD [3]. Various lifestyle factors and environmental exposures linked to AD have also been shown to be more prevalent in ethnically/racially diverse communities, such as in the MA population [9, 21]. However, the connection and interplay between AD related health disparities, mitochondrial dysfunction, and environmental and lifestyle stressors has not been well studied. This project set out to further elucidate these relationships and investigate how AD risk factors may differentially contribute to the development and progression of mitochondrial oxidative stress and AD-related cognitive decline in the MA population.
Mitochondrial oxidative stress, caused by an overproduction ROS, can cause oxidative modifications to both proteins and lipids as well as DNA damage [16, 22]. In addition, malfunctioning mitochondria are known to release mitochondrial DNA (mtDNA) as well as other stress signals [23]. This release of mtDNA functions as a damage-associated molecular pattern (DAMP) and is thought to trigger the innate immune system (e.g., neutrophil recruitment and activation), as well as increase the release of pro-inflammatory cytokines [23]. Copy number of mtDNA within the cell can also serve as an indicator of overall mitochondrial health, biogenesis, and/or mitophagy [24].
Previously, our laboratory has looked into the relationship between cognitive impairment to both mtDNA copy number and cell-free mtDNA in a smaller cohort (N = 46) comprised solely of MA females [25]. The previous study concluded that decreased intracellular mtDNA copy number was significantly associated with cognitive impairment [25]. This current study aims to expand on the previous study by utilizing a larger cohort comprised of MA and NHW participants. The objective of this study was to quantify mtDNA from two blood fractions (buffy coat peripheral blood mononuclear cells and plasma) collected from both MA and NHW participants in the Texas Alzheimer’s Research & Care Consortium (TARCC) as an indirect indicator of 1) mitochondrial biogenesis/function (i.e., mtDNA copy number in buffy coat peripheral blood mononuclear cells (PBMCs)) and 2) mitochondrial-sourced systemic proinflammation (i.e., mtDNA found extracellularly in plasma) that may correlate with AD progression. These data may help to further elucidate the role that mtDNA may be playing in population-specific AD pathogenesis.
MATERIALS AND METHODS
Participant identification and sample collection
This study was approved by the University of North Texas Health Science Center IRB #1330309-1; informed written consent was obtained from the study participants or their legal representatives prior to data collection. All study participants were from the TARCC cohort (N = 527, MA n = 284, NHW n = 243). More information on the TARCC cohort can be found in Waring et al. [26]. Ethnicity and race were self-reported. Participants were assessed for cognitive impairment at the time of the visit through a battery of cognitive assessments (including Clinical Dementia Rating (CDR) sum of boxes and Mini-Mental State Examination (MMSE)), a thorough medical history, as well as familial/caregiver interviews to diagnose individuals as cognitively normal (NC), MCI, or probable AD. Individuals also received a medical evaluation that included a blood draw. Participant blood samples were separated into buffy coat PBMCs, red blood cells, and plasma components.
DNA extraction
DNA was extracted from 200μL of participant plasma and buffy coat using the Mag-Bind® Blood & Tissue DNA HDQ 96 kit (Omega Bio-Tek Inc., Norcross, GA, SKU: M6399-01) according to the manufacturer’s specifications. DNA was quantified using the Qubit dsDNA BR Assay kit (Invitrogen, Waltham, MA, Q32853) and normalized to a concentration of 5 ng/μL with TE buffer and used for qPCR.
Quantitative PCR
mtDNA and nuclear (nDNA) copy number was assessed through quantitative PCR (qPCR). Each sample was assayed in a duplex via the mitochondrial minor arc (MinArc), and the nuclear-encoded beta-2-microglobulin gene (B2M) according to the methodology published in Phillips et al. (2014) [27]. qPCR was performed in duplicate using the 7500 Real-Time PCR System (Applied Biosystems, Waltham, MA) in a 96-well plate. Quantification was performed using a standard curve method to calculate the mtDNA and nDNA copy numbers.
Data analysis
Data analysis was performed using Microsoft Excel, IBM SPSS (v.28.0), and GraphPad Prism (v.9.4.0). De-identified samples were matched to their unique TARCC sample ID and then matched to participant visit data. One-way ANOVA and chi-square tests were run to determine if there was a significant difference in the means of participant demographic data or the presence of co-morbidities between cognitive phenotype groups.
The ratio of mtDNA:nDNA was Log10 transformed to account for non-normality of our data set. One-way ANOVA followed by Dunnett’s test for multiple comparisons was performed to determine significant differences between mtDNA:nDNA ratio or mtDNA copy number across cognitive phenotype groups. Multiple linear regression analysis was performed to identify which demographic variables (age, gender, education, body mass index (BMI), APOE genotype, and/or cognition) were associated with mitochondrial copy number or mtDNA:nDNA ratio as the dependent variable(s). Multiple linear regressions were conducted with CDR sum of boxes as the selected cognitive variable over cognitive phenotype (NC, MCI, AD) as CDR sum was shown to be the more powerful variable because of its continuity. Significance was determined in all tests using a two-sided p-value of less than 0.05.
RESULTS
Demographic summary statistics
Descriptive statistics of the cohort demographics are shown in Tables 1 and 2. In the MA population, there was a significant difference in age, BMI, years of education, CDR sum of boxes score, and MMSE score between cognitive groups (AD, MCI, or NC). In the NHW population there was a difference in years of education, CDR sum score, and MMSE score between cognitive groups. In the MA plasma group, there was a significant difference in the presence of comorbidities including obesity, hyperlipidemia, and diabetes between cognitive groups. The MA buffy coat group had a significant difference in the presence of obesity, while the NHW buffy coat and plasma groups had a significant difference in the presence of hyperlipidemia. Neither population showed a significant difference in the presence of hypertension between cognitive groups.
Mexican American Demographic Summary Statistics
A significant difference in the means of participant demographic data between cognitive groupings is measured as a p-value < 0.05 and is denoted by an asterisk (*).
Non-Hispanic White Demographic Summary Statistics
A significant difference in the means of participant demographic data between cognitive groupings is measured as a p-value < 0.05 and is denoted by an asterisk (*).
Decreased intracellular mtDNA is associated with cognitive status in MAs
When analyzing the relationship between mtDNA in participant buffy coat and cognitive status, the data suggests that intracellular mtDNA compared to nDNA is decreased with marginal statistical significance in those with AD when compared to those that are cognitively normal in the MA cohort (Fig. 1A). While not statistically significant (p = 0.0506), the data shows a trend in decreasing intracellular mtDNA as cognition declines. However, when assessing cognitive function as a more continuous measure, measured by the individual’s CDR sum of boxes score, instead of the categorical AD, MCI, NC phenotypic groupings, there was a significant correlation between levels of mtDNA measured in participant buffy coat and CDR sum score (p = 0.0119) (Fig. 1B).
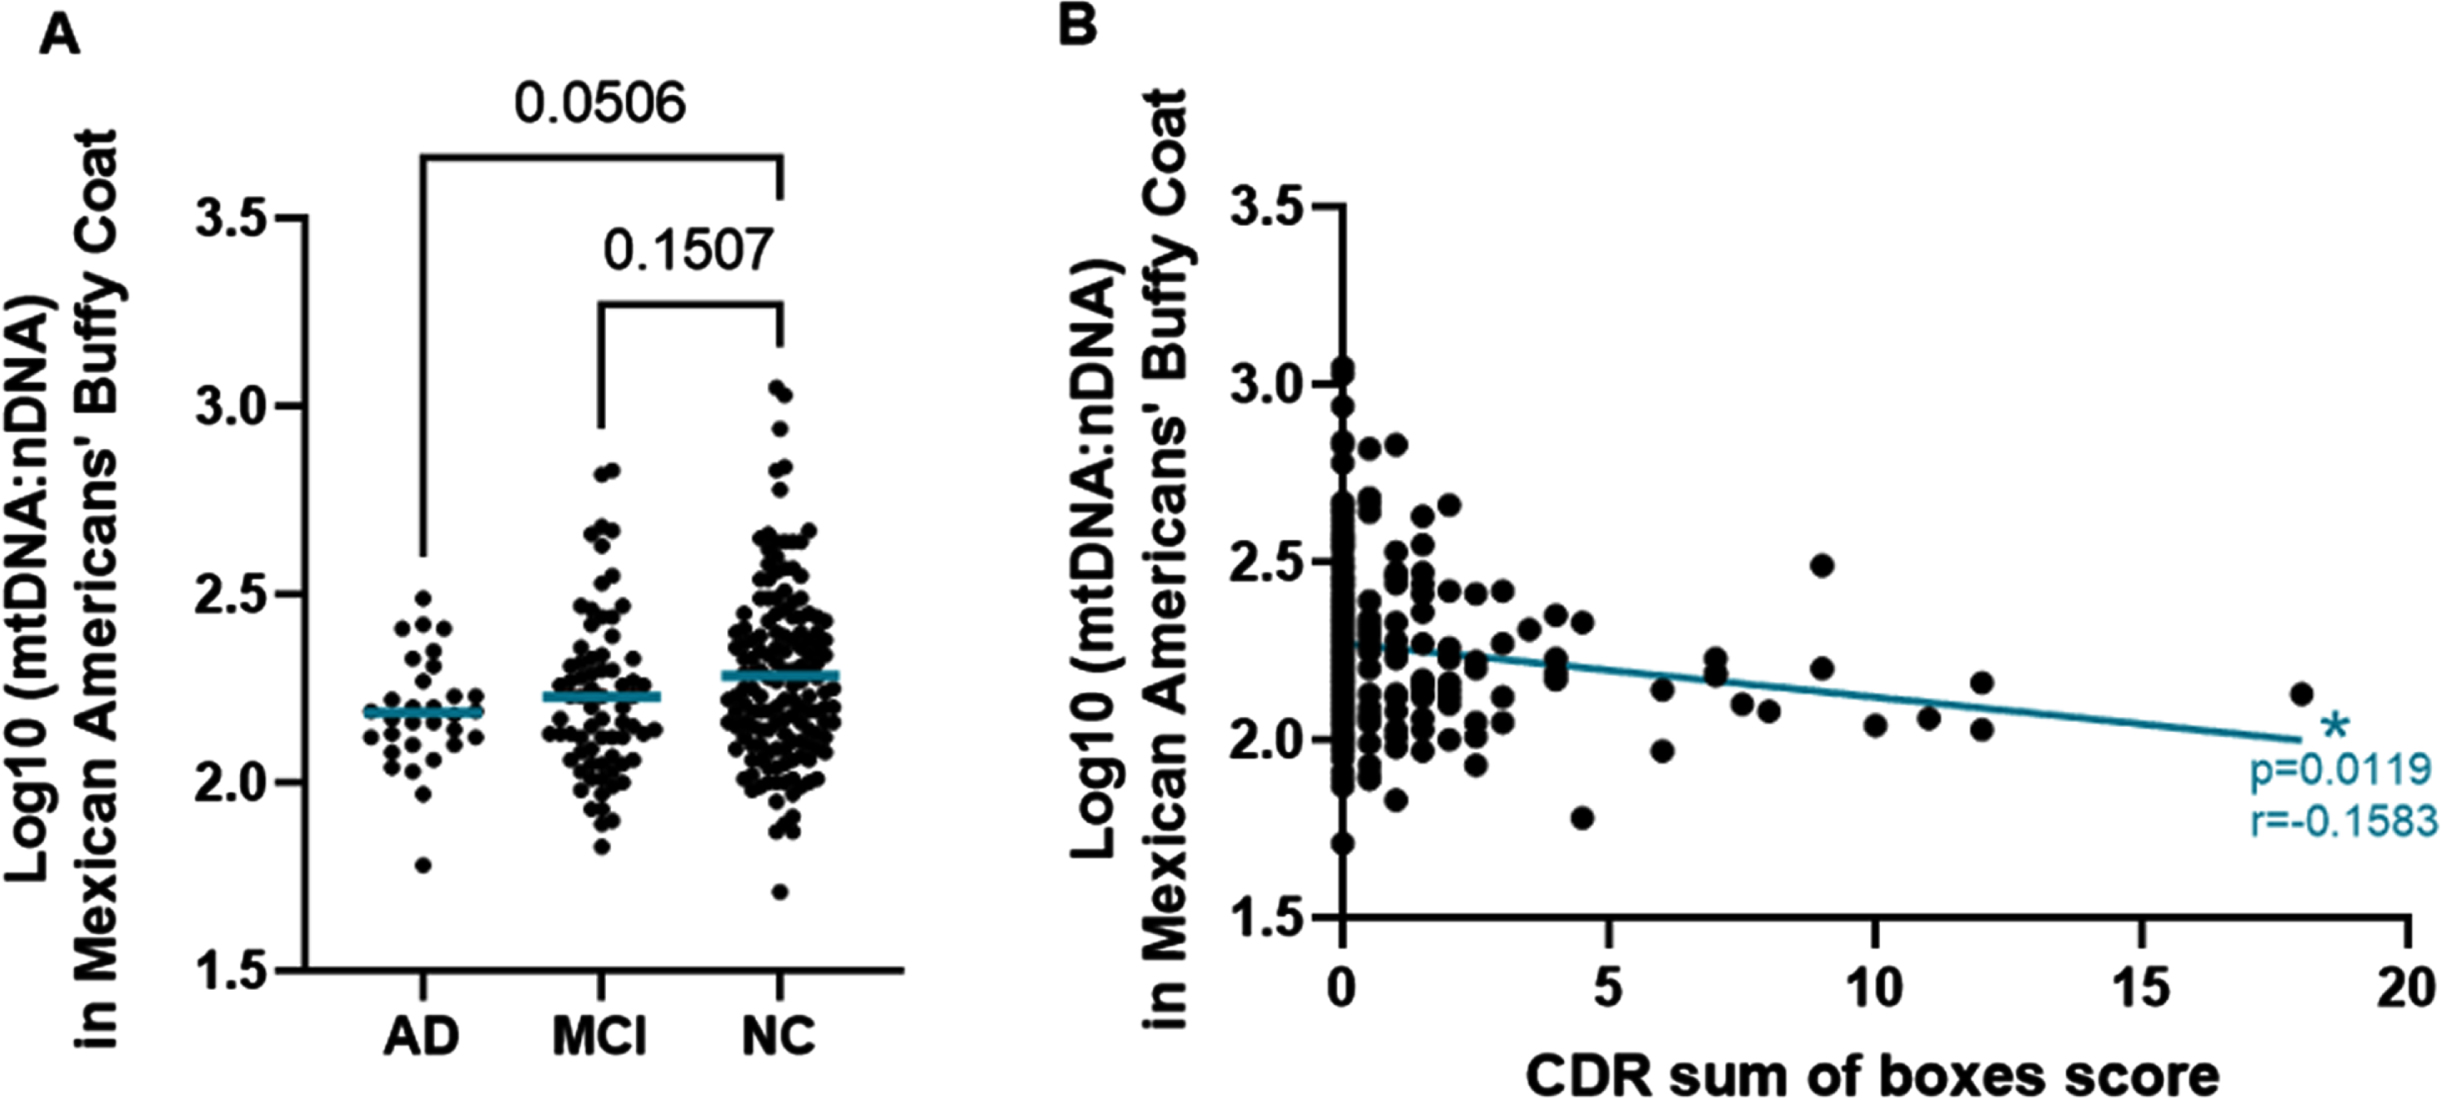
Decreased Buffy Coat mtDNA Copy Number in Mexican Americans with AD. A) Log10(mtDNA:nDNA ratio) measured in buffy coat of MAs by cognitive phenotype. Comparisons were performed using the Dunnett’s test for multiple comparisons. The mean mtDNA to nDNA ratio of each group is noted by the blue horizontal bar. B) Scatterplot of Log10(mtDNA:nDNA ratio) measured in buffy coat of MAs by CDRsum of boxes score. The relationship was measured using Pearson’s r correlation. r = –0.1583 and p = 0.0119.
Increased intracellular mtDNA associated with MCI in NHW
Interestingly, we did not observe the same trend in the NHW population that we had observed in the MA population. In the NHW population we observed a significant increase in the intracellular mtDNA in those with MCI when compared to NC (p = 0.0014) (Fig. 2A). An equivalent increase in mtDNA in those participants diagnosed with AD was not observed the NHW cohort. When we looked at the continuous assessment of cognitive function there was no significant correlation between CDR sum score and intracellular mtDNA:nDNA ratio (Fig. 2B).
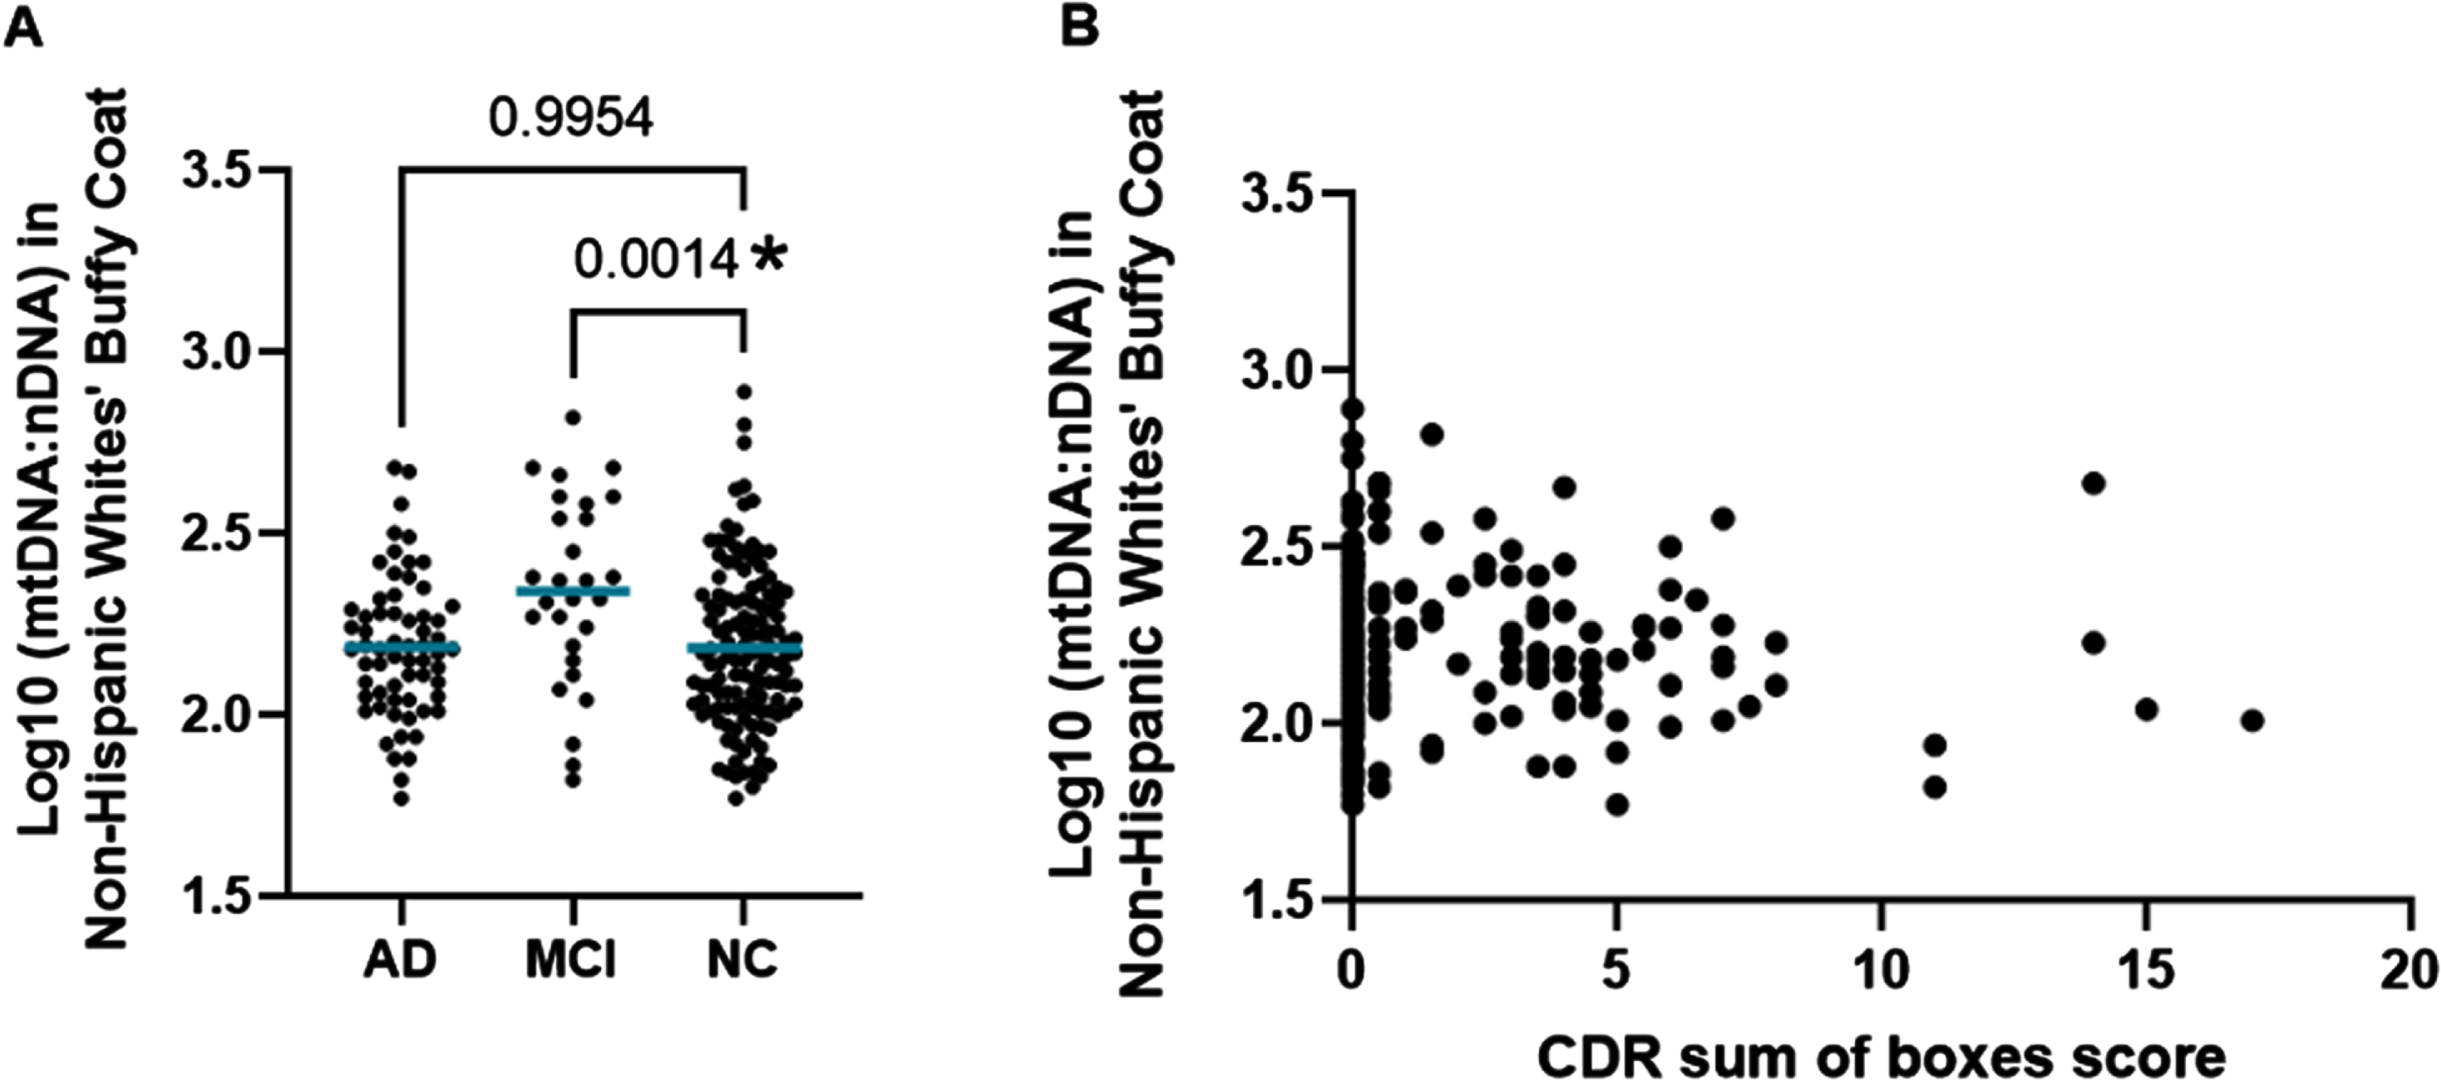
Buffy Coat Copy Number in Non-Hispanic Whites. A) Log10(mtDNA:nDNA ratio) measured in the buffy coat of NHWs by categorical cognitive phenotype. Comparisons to the NC group were performed using Dunnett’s test for multiple comparisons. The mean mtDNA to nDNA ratio of each group is noted by a horizontal blue bar. B) Scatterplot of Log10(mtDNA:nDNA ratio) measured in the buffy coat of NHWs by CDR sum of boxes score. The relationship was measured using Pearson’s r correlation. Pearson r coefficient = –0.02426 and p-value = 0.7205.
Cell-free mtDNA copy number
When analyzing the presence of cell-free mtDNA detected in the plasma samples, we did not observe any significant relationships between mtDNA copy number and cognitive function in either ethnic/racial population (Fig. 3).
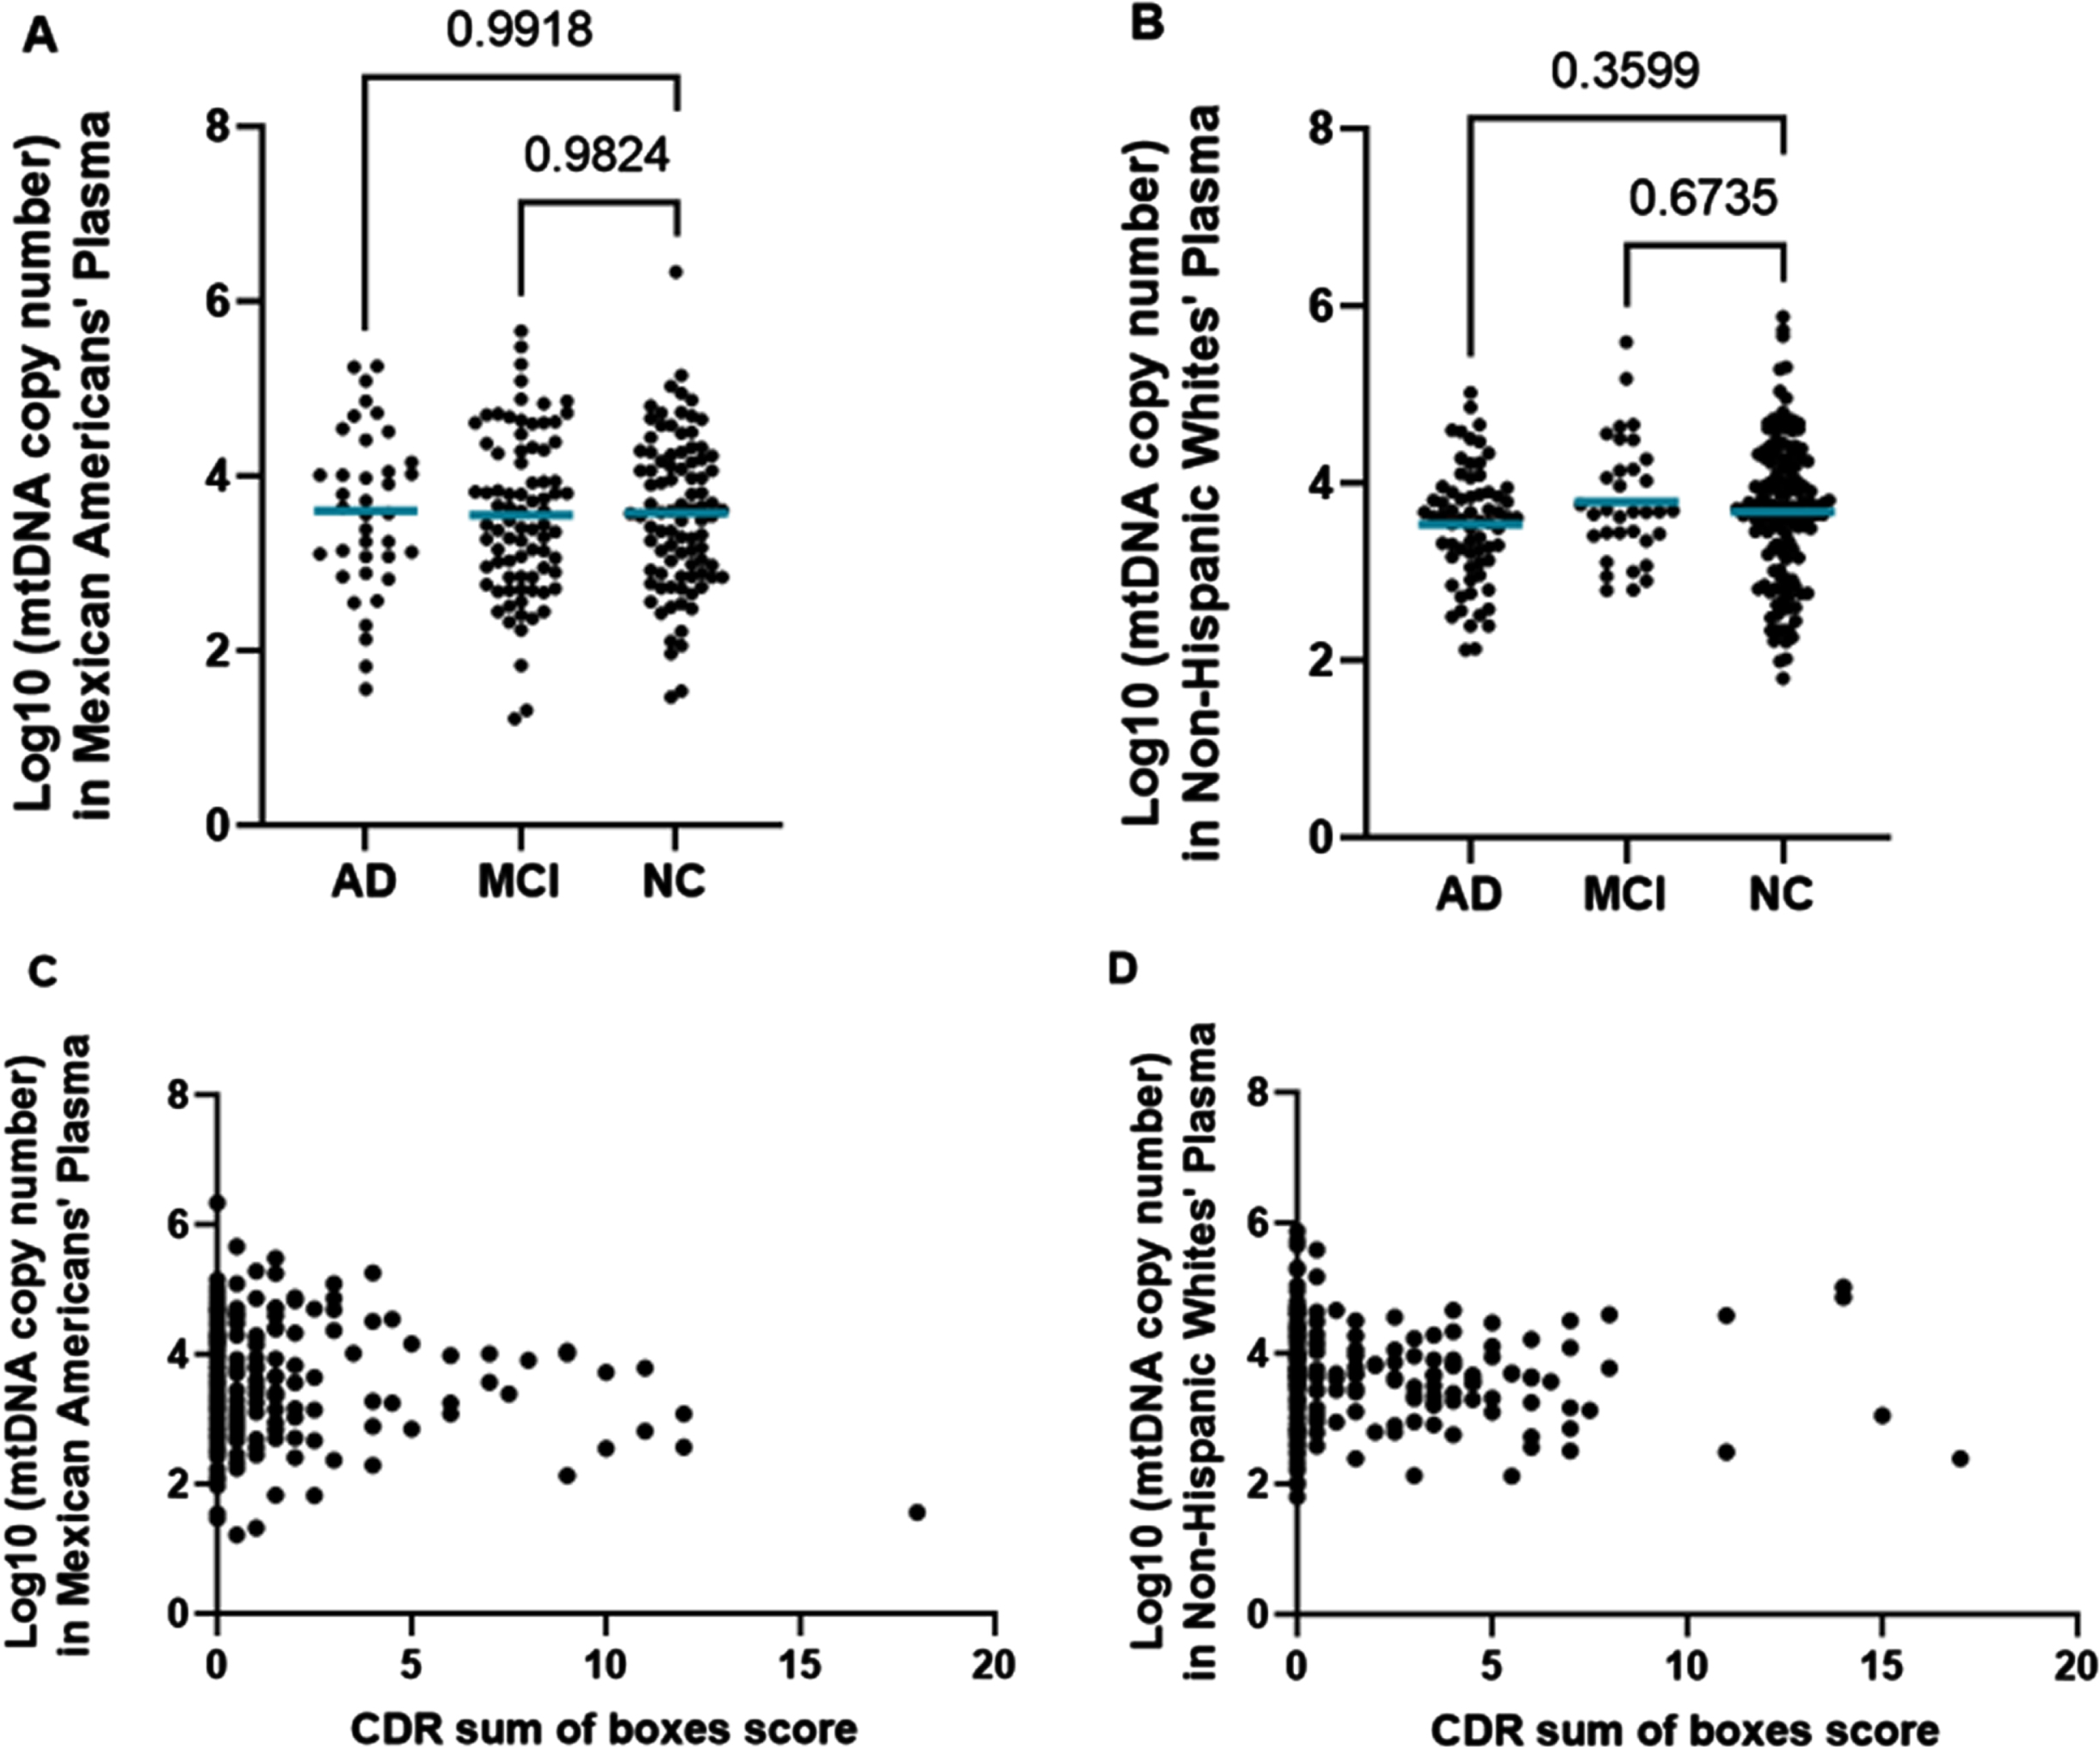
Cell-Free mtDNA Copy Number in MAs (left) and NHWs (right). A) Log10(mtDNA copy number) measured in plasma of MAs by cognitive phenotype. Comparisons were performed using the Dunnett’s test for multiple comparisons. The mean mtDNA copy number of each group is noted by the horizontal blue bar. B) Log10(mtDNA copy number) measured in plasma of NHWs by cognitive phenotype. Comparisons were performed using the Dunnett’s test for multiple comparisons. The mean mtDNA copy number of each group is noted by a horizontal blue bar. C) Scatterplot of Log10(mtDNA copy number) measured in plasma of MAs by CDR sum of boxes score. The relationship was measured using Pearson’s r correlation. r = –0.1077 and p = 0.1187. D) Scatterplot of Log10(mtDNA copy number) measured in plasma of NHWs by CDR sum of boxes score. The relationship was measured using Pearson’s r correlation. r = –0.05294 and p = 0.4113.
Linear regression analysis
Multiple linear regression analysis was conducted to determine which demographic variables were associated with mtDNA copy number and if those variables differed by population. We found that in the MA population, there was a significant relationship between intracellular mtDNA:nDNA ratio and BMI, CDR sum score, the APOE ɛ2/ɛ3 genotype, and education (Fig. 4A). There was also a significant relationship between cell-free mtDNA copy number, education, and CDR sum score (Fig. 4C). In the NHW cohort, there was a significant relationship between cellular mtDNA:nDNA ratio and both age and CDR sum score (Fig. 4B). Age was found to also be associated with cell-free mtDNA (Fig. 4D).
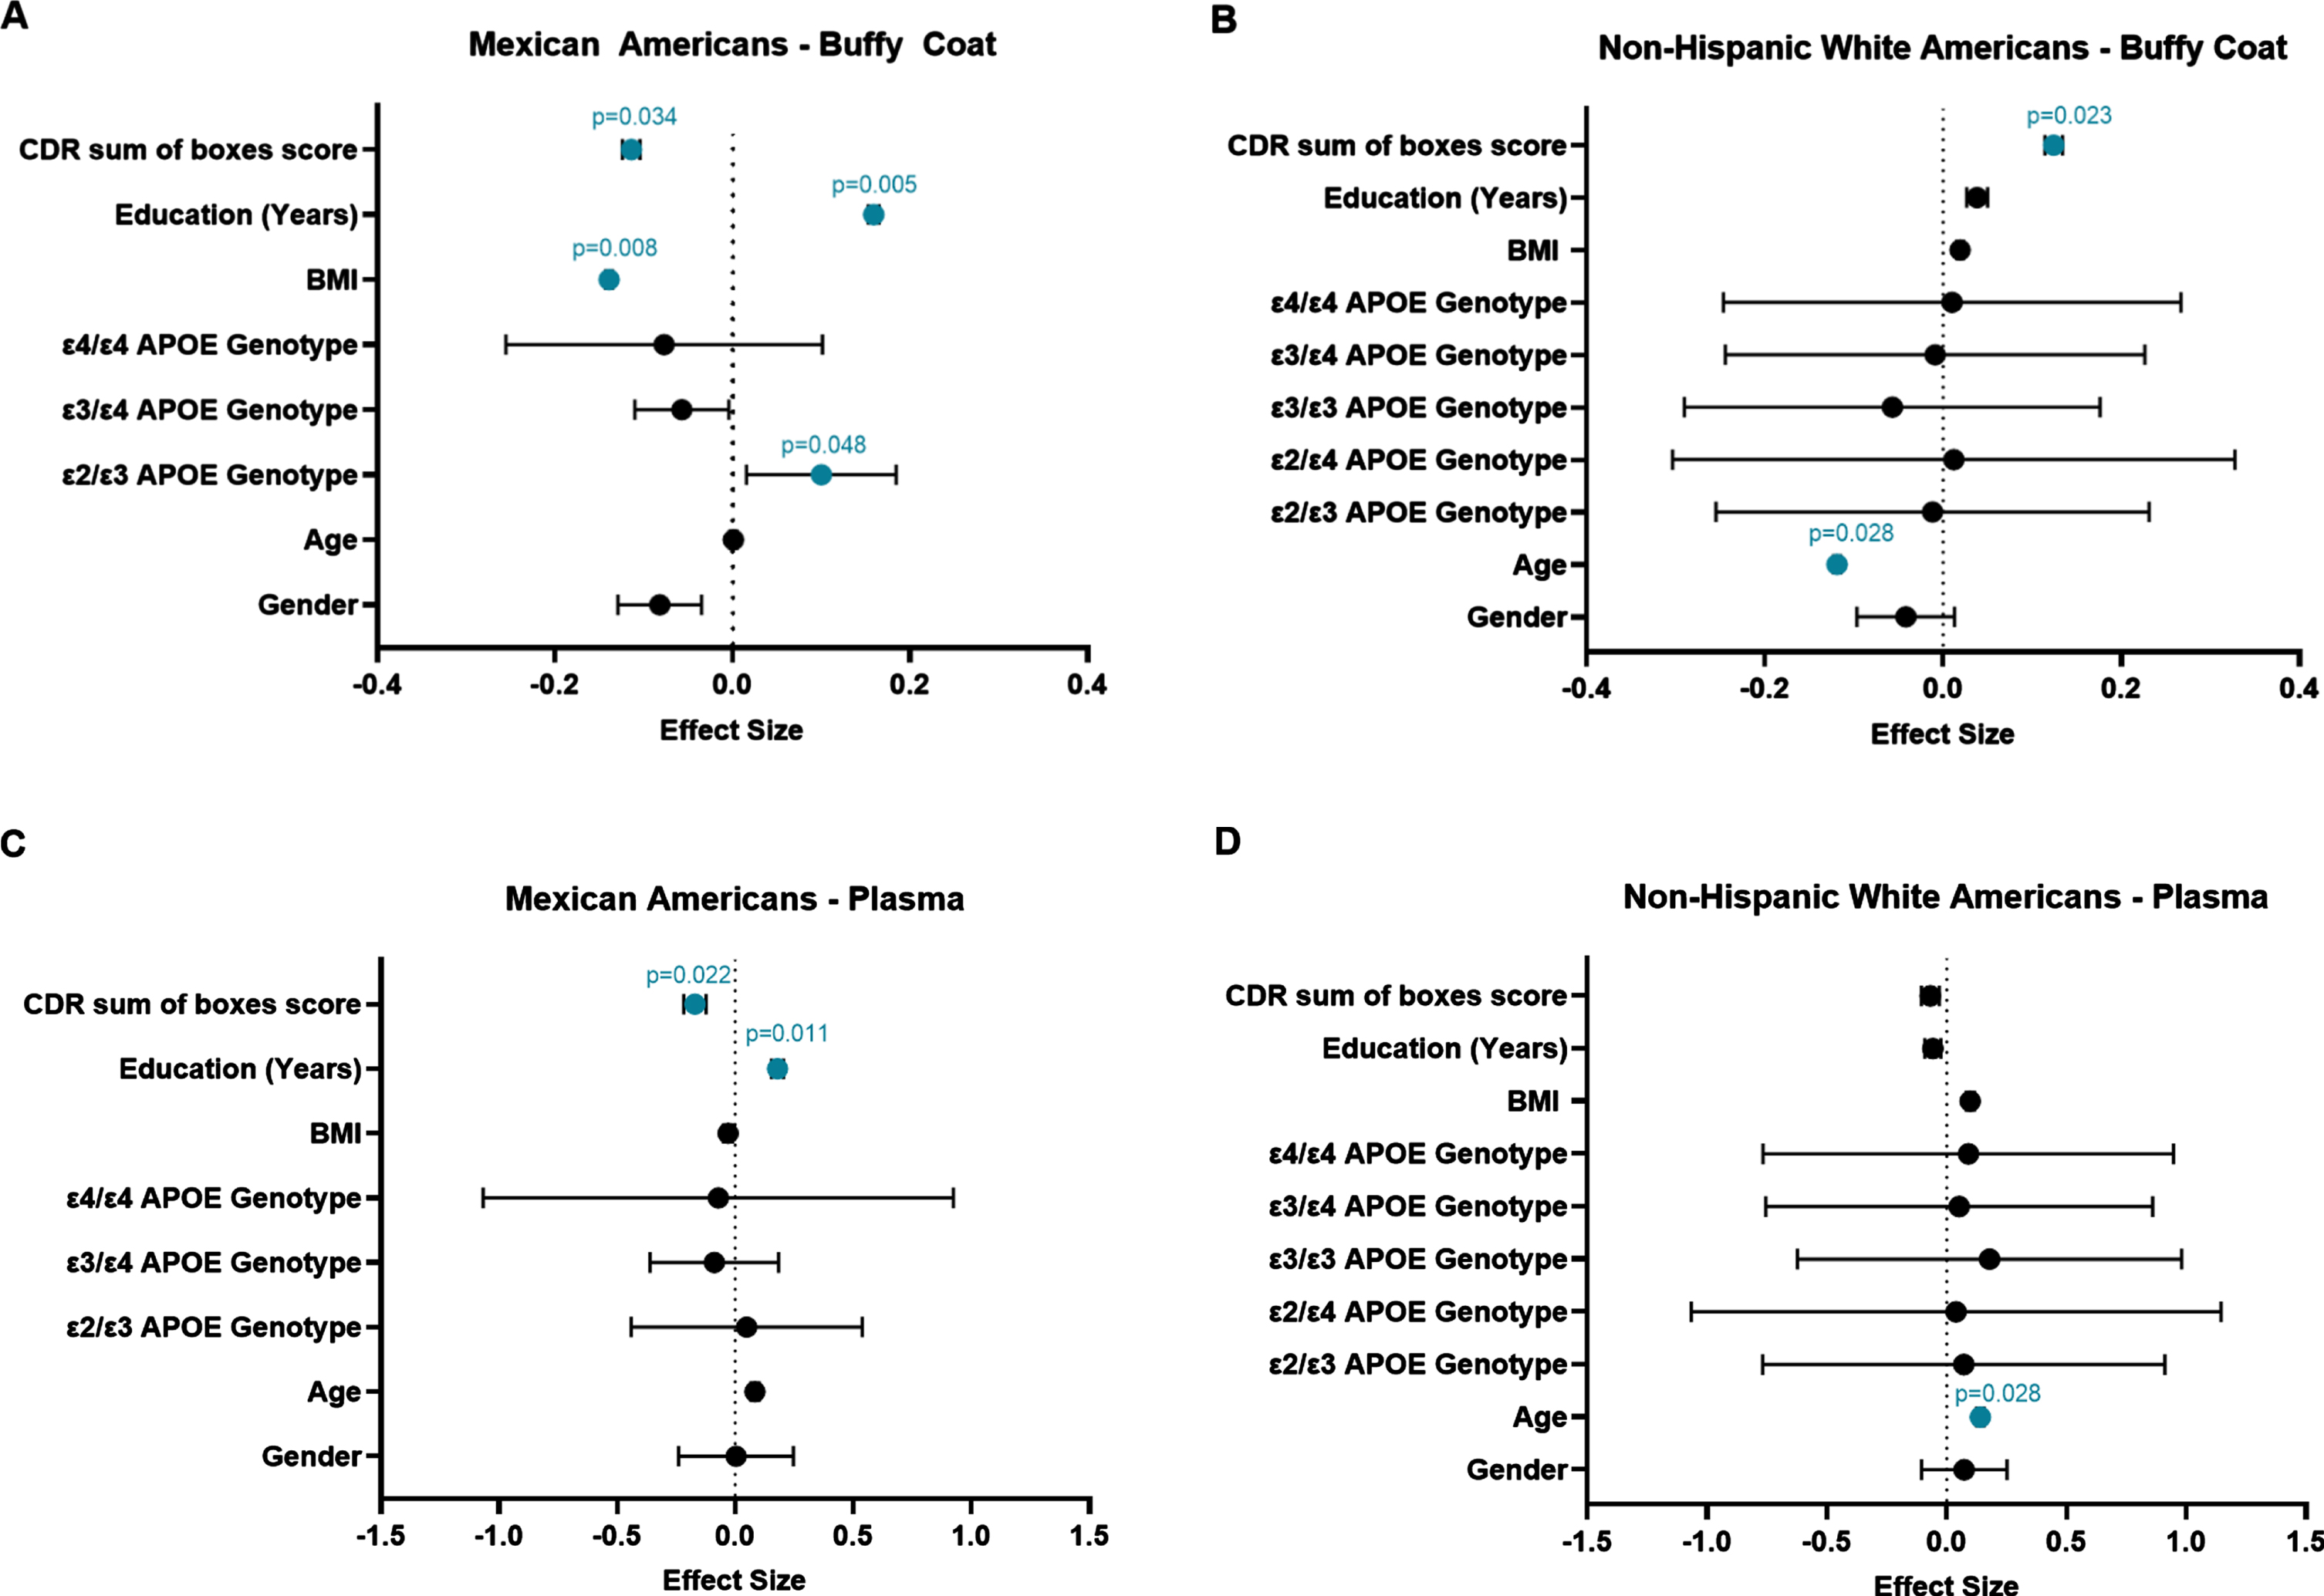
Forest plots depicting the results of our multiple linear regression analysis. The effect size for predictors of Log10(mtDNA:nDNA ratio) in buffy coat are shown on the x-axis in Panels A and B, and the effect size for predictors of Log10(mtDNA copy number) in plasma are shown in Panels C and D. The individual predictor variables are provided on the y-axis. Standardized beta coefficients are depicted as dots and the bars represent the standard error. Variables that were found to be significant in the model are indicated in blue with their corresponding p-value listed above.
DISCUSSION
It has been established that mitochondria play a large role in cellular health and function and that increased mitochondrial dysfunction is associated with multiple diseases, including AD [12, 17]. Furthermore, evidence has shown that not only does the presence of DNA damage and mutations in mtDNA matter in regard to both mitochondrial and also overall human health, but the absolute mtDNA copy number is important to consider as well [28]. Alterations in mtDNA copy number have been observed in multiple tissues of the body as well as in many disease states. Intracellular mtDNA copy number measured in immune cells from peripheral blood has been associated with multiple mitochondrial diseases, as well as age-related diseases such as neurodegenerative diseases (e.g., Parkinson’s disease and AD), multiple types of cancer, and cardiovascular disease [28–30]. These alterations in mtDNA levels have also been linked to mitochondrial dysfunction and increased oxidative stress [30, 31].
Cell-free mtDNA has been shown to be related to aging [32, 33] as well as other disease states, including AD [25, 31]. mtDNA has been shown to be released from the cell as a signaling molecule in normal conditions, as well as in response to oxidative stress [23]. Cell-free mtDNA is thought to function as a DAMP given its theorized endosymbiotic origins and similarity to bacterial DNA [34]. These mtDNA DAMPs have a multitude of immunological effects. These mechanisms of immune responses are additionally interesting given the fact that increased neuroinflammation has been well established as a signature of neurodegenerative diseases, particularly in AD [35, 36] as well as normal aging [37, 38], highlighting the biological relevance of cell-free mtDNA.
We report here that cellular mtDNA copy number is negatively correlated with cognitive status in the MA cohort when other lifestyle factors (i.e., BMI, education, age, etc.) were not considered in the analysis (Fig. 1B). This finding in the MA cohort supports data seen in the similar previous study from our research group which reported decreased cellular mtDNA copy number in MA women with cognitive impairment [13]. Interestingly, this same correlation was not observed in the NHW cohort (Fig. 2). In NHWs we observed an increase in mtDNA copy number in those with MCI, but no correlation when assessing the relationship between mtDNA copy number and CDR sum score (Fig. 2). It is possible that this finding (elevated mtDNA in NHW with MCI) may be an artifact of the small sample size of that group (n = 28) since we did not observe a correlation with CDR sum score. Further studies would need to be carried out to confirm this finding. We speculate that increased mitochondrial dysfunction, as indicated by decreased cellular mtDNA copy number, may play a larger or more direct role in cognitive decline in MAs than in NHWs. However, we note that these analyses did not consider other factors (qPCR batch effects and other demographic variables) that may play an important role in determining mtDNA copy number.
When accounting for these other factors, (such as age, education, BMI, gender, etc.) we observed here that mtDNA copy number measured in the cellular fraction of peripheral blood (buffy coat PBMCs) is associated with cognitive impairment (as measured by CDR sum score). This effect was observed in our multiple linear regression analysis in both MA and NHW, although its effect was negative in MA and positive in NHW (Fig. 4A, B). This may suggest different mechanisms of response to mitochondrial stress related to cognitive decline in our two cohorts, however this remains unclear due to debate in the literature about what is mechanistically occurring that causes these alterations in mtDNA levels and what mtDNA copy number is actually indicating at the cellular level [39]. This association between altered levels of cellular mtDNA in peripheral immune cells (observed in both cohorts) and cognitive status suggests that immune function is altered in individuals with cognitive impairment.
Intracellular mtDNA copy number was shown to be driven by age as an independent factor in the NHW cohort (Fig. 4B). This may indicate that cellular mtDNA copy number (an indicator of mitochondrial dysfunction) in NHWs may be driven more by intrinsic aging than by external environmental or lifestyle risk factors. We report here that increased intracellular mtDNA was associated with the APOE ɛ2/ɛ3 genotype in the MA cohort (Fig. 4A). While certain APOE genotypes are well known in the literature to be associated with an increased (ɛ4) or decreased (ɛ2) risk of developing AD [3, 40], a relationship between those genotypes and the mitochondria is less well established but is of growing interest [17, 41]. There is some evidence of an association between mtDNA copy number and the number or dosage of APOE ɛ4 risk alleles [42]. The association we observed here between the APOE ɛ2/ɛ3 genotype in the MA cohort and intracellular mtDNA levels may serve as some indication that there may also be an association between these protective APOE genotypes (those that are ɛ2 carriers) and mtDNA copy number as well. Further, we report that decreased levels of cellular mtDNA in MAs is shown to be most strongly associated with increased BMI and fewer years of education (Fig. 4A). We also observed a similarly significant effect of education when analyzing cell-free mtDNA copy number measured from the plasma in MA participants as well. We observed a relatively large effect size of BMI on intracellular mtDNA copy number in MAs compared to that seen in non-Hispanic whites. Our results seem to support findings in other studies which have shown a significant association between reduced mtDNA copy number in leukocytes and elevated BMI and/or obesity [43–45]. We speculate this may indicate that in the MA population, extrinsic aging factors may be a more important influence on mitochondrial health and function, which may be related to cognitive decline and AD risk. Taken together, these data lead us to propose that mitochondrial dysfunction may be driven more by social determinants of health (i.e., environmental exposures, etc.) and/or lifestyle related factors among MA, compared to more intrinsic biological factors in NHW. This may lead to further consideration of which risk factors are more relevant to consider in particular populations when interpreting and understanding AD risk.
We also report that mtDNA content in plasma (i.e., extracellularly released) is associated with cognitive status (as measured by CDR sum score) only in MAs (Fig. 4C, D). Furthermore, in MAs we observed a larger effect size and increased specificity in the relationship between mtDNA copy number in plasma and cognitive status than in buffy coat mtDNA. We speculate that this may indicate plasma mtDNA copy number may be a better biomarker for cognitive decline in the MA population. Multiple linear regression analysis showed extracellular mtDNA copy number was associated with education in MAs and with age in NHWs. This is further evidence suggesting extrinsic factors contribute to mitochondrial dysfunction more heavily in MAs and intrinsic factors contribute to mitochondrial dysfunction more heavily in NHWs.
Limitations
Although this data offers us valuable insight into how the AD health disparity among MAs may be impacted by lifestyle-induced mitochondrial stress and dysfunction, there are a few limitations that should be considered. First, there are potential limitations that arise due to the relatively small sample size seen in some of our groups. Although our overall sample size of 527 individuals was moderately sized, once broken down by population and cognitive status, some of the groups had a small sample size. The results shown in this project should be replicated in a larger cohort to draw more informed conclusions. Another limitation important to consider is some of the effects of including APOE in our multiple linear regression model. Although evidence has shown that APOE genotype may influence mitochondrial function [17], including it in our regression may have biased some of our results. This may be primarily due to the frequency of particular APOE genotypes within these populations. Although we saw statistical significance in the effect of the ɛ2/ɛ3 genotype (Fig. 4A) in our MA buffy coat regression model, this may be due to a small number of individuals (n = 18) with this genotype present in our MA cohort, particularly since we did not see similar effects in the other cohort or effects with other APOE genotypes. However, as discussed previously, there is evidence in literature indicating the protective effect of the APOE ɛ2 allele on AD development and it is possible that we may be observing those effects here [3, 40]. A larger sampling of individuals may help to confirm our finding by increasing the representation of this rarer genotype. Despite these limitations, this study helps to further our understanding of the impact of mitochondrial health on cognitive impairment and the effects of modifiable risk factors on AD health disparities.
Future directions
While looking at the levels of mtDNA in these samples may be informative regarding mitochondrial dysfunction, other measures can be evaluated to help gain a better understanding of the overall status of the health of the mitochondria. Some of these measures may include indices of ROS production such as the presence and activity of antioxidant enzymes that work to clear ROS, or the expression of genes that produce these enzymes as well as measurements of the state of the mtDNA and how damaged it may be due to the presence of ROS. A previous project from our research group, performed with this same sample set, showed increased oxidative DNA damage in the mtDNA [22]. This study looked at oxidative mutational load in the mtDNA, particularly measuring 8-oxoG variants, and their relationship to gender, ethnicity, and mitochondrial DNA haplogroup [22]. They found that MAs, particularly MA women, had elevated levels of 8-oxoG mutations in their mtDNA [22]. Their results also showed a suggestive effect of AD cognitive impairment on mtDNA mutational load [22]. In the future, we plan on conducting a meta-analysis on these data sets to determine any relationships between mtDNA copy number, 8-oxoG mutational load, and cognitive decline in this cohort.
Other future projects should focus on deepening the understanding of how mtDNA levels are related to mitochondrial function in buffy coat PBMCs in the context of AD. Future studies should analyze mitochondrial function in PBMCs isolated from individuals with AD compared to those that are cognitively normal. Analyzing mitochondrial function in conjunction with analyzing intracellular mtDNA copy numbers will allow us to further understand how mtDNA levels indicate mitochondrial health and function. Future projects should also be aimed at furthering our understanding of how mtDNA copy numbers may change over the course of disease progression and cognitive decline through the use of longitudinal data. Other future research should aim at uncovering how mtDNA is released from cells into the plasma, what this may indicate about AD progression, and the systemic responses influenced from cell-free mtDNA.
Conclusions
This study provides evidence which supports that there are population-based differences in which factors may be predictive of these blood-based phenotypes of mitochondrial dysfunction, which may be indicative of cognitive decline and AD risk. We observed a significant relationship between each of our indices of mitochondrial dysfunction and cognitive decline (CDR sum score) in both cohorts, as well as extrinsic/environmental risk factors (BMI and education) in MAs and intrinsic/biological risk factors (age) in NHWs. We propose that these risk factors may differentially drive mitochondrial dysfunction that is related to AD cognitive impairment in these distinct populations. This may be used to inform future studies further elucidating the effects of these risk factors on the development of AD in diverse populations. In summary, the data shown here may be used to 1) enhance our understanding of the effects of AD-related risk factors on mitochondrial dysfunction, (2) the effects of mitochondrial dysfunction on cognitive impairment, and 3) help identify AD risk factors that may be of higher importance in their effects on mitochondrial health in various populations.
Footnotes
ACKNOWLEDGMENTS
This project was supported in part by the Texas Alzheimer’s Research & Care Consortium through the Darrell K Royal Texas Alzheimer’s Initiative, directed by the Texas Council on Alzheimer’s Disease and Related Disorders.
FUNDING
This project was funded by a grant from the Texas Alzheimer’s Research and Care Consortium (2020-61-51-II), NIH/NIMHD (3U54MD006882-08S2), NIH/NIMHD IMSD 5R25GM125587-03, NIH/NIA Training Grant 2T32AG020494-16A1, and by the Cancer Prevention and Research Institute of Texas (CPRIT) under Award Number RP210046.
CONFLICT OF INTEREST
The authors declare no conflicts of interest.
DATA AVAILABILITY
The data used in this study is under restrictions that limit its availability to the public. With permission of the Texas Alzheimer’s Research and Care Consortium’s Data Coordinating Center upon reasonable request, the data is available. Permission was obtained for use of this data for the current study.