
Abstract
Background:
With the aging of populations worldwide, Alzheimer’s disease (AD) has become a concern due to its high prevalence and the continued lack of established treatments. Early diagnosis is required as a preventive intervention to modify the disease’s progression. In our previous study, we performed peptidomic analysis of serum samples obtained from AD patients and age-matched healthy subjects to seek peptide biomarker candidates for AD by using BLOTCHIP-MS analysis, and identified four peptides as AD biomarker candidates.
Objective:
The objective was to validate the serum biomarker peptides to distinguish mild cognitive impairment (MCI) and AD in comparison to cognitively healthy controls using a new peptidome technology, the Dementia Risk Test.
Methods:
We enrolled 195 subjects with normal cognitive function (NC; n = 70), MCI (n = 55), and AD (n = 70), The concentrations of cognitive impairment marker peptides (Fibrinogen α chain (FAC), Fibrinogen β chain (FBC), Plasma protease C1 inhibitor (PPC1I), α2-HS-glycoprotein (AHSG)) were quantified by using a selected reaction monitoring assay based on liquid chromatography-MS/MS.
Results:
The present study confirmed that three peptides, FAC, FBC, and PPC1I, were significantly upregulated during the onset of AD. This three-peptide set was both highly sensitive in determining AD (sensitivity: 85.7%, specificity: 95.7%, AUC: 0.900) and useful in distinguishing MCI (sensitivity: 61.8%, specificity: 98.6%, AUC: 0.824) from NC.
Conclusions:
In this validation study, we confirmed the high diagnostic potential of the three peptides identified in our previous study as candidate serum biomarkers for AD. The Dementia Risk Test may be a powerful tool for detecting AD-related pathological changes.
Keywords
INTRODUCTION
Alzheimer’s disease (AD) is a degenerative brain disease characterized by a decline in memory, language, problem-solving, and other cognitive abilities. AD, which is the most common cause of dementia, is estimated to account for about 60–80% of all cases of dementia [1, 2]. In general, the diagnosis of AD is made by a combination of a medical interview and a magnetic resonance imaging (MRI) or amyloid positron emission tomography (PET) scan to determine the state of brain atrophy and amyloid-β (Aβ) accumulation. Current diagnostic methods for AD are generally expensive, which limits their widespread use. Therefore, biomarkers are urgently needed using available biological fluids such as blood and saliva. This will enable minimally invasive or non-invasive, and objective assessment of the AD status [3]. Biochemical markers will also become more important in developing future therapies, such as disease-modifying treatments. These markers are essential for identifying which patients are at an early stage of AD and should receive disease-modifying therapies [1]. Recent studies successfully predicted AD from proteins in plasma and metabolites in saliva, but have not been validated, so further validation studies are needed [4 –6]. It has also been reported that measurement errors can occur among different measurement institutions, even for biomarkers obtained from the same sample of the same population, so a greater emphasis should be placed on validity [3, 7].
Proteomics is an exciting technique that might provide additional value as a prognostic tool, while serum proteome analysis has the potential to facilitate the diagnosis and therapeutic monitoring of various diseases. Human serum contains thousands of protein-derived peptides known as peptidomes, which are strongly correlated with physiological and pathological processes [8 –11]. These peptidome markers are reportedly potentially more sensitive and specific than conventional cancer biomarker approaches [10, 12]. In our previous study, we performed peptidomic analysis of serum samples obtained from AD patients and age-matched healthy subjects to seek peptide biomarker candidates for AD. Previously, we employed BLOTCHIP-MS analysis, which is based on an analytical technique, matrix-assisted laser desorption–ionization-time-of-flight mass spectrometry (MALDI-TOF MS), that allowed the electrophoretic separation of peptidomes involving not only free peptides but also protein-bound peptides, and were able to identify four peptides as AD biomarker candidates. Interestingly, these peptides were not Aβ or tau fragments, but were instead related to the coagulation and complement/inflammatory systems, each of which has been implicated in the pathogenesis of AD. A newly established one-step direct transfer technology, BLOTCHIP-MS analysis, is a rapid quantitative technology for peptidomic analysis. Serum samples were subjected to electrophoresis to separate peptides distant from proteins. Next, peptides in the gel were electroblotted onto BLOTCHIP (Protosera Inc., Osaka, Japan). A MALDI matrix, α-cyano-4-hydroxycinnamic acid (CHCA), was applied directly onto BLOTCHIP, and peptidome profiles were obtained in a linear mode of ultrafleXtereme MLADI-TOF/TOF (Bruker Corporation, MA, USA), as was previously described in detail [11]. In the present study, we established a Selected Reaction Monitoring (SRM) assay based on liquid chromatography (LC)-MS/MS using the Dementia Risk Test, which improves the performance of SRM for clinical applications [10]. The serum probability of dementia (SPD) is equivalent to a predicted probability calculated from the binomial logistic model and was constructed using the concentrations of the three-peptide set obtained by the SRM assay with a stable isotope dilution. A higher index corresponds to a higher risk of dementia, and spans from 0.0 to 1.0. The SRM has become a standard method in the field of proteomics research and clinical tests since it provides highly quantitative results. Based on the serum concentrations of candidate peptides, we calculated the positive probabilities obtained from regression analyses and compared them with normal, MCI, and AD patients.
METHODS
Participants
For the present study, we recruited 234 subjects with normal cognitive function (NC), mild cognitive impairment core clinical criteria (MCI), and probable AD dementia (AD) at multiple centers (Okayama University Hospital, Gunma University Hospital, and Showa University Hospital) from March 2017 to February 2019. The diagnosis of NC, MCI, and AD was made by expert neurological clinicians based on the NIA-AA criteria (2011) for probable AD dementia [13] and for mild cognitive impairment core clinical criteria [14]. The criteria for MCI were a mild cognitive decline in one or more cognitive domains, essentially preserved basic activities of daily living (ADL), and the absence of dementia, delirium, or other mental disorders [15]. The cognitive function of participants was examined with the Mini-Mental State Examination (MMSE) [16]. Specifically, women who were pregnant or of childbearing potential, patients with a history of sudden onset, gait disturbance, seizures, or early onset of behavioral abnormalities were excluded. Patients with clinical features such as focal neurological features and early extrapyramidal signs were also excluded. Patients with other medical disorders severe enough to account for memory and related symptoms, such as non-AD dementia, major depression, bipolar disorder, history of schizophrenia, history of alcoholism or other drug dependence, cardiovascular disease, toxic and metabolic abnormalities, and FLAIR or T2 abnormalities, were excluded. Patients with serious or unstable illnesses, and patients for whom the protocol for serum collection was not strictly adhered to, were also excluded. We enrolled 70 gender- and age-matched NC and AD patients for the logistic regression analysis to obtain an equation for calculating SPD as a risk index of cognitive impairment. We also enrolled 55 age-matched MCI patients. The clinical information of NC, MCI, and AD is summarized in Table 1.
Participants summary of the present study
NC, normal control; MCI, mild cognitive impairment; AD, Alzheimer’s disease; MMSE, Mini-Mental State Examination. $Kruskal-Wallis test; ** p < 0.01 versus control; # p < 0.05 versus MCI; ## p < 0.01 versus MCI. Data are expressed mean±SD.
Ethical permission for this study was provided by the Ethics Committee on Epidemiological Studies of the Okayama University Graduate School of Medicine, Dentistry and Pharmaceutical Sciences and participating hospitals (approval #163-031). Written informed consent was obtained from all participants before enrollment.
Serum collection
Serum was collected from participants according to our previous report [11]. Briefly, 8 mL of blood was collected from participants and placed for 1 h at room temperature (RT), then centrifuged at 1,000 g for 10 min at RT. The resultant supernatant was temporarily stored at –80°C until the examination described next. For blood sampling, there were no restrictions, such as fasting.
Peptide extraction and LC–MS/MS measurements
According to the instruction manual and a previous report [10], concentrations of cognitive impairment marker peptides (Fibrinogen α chain (FAC), Fibrinogen β chain (FBC), Plasma protease C1 inhibitor (PPC1I), α2-HS-glycoprotein (AHSG)) were determined using the Dementia Risk Test (Protosera, Inc., Osaka, Japan). Briefly, each serum sample was spiked with a mixture of internal standards composed of synthetic stable isotope-labeled peptide standards (SIS) whose sequences were identical to corresponding cognitive impairment marker peptides but had isotope-labeled amino acids. The stable isotope amino acid L-Arginine (13C6, 99%; 15N4, 99%), which has a mass number increased by 10 atomic weights compared to the original amino acid, with six stable isotopes of carbon (atomic weight 13) and four stable isotopes of nitrogen (atomic weight 15) substituted, was used to label SIS. The inter/intra CV% was validated with a sample size of 4 and the results are shown in Supplementary Table 1. The spiked serum sample was then applied to solid-phase extraction resin to adsorb peptides, followed by washing and elution. The extraction resin and buffers for washing and elution were supplied within the kit. The eluate was concentrated up to 50μL using a vacuum concentrator (CC-105, TOMY Seiko, Tokyo, Japan) with a low-temperature trap/Model TU-1000 (TOMY Seiko). The concentrated sample was subjected to a LC-MS/MS measurement using evo TQ-S micro-equipped with an Acquity UPLC I-Class system (Waters Corporation, Milford, MA, USA) in the SRM mode. The peak areas of each endogenous peptide and corresponding SIS peptide were obtained using TargetLynx software (Waters Corporation). The peak area ratios between each endogenous peptide and corresponding SIS were used to calculate the concentration of each cognitive impairment marker peptide in serum samples. Those concentrations in NC and AD subjects were subjected to logistic regression analysis to obtain the working function. Multiple binomial logistic regression models with NC and AD marker peptides as independent variables were used to calculate the cognitive impairment risk index in each subject, i.e., SPD. The model was used not only to discriminate between NC and AD, but also between NC and MCI.
Statistical analysis
Continuous demographic and clinical data are presented as the mean±standard deviation (S.D.) in the text and table. Statistical analyses were performed using R statistical environment software [17] and GraphPad Prism version 8.4.3 (GraphPad Software LCC, CA, USA). After having checked for normality, we performed Fisher’s Exact test to compare gender among NC, MCI and AD groups and the Kruskal-Wallis test to compare age, MMSE scores, and the expression levels of candidate peptides (FAC, FBC, PPC1I, AHSG) among NC, MCI, and AD groups. P-values < 0.05 were considered to be significantly different. Receiver operating characteristic (ROC) analysis was performed with the ‘Epi’ package [18] within R software. Area under the curve (AUC) values were calculated from the ROC curve to indicate their diagnostic value. The optimal cutoff thresholds for diagnosis were determined according to Youden’s index [19]. Mathematically, Youden’s index is defined as the difference between sensitivity and 1 – specificity. A value of 1 indicates perfect discrimination, where there are no false positives or false negatives. In practice, Youden’s index is often used to determine the optimal cutoff point for a diagnostic test or classifier by selecting the threshold that maximizes the index. Used in conjunction with ROC analysis, Youden’s index is represented graphically as the height above the random classifier and is also equivalent to the AUC subtended by a single operating point. The AUC values’ confidence intervals (95% CI) were calculated using the ‘pROC’ package with default settings [20].
RESULTS
Participants’ characteristics
All participants were diagnosed by expert neurological clinicians, including their cognitive status, and had their blood drawn. The demographic and clinical features of subjects with NC (n = 70), MCI (n = 55), and AD (n = 70) are shown in Table 1. There were understandable differences in MMSE scores (NC: 29.2±1.0, MCI: 26.0±2.6 **p < 0.01 versus NC, AD: 18.5±6.4 **p < 0.01 versus NC ## p < 0.01 versus MCI), and the ratio of male to female (NC: 72.8%, MCI: 49.0%, AD: 61.4%). The examined age showed no significant differences among the three groups (NC: 74.1±7.8, MCI: 76.5±7.8, AD: 76.3±11.1).
Selection of candidate peptides
We previously reported four diagnostic peptides and their mother proteins for MCI and AD related to an important pathomechanism of AD using the BLOTCHIP-MS method [11]. In this study, we quantified these four peptides (FAC, FBC, PPC1I, AHSG) using the Dementia Risk Test method and investigated the diagnostic performance of a single marker peptide by comparing NC and AD. The expression levels of candidate peptides in each group are indicated in Table 1. The expression of the three peptides (FAC, PPC1I, FBC) increased significantly in MCI and AD compared to NC, but AHSG was not different among the three groups (Table 1, Fig. 1b, d, f, h). We further checked for gender differences in the expression levels of the four peptides and found no significant differences between males and females for any of the peptides (FAC: male 580.8±302.7, female 718.6±303.4; PPC1I: male 1168.4±408.7, female 1117.6±453.5; FBC: male 31.2±20.1, female 26.4±12.1; AHSG: male 376.2±133.9, female 384.2±98.3, Supplementary Figure 1). Next, ROC analysis was performed on each of the four candidate peptides. When the cut-off value of FBC was set to 17.3 ng/mL, the sensitivity and specificity to discriminate AD from NC were 80% and 89%, respectively (Table 2, Fig. 1a, AUC: 0.852). In the same manner, when the cut-off value was 962 ng/mL, the sensitivity and specificity of PPC1I were 66% and 94%, respectively (Table 2, Fig. 1c, AUC: 0.772). In FAC (cut off: 417.4 ng/mL), sensitivity and specificity were 81% and 93%, respectively (Table 2, Fig. 1e, AUC: 0.877). Although these three candidate peptides displayed moderate accuracy, AHSG was unable to significantly discriminate between NC and AD (Table 2, Fig. 1g, cut off: 301.2 ng/mL, sensitivity: 30%, specificity: 81%, AUC: 0.528). Therefore, we eliminated AHSG as a candidate marker.
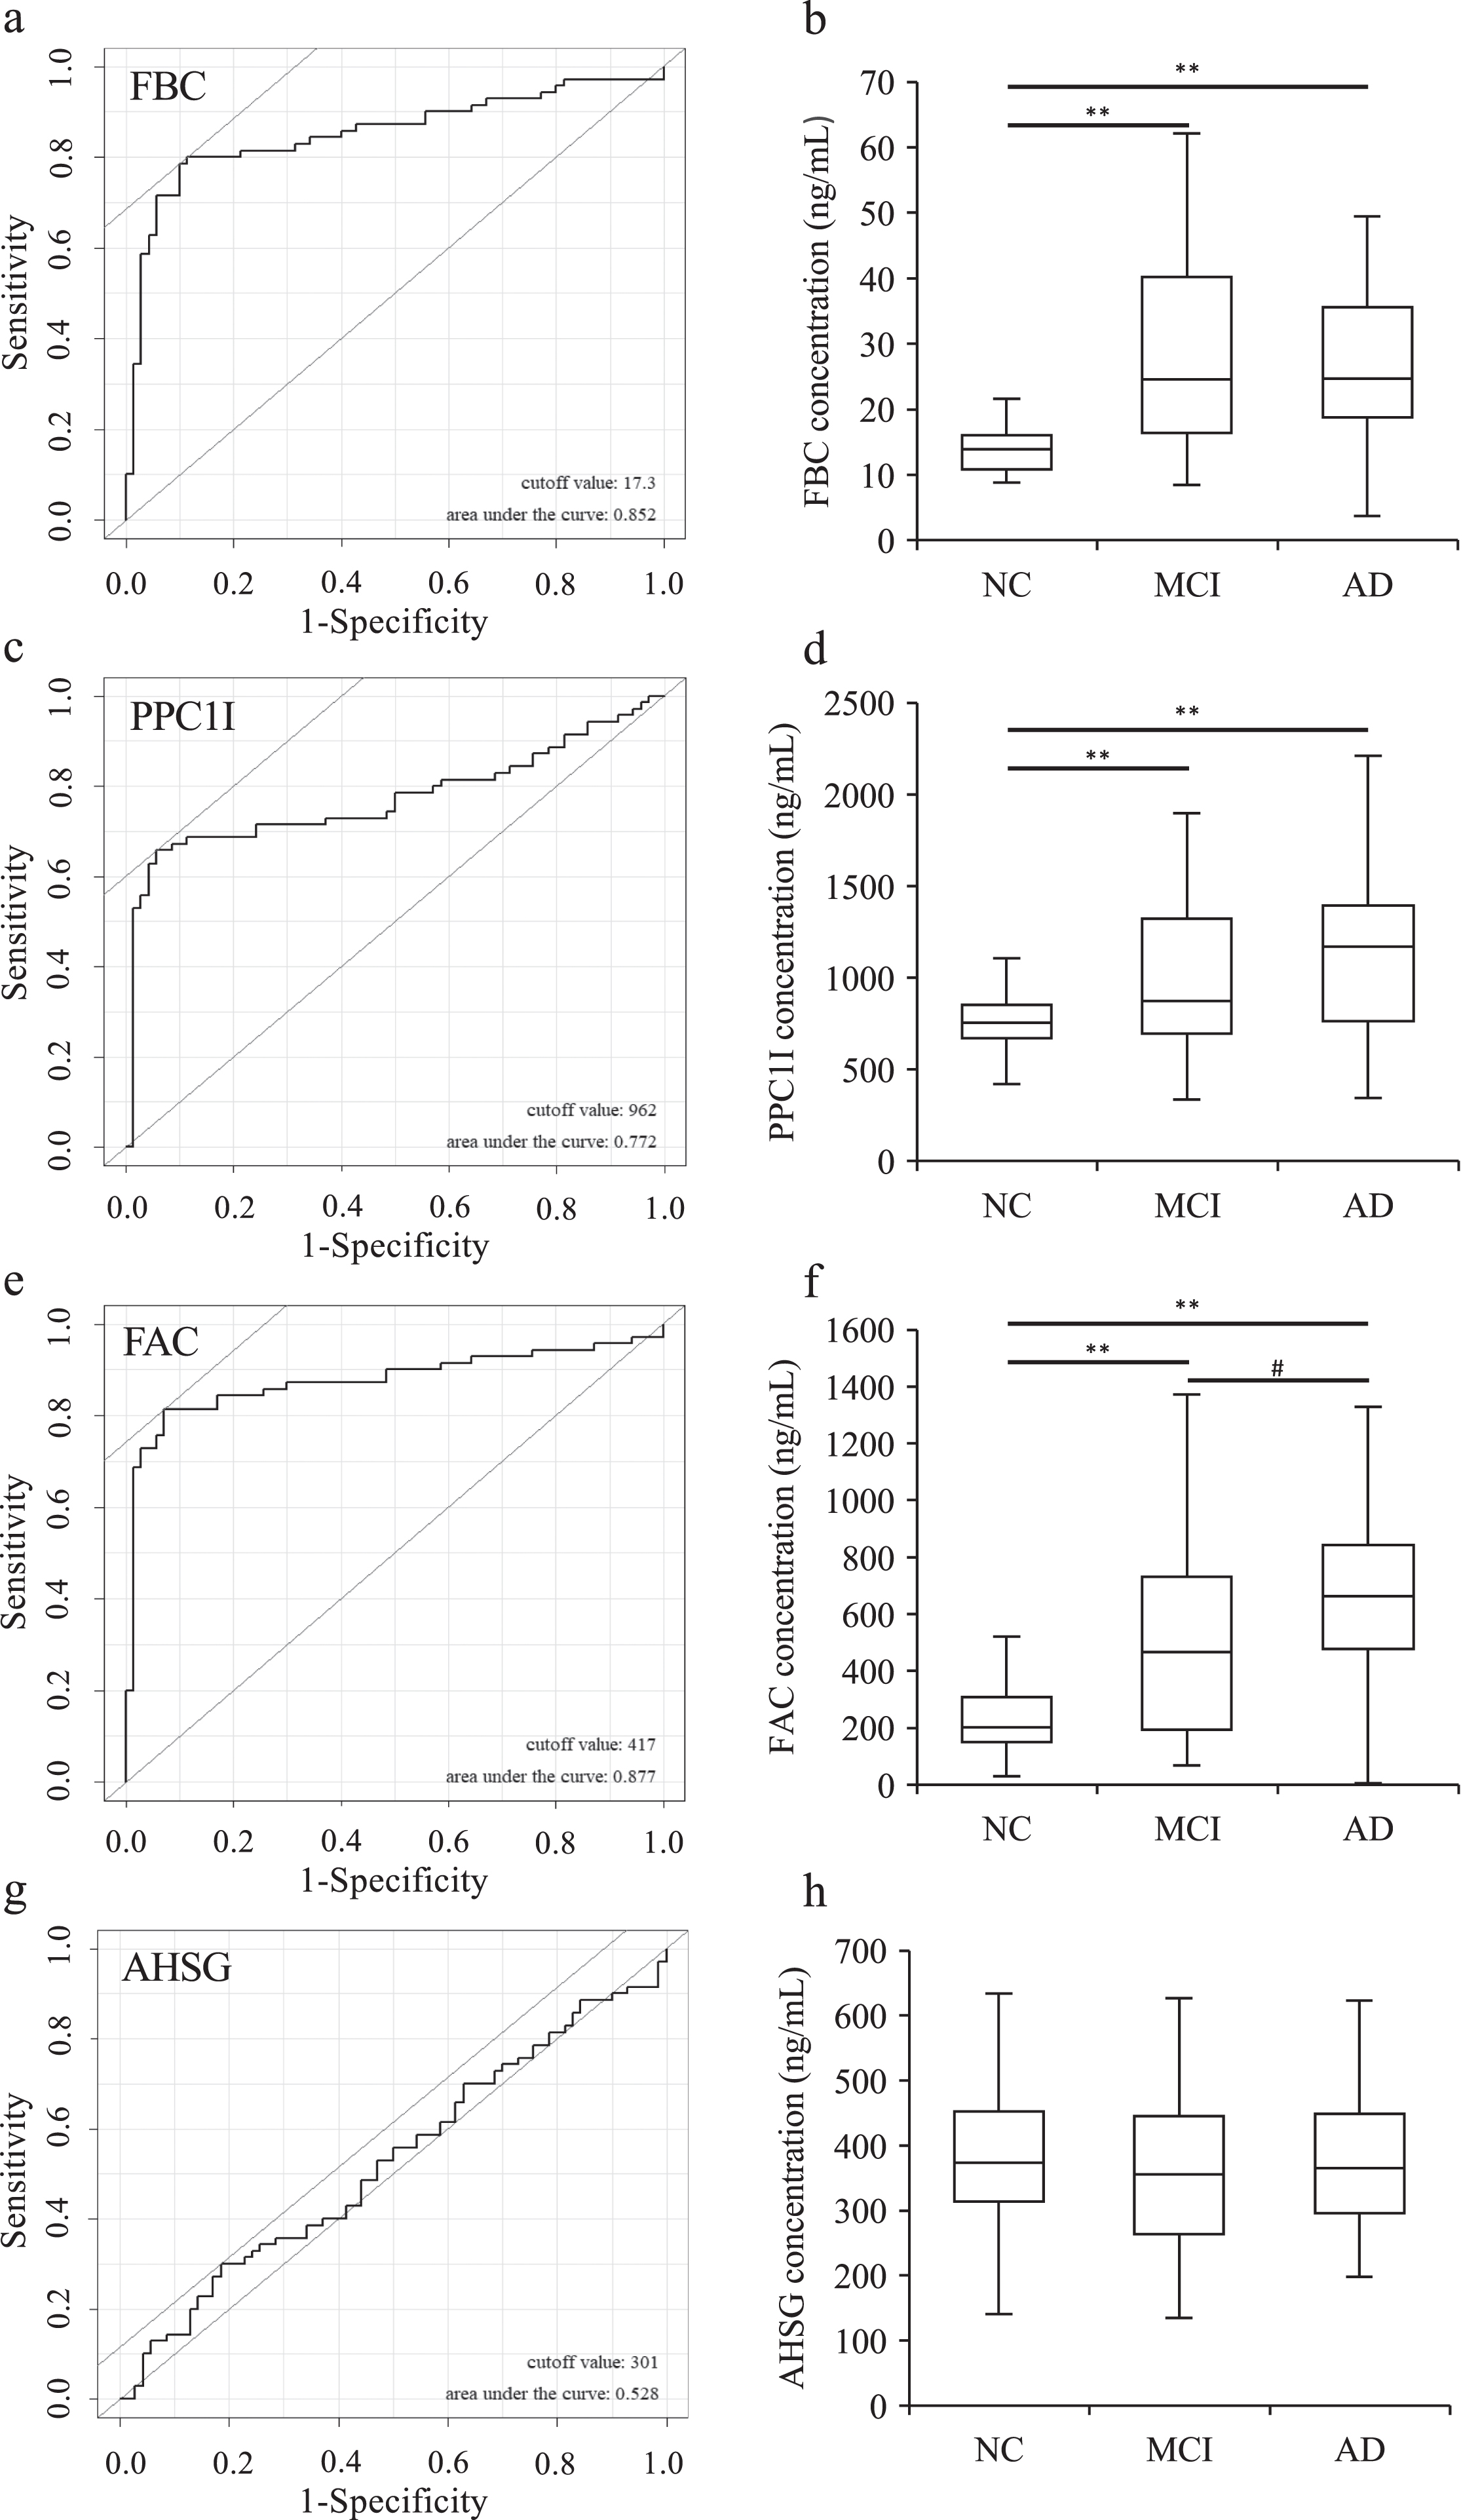
The ROC curves to discriminate between NC and AD and the box plots comparing between the NC, MCI and AD in FAC (a, b), PPC1I (c, d), FBC (e, f). and AHSG (g, h) related to Table 2. Note that the expression of FAC, PPC1I, and FBC was significantly increased in MCI and AD compared to NC (**p < 0.01), and showed moderate accuracy in ROC analysis. In the FAC, a significant difference was observed between MCI and AD (# p < 0.05).
Diagnostic performance of single marker peptide
AUC, Area under the curve; NC, normal control; AD, Alzheimer’s disease; FBC, Fibrinogen β chain; PPC1I, Plasma protease C1 inhibitor; FAC, Fibrinogen α chain; AHSG, α2-HS-glycoprotein. *Statistical analysis was performed using the Mann-Whitney’s U test.
A multiple binomial logistic regression model
A multiple binomial logistic regression model was constructed using the remaining three peptides to improve their performance as a disease risk markers. After examining samples of a training data set (70 NC subjects and 70 AD patients), an optimized model with the highest diagnostic performance was obtained as follows: SPD = 1/(1 + e$∧$(–(–4.388 + 9.413E-02 [FBC]+3.896E-04 [PPC1I]+5.679E-03 [FAC]))).
ROC analysis was performed based on the values obtained from the discriminant equation (SPD) and the diagnosis, and the cut-off values for NC and AD were set by Youden’s index. When the cut-off value of SPD was set to 0.518, the sensitivity and specificity to discriminate AD from NC were 85.7% and 95.7%, respectively (AUC: 0.900, Table 3, Fig. 2). Next, SPD was fitted to the NC and MCI samples to determine the cut-off values to discriminate between NC and MCI. In addition to demonstrating high accuracy in comparing NC and AD, MCI was also detected with high specificity (cut off: 0.667, sensitivity: 61.8%, specificity: 98.6%, AUC: 0.824, Table 3, Fig. 2).
Diagnostic performance of the three-peptide multi-marker set
AUC, Area under the curve; NC, normal control; MCI, mild cognitive impairment; AD, Alzheimer’s disease.
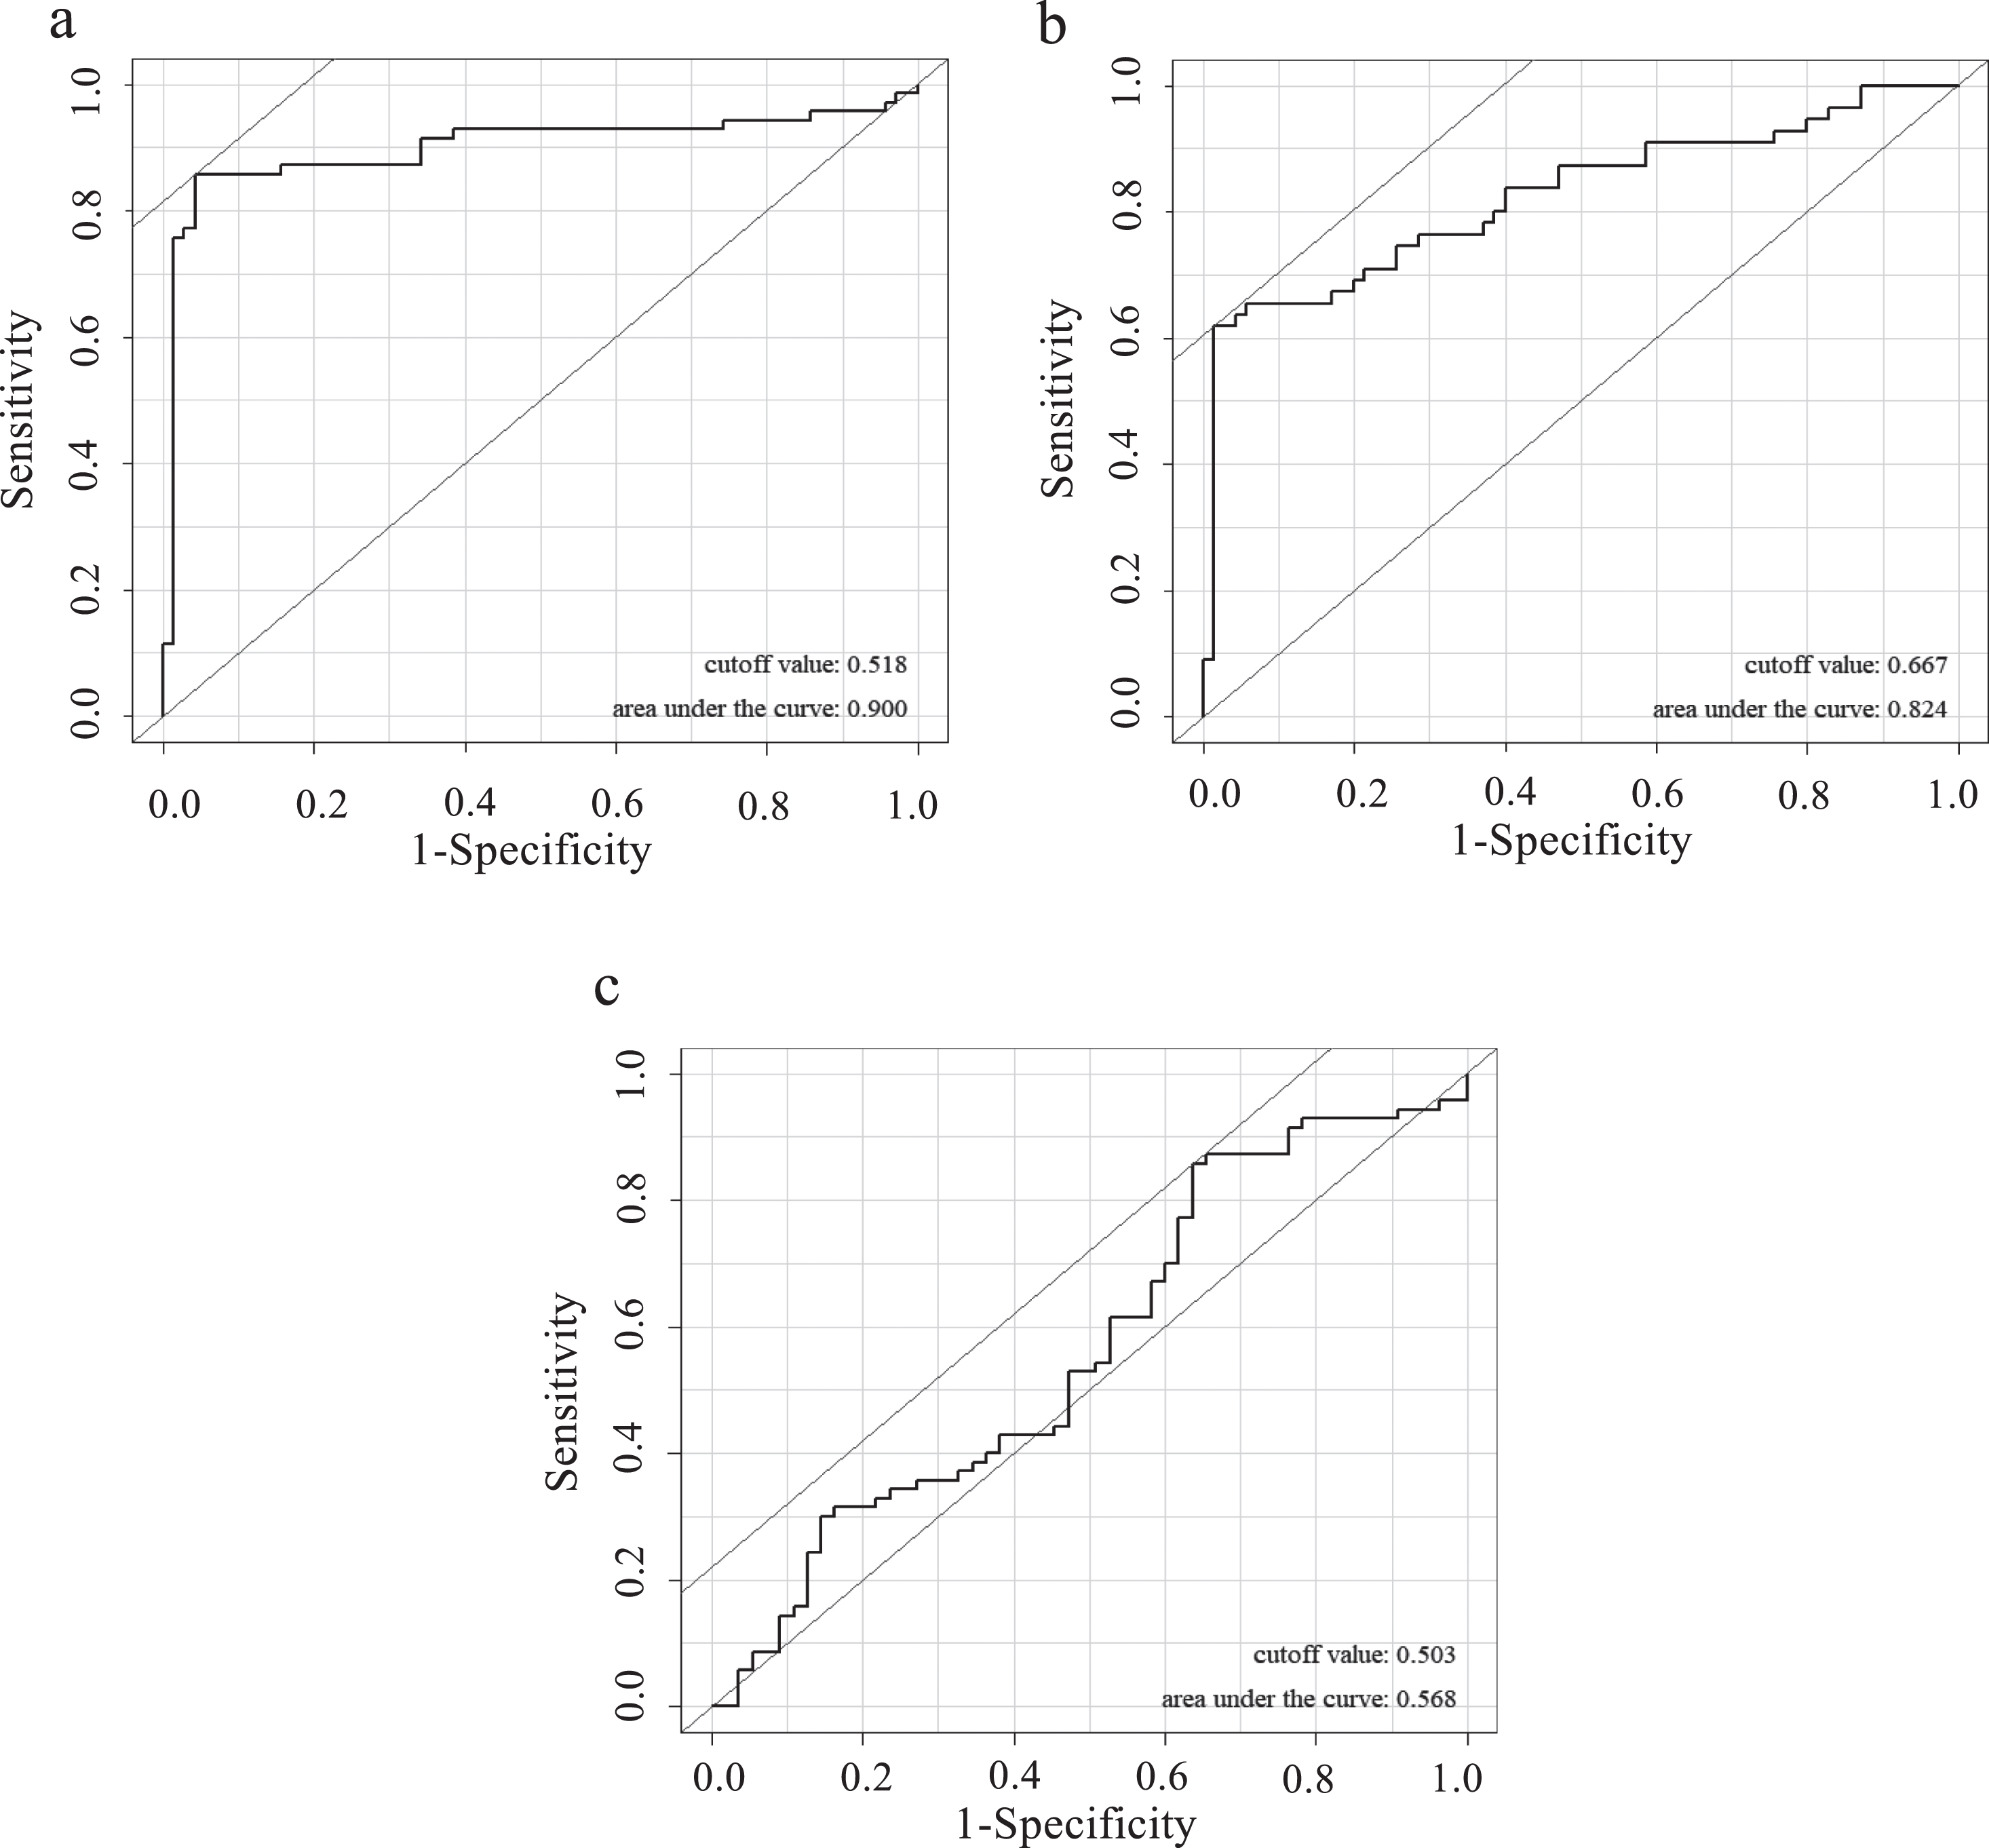
ROC analysis was performed based on the values obtained from SPD and the diagnosis, and the necessary cut-off values for NC and AD were set (a). When the cut-off value of SPD was set to 0.518, the sensitivity and specificity to discriminate AD from NC were 85.7% and 95.7%, respectively (AUC: 0.900). Next, SPD was fitted to the NC and MCI samples to determine the cut-off values to discriminate between NC and MCI (b). The difference between NC and MCI was detected with high specificity (cut off: 0.667, sensitivity: 61.8%, specificity: 98.6%, AUC: 0.824). However, the difference between MCI and AD was unable to significantly discriminate (c, cut off: 0.503, sensitivity: 85.7%, specificity: 36.4%, AUC: 0.568).
It was confirmed that SPD can discriminate between NC and MCI or AD by setting a certain cut-off value. Thus, to show the range of SPD in each group and to check the relationship with MMSE scores, SPD values were shown as box plots while MMSE scores were shown as dot plots, and these were superimposed. MMSE scores declined significantly as disease progressed (Table 1) and there were significant differences between the control and MCI or control and AD (** p < 0.01) in SPD. However, changes in SPD were different from MMSE scores: SPD was low in NC (0.23±0.17) but increased sharply in MCI (0.67±0.35) and AD (0.77±0.28), although there was a wide range of scores (Fig. 3).
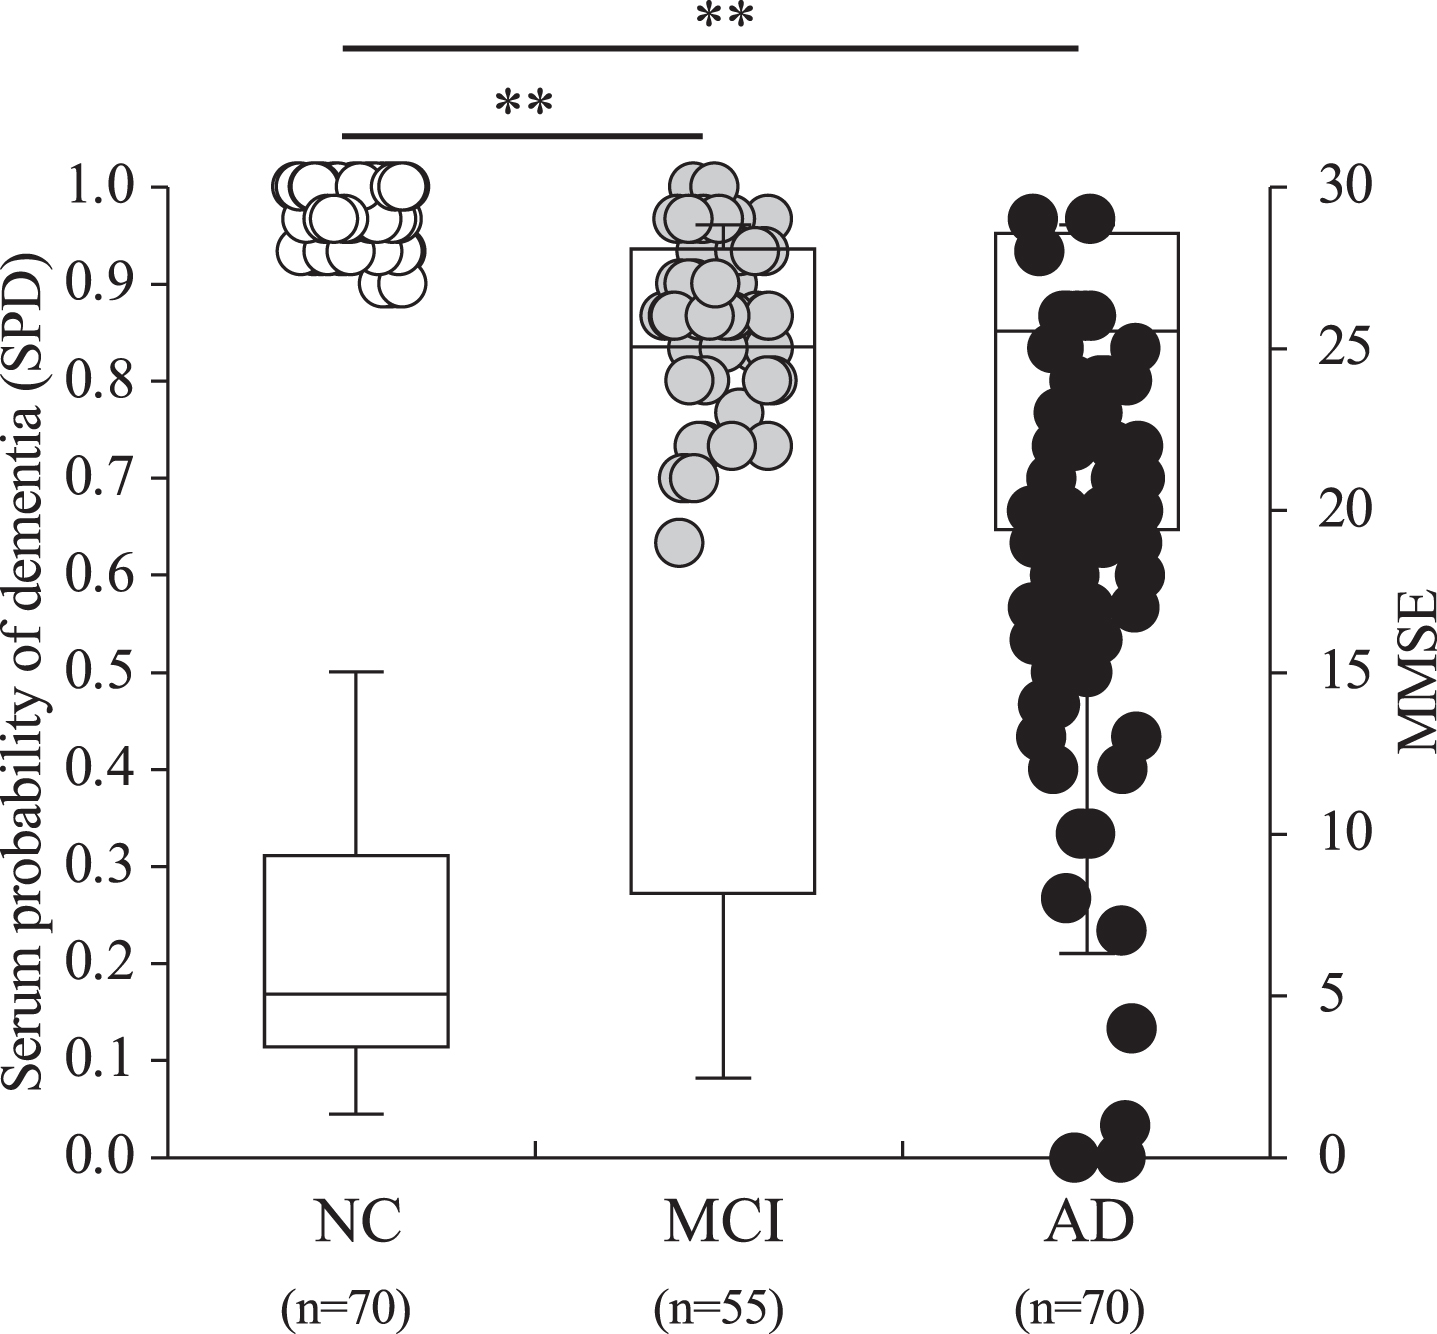
Serum probability of dementia (SPD, boxes) and MMSE (circles) in 70 gender- and aged-matched normal control (NC) subjects, 55 MCI patients, and 70 AD patients. Open, grey and black circles represent NC, MCI, and AD, respectively. Note that there were significant differences between the control and MCI or the control and AD in SPD (**p < 0.01). SPD was low in NC (0.23±0.17) but increased sharply in MCI (0.67±0.35) and AD (0.77±0.28).
DISCUSSION
The present study confirmed that three of the four candidate peptides we previously reported [11] were significantly upregulated during the onset of AD (Table 2). This three-peptide set was not only highly sensitive in determining AD but was also useful to distinguish MCI from normal controls (Table 3, Fig. 3).
In this study, we detected three inflammation-related factors with high sensitivity using a novel technique. Fibrinogen chains, which are one type of blood coagulation factor, become fibrin by the effect of another blood coagulation factor (thrombin), accumulating in the damaged area of blood vessels where it performs its hemostatic function [21]. Fibrinogen chains, which are associated with vascular risk factors, leak into the brain when the blood-brain barrier (BBB) is disrupted, bind to Aβ, form a fibrin clot, and inhibit the degradation of Aβ [22 –25]. Our previous study showed that the interaction of fibrinogen chains with pathogenic Aβ also induced inflammation through microglial activation and coagulation, and complemented activation [26]. In addition, fibrinogen chains are upregulated in the plasma of AD patients and may be a specific biomarker [27 –30]. The expression of complement regulators (PPC1I and C3) is low in the normal brain [31], whereas PPC1I and C3 are significantly upregulated in the brain parenchyma of a mouse model of cerebral hypoperfusion AD [26]. In the pathogenesis of AD, complement regulators play protective roles by inhibiting the formation of amyloid plaques and contributing to the clearance of amyloid [32, 33]. On the other hand, complement regulators enter the brain parenchyma following BBB disruption, and induce inflammation and tissue damage by activating microglia and astrocytes [8, 33]. In this study, we were able to detect AD sensitively in blood using this three-peptide set. This blood-based biomarker has the potential to detect alterations early or even before the onset of AD, and may allow monitoring the course of AD over time. In other words, the Dementia Risk Test may be an excellent tool to identify patients who should receive disease-modifying therapy and reduce the number of patients with severe AD by allowing early intervention, although it needs to be validated with current indicators of AD, including Aβ and tau.
AHSG, also known as Fetuin-A, is an anti-inflammatory protein whose concentration is significantly reduced in the plasma of AD patients [34] and in the brains of AD model mice [35]. In our previous study, an AHSG-derived peptide also showed significantly reduced serum concentrations in AD patients [11]. However, we excluded AHSG from the present Dementia Risk Test because of its lower AUC in the single marker-based discrimination between NC and AD. Additionally, in Akaike’s and Bayesian information of criterion (AIC and BIC, respectively), three peptides-based logistic regression analyses (AIC: 113.4027, BIC: 137.0526) showed lower values than four peptides-based analyses (AIC: 115.3907, BIC: 146.9238), including AHSG, indicating a higher discrimination ability of the former. Therefore, we selected the three-peptide sets.
The present study has some limitations: All the participants in this study were Japanese. In the next study, we would like to investigate this in different races. Secondly, there is no comparison between the calculated values of this three-peptide set and established methods such as amyloid PET. However, good correlations between calculated values using four candidate peptides and amyloid PET were identified in our previous study [11], and similar results may be obtained for the calculated values in the present study. Thirdly, the NINDIS-ADRA criteria are old criteria for AD. Since this study was based on our previous study [11], it was difficult to modify the criteria. We aim to make appropriate modifications in future experiments. Fourth, the training data set to build SPD should have been separated from the validation data set, but the number of samples collected was not large enough to validate them separately, so we would like to validate these separately in a future study.
When collectively observing these findings, we conclude that the Dementia Risk Test may be a powerful tool for detecting AD-related pathological changes. It can also serve as a surrogate marker to evaluate treatment efficacy in AD patients.
AUTHOR CONTRIBUTIONS
Yusuke Fukui (Conceptualization; Data curation; Investigation; Visualization; Writing – original draft; Writing – review & editing); Koh Tadokoro (Data curation; Formal analysis; Investigation); Minaki Hamada (Formal analysis; Methodology; Validation); Kyoichi Asada (Formal analysis; Methodology); Lyang-Ja Lee (Formal analysis; Methodology; Writing – review & editing); Hidehisa Tachiki (Formal analysis; Project administration; Validation); Ryuta Morihara (Data curation; Investigation; Methodology); Koji Abe (Conceptualization; Funding acquisition; Supervision); Toru Yamashita (Conceptualization; Data curation; Funding acquisition; Methodology; Supervision; Writing – original draft; Writing – review & editing).
Footnotes
ACKNOWLEDGMENTS
We thank SciRevision (https://www.scirevision.com/) for editing a draft of this manuscript.
FUNDING
This work was supported by Protosera Inc., JSPS KAKENHI Grant Number JP21K19572, JP22K17799, JP21K15190, and Grants-in-Aid from the Research Committees (Toba K, and Tsuji S) from the Japan Agency for Medical Research and Development.
CONFLICT OF INTEREST
K. Abe and T. Yamashita received a research grant from Protosera Inc. M. Hamada, K. Asada, L. Lee, and H. Tachiki are employees of Protosera Inc.
K. Abe and T. Yamashita are membership as a JAD Associate Editors but were not involved in the peer-review process of this article nor had access to any information regarding its peer-review.
DATA AVAILABILITY
The analytic dataset supporting the findings of this study can be made available upon request to the editor.