
Abstract
Background:
Various virus infections are known to predispose to Alzheimer’s disease (AD), and a linkage between COVID-19 and AD has been established. COVID-19 infection modulates the gene expression of the genes implicated in progression of AD.
Objective:
Determination of molecular patterns and codon usage and context analysis for the genes that are modulated during COVID-19 infection and are implicated in AD was the target of the study.
Methods:
Our study employed a comprehensive array of research methods, including relative synonymous codon usage, Codon adaptation index analysis, Neutrality and parity analysis, Rare codon analyses, and codon context analysis. This meticulous approach was crucial in determining the molecular patterns present in genes up or downregulated during COVID-19 infection.
Results:
G/C ending codons were preferred in upregulated genes while not in downregulated genes, and in both gene sets, longer genes have high expressivity. Similarly, T over A nucleotide was preferred, and selection was the major evolutionary force in shaping codon usage in both gene sets. Apart from stops codons, codons CGU – Arg, AUA – Ile, UUA – Leu, UCG – Ser, GUA – Val, and CGA – Arg in upregulated genes, while CUA – Leu, UCG – Ser, and UUA – Leu in downregulated genes were present below the 0.5%. Glutamine-initiated codon pairs have high residual values in upregulated genes. Identical codon pairs GAG-GAG and GUG-GUG were preferred in both gene sets.
Conclusions:
The shared and unique molecular features in the up- and downregulated gene sets provide insights into the complex interplay between COVID-19 infection and AD. Further studies are required to elucidate the relationship of these molecular patterns with AD pathology.
INTRODUCTION
Alzheimer’s disease (AD) is a disease that changes the quality of life of the patient and their caregivers. There are various theories related to the etiology of AD, including accumulation of amyloid-β (Aβ) in the extracellular spaces of neurons, formation of neurofibrillary tangles of hyperphosphorylated tau proteins, neuroinflammation, and cholinergic neuron damage, etc. 1 Also, a viral connection with AD has been reported. Herpes Simplex type 1 and 2,2,3, 2,3 Epstein–Barr virus,4,5, 4,5 human cytomegalovirus,6,7, 6,7 influenza virus, 8 Ljungan virus, Borna disease virus, 9 and hepatitis C virus 10 have been reported to increase the risk of AD and cognitive decline. 11 Cells of the central nervous system (CNS) are infected, and there have been found a connection between the virus infection and AD.9,12,13, 9,12,13
The pandemic of the coronavirus disease 2019 (COVID-19) has caused over 600,000,000 infections globally thus far. 14 The infection leads to consequences ranging from severe illness and death to long-term neurological trajectories. 15 Neurological consequences include the development of neurodegenerative disorders, including AD and other dementias.16,17, 16,17 Research has exhibited that COVID-19 accelerates structural and functional brain deterioration in dementia patients regardless of dementia type. 18 A meta-analysis encompassing 11 studies, 939,824 post-COVID-19 cases, and 6,765,117 controls demonstrated a significant linkage between COVID-19 infection and new-onset dementia.
The attempts of researchers to link the molecular patterns that appeared after COVID-19 infection and in the AD brain provided evidence that the infection modulates the gene expression profiling of the genes involved in development of AD. 14 Whole transcriptome expression data analysis from COVID-19 versus control and AD versus control frontal cortex patient samples revealed differential expression of genes in both cases. A list of genes has been compiled by Green et al., which are involved in AD and related dementias and their expression modulated during COVID-19 infection. Five genes are activated (upregulated), and nineteen genes have been deactivated (downregulated) during COVID-19 infection, which is implicated in AD. The authors were keen to know the codon usage and other specific molecular patterns in the genes modulated during COVID-19 infection implicated in the progression of AD. The information obtained from the present study will help modulate and fine-tune the expression of these genes so that they might be used for therapeutic purposes against AD progression after COVID-19 infection.
MATERIAL AND METHODS
Sequence retrieval
Upon reviewing the literature, we found several AD and related dementias risk/pathology genes; a few of them are related to the pathology of AD that, during COVID-19 infection, predicted to be activated or deactivated and increased (upregulated) and decreased (downregulated). For this study, predicted activated and deactivated genes were ignored, and CXCL8, GFAP, IL18, IL6R, KLF4, and STAT3 genes, which are upregulated, and BDNF, CAMKK2, CTCFL, CXCL8, EGFR, GFAP, IFI16, IL18IL6R, KLF4, LGALS3, CAV1, FKBP5, IFITM3, C3, C5AR1, PLAT, HSPA8, HSP90AA1, and TAC1, which are downregulated, were considered for the study. All the transcripts were taken, starting with the initiation codon and terminating with stop codons. Predicted transcripts were omitted. A total of 33 transcripts in up and 79 transcripts in down genes were undertaken for the study. Compositional analysis was done for all the genes that included overall % A, % T, % G and % C and % AT and % GC component at third codon positions.
Relative synonymous codon usage analysis
If two or more than two codons encode for the same amino acid, they are called synonymous codons. Synonymous codons are not used equally, and the choice of codon changes according to species, 19 organism, 20 tissue, 21 and cellular level. 22 This uneven usage of codon is called codon bias. 23 One of the indices that indicate this bias is relative synonymous codon usage (RSCU). RSCU values more than 1.6 and below 0.6 are called over and underrepresented, respectively. 24 RSCU values were calculated using CAIcal server. 25
Codon adaptation index analysis (CAI)
CAI is another parameter that indicates bias and exhibits the codon usage frequency in a given transcript. 26 The CAI value has shown a correlation with the gene expression data; 27 hence, CAI is generally used as a surrogate for protein expression. Highly expressed genes exhibit higher CAI values. It is calculated by using the highly expressed genes as a reference gene set. The value ranges between 0 and 1, 28 and values towards 1 show higher expression. 29
Neutrality analysis
The neutrality plot reveals the equilibrium between the selection and mutational forces. 30 Percent GC3 and the average of % GC content at the first and second positions of the codon (% GC12) are determined. % GC3 is plotted on the X axis, while % GC12 is plotted on the Y axis. 31 Each dot represents the transcript. In the regression plot, the value ranges between 0 and 1. The value 1 indicates that codon usage is solely driven by mutational forces, and deviation from 1 shows the part of selection forces. A regression coefficient less than 0.5 is suggestive of the dominance of selection forces. 32
Parity plot analysis
As per parity rule, in the absence of selection or mutational forces, number of G = C and A = T in DNA and C + G + A + T = 1 and at the middle of the plot where both co-ordinates are 0.5, then C = G and A = T and the nucleotide composition follows parity rule. 33 Deviation from the above status is suggestive of presence of mutation, selection or both mutation and selection forces. It is distribution of experimental versus predicted values. 34 AT or GC bias at third codon position is determined by parity plot analysis. The AT bias [A3/(A3 + T3)] and GC bias [G3/(G3 + C3)] were calculated for parity analysis. 35 If the value of bias is low than 0.5, it indicates the pyrimidine preference over purine. 36
Rare codon analyses
Rare codons are those present in lower frequencies. 37 The presence of rare codons not only helps transiently pausing ribosomes on mRNA but also helps fold proteins properly. 38 These codons also help enhance protein solubility. 39 The frequency of codons was obtained, and the codons having a threshold below 5/1000, which means less than 0.5%, were considered rare codons.
Residual table formation for codon context
The tendency of codons to prefer or reject to be in pairs is called codon context. Higher residual values prefer to be in pairs, while the opposite is true for highly negative values. Using ANACONDA V2.0 software, 40 all the transcripts were scanned, initiated with the first six, and then, in each step, three nucleotides were scanned. The frequency of all hexanucleotides was computed. The matrix plot was generated for up and downregulated gene transcripts based on residual values. Considering the set of up and downregulated gene transcripts as genomes, a differential display map was generated, and the difference was shown on the color map. 40 For differential display maps, residual values below 20 were considered as no significant difference in codon context in up and downregulated genes. Residual values between 20–100 were considered significant differences and above 200 were considered very significant. Different matrixes, including xNN-Nxx and dinucleotides at the p3-p1 (third position of first codon and first position of second codon) junction, were calculated using ANACONDA V2 software. Four context clusters based on the p3-p1 position were calculated that are XXU-AYY, XXC-AYY, XXU-GYY. Dinucleotide context is related to DNA repair and replication constraints. 41 Sixteen dinucleotide frequencies at the codon junction of codon pair (xxA-Axx, xxC-Axx, xxG-Axx, xxU-Axx, xxA-Cxx, xxC-Cxx, xxG-Cxx, xxU-Cxx, xxA-Gxx, xxC-Gxx, xxG-Gxx, xxU-Gxx, xxA-Uxx, xxC-Uxx, xxG-Uxx, xxU-Uxx) were calculated.
RESULTS
RSCU analysis revealed a high preference for G/C ending codons in upregulated genes, while no such trend was evident in downregulated genes
Compositional analysis was done for up- and downregulated genes. % A3, % T3, % G3, % C3, % AT3, and % GC3 were 16.95%, 19.31%, 34.91%, 28.81%, 26.61%, and 49.3%, respectively. For downregulated gene, it was 21.65%, 24.74%, 28.87%, 24.74%, 34.02%, and 41.24%, respectively. Composition at third codon position has influence of RSCU values. RSCU analysis is done to determine the high and low preferred codons. 42 Overall trend analysis revealed that G/C ending codons were preferred in upregulated gene transcripts, while the same is not valid for downregulated genes. GTG and CTG were the codons preferred in most transcripts in both transcript sets. Considering average RSCU values obtained from RSCU values of all up transcripts, G/C ending codons CGG, TCC, AGC, and ATC were overrepresented, while none of the A/T ending codons was overrepresented. On the other hand, A/T(U) ending codons TTA (UUA), CGA, CAA, CTA (CUA), ATA (AUA), GTA (GUA), GGT (GGU), CGT (CGU), and GTT (GUU) were underrepresented. Among G/C ending codons, CGC, TCG, GCG, ACG, and CCG were underrepresented. AGA codon was overrepresented in downregulated genes, while TTA (UUA), CGA, CAA, CTA (CUA), ATA (AUA), GTA (GUA), GGT (GGU), CGT (CGU), CTT (CUU), TCG (UCG), GCG, ACG, and CCG were underrepresented codons. In a summary, CTG (CUG) and GTG (GUG) were the codons overrepresented in both gene sets, similar to the results found by Khandia et al. (2022), 43 while the codons with dinucleotide CpG or TpA (UpA) as an integral part were underrepresented. Table 1 shows average RSCU value of different genes, and overrepresented codons have been highlighted. The heat map is shown in Fig. 1A for up- and Fig. 1B for downregulated genes.

Data matrix for visualizing values in the cells using a color gradient for upregulated genes. Heatmap is plotted using heatmap R package (version 0.7.7) and for clustering dist and hclust functions in R have been used.

Data matrix for visualizing values in the cells using a color gradient. Heatmap is plotted using heatmap R package (version 0.7.7) and for clustering dist and hclust functions in R have been used.
Average RSCU values of up- and downregulated gene transcripts
With the increasing length the gene expression also is increased in both gene sets
The average length was 1691.56±641.31 and 1460.57944±816.70 while the average CAI was 0.787±0.02 and 0.777±0.03 for up and down genes, respectively. We did a correlation analysis between CAI and lengths of the genes, and we found a positive and significant correlation between CAI and lengths, the results indicated that with an increase in length, the level of gene expression also increased. Pearson correlation coefficient was r = 0.392 with p < 0.05 and r = 0.198, p < 0.05 for up and down genes, respectively.
Selective forces are dominant in both the genes
A neutrality plot signifies the equilibrium between the mutation and selection forces, two dominant forces shaping codon usage. A neutrality plot between % GC3 and % GC12 has been plotted. If there is a correlation between % GC3 and % GC12, it indicates the likeliness of the presence of mutational forces since the forces acting in determining codon usage are acting on all the codon positions.44,45, 44,45 We found a correlation between % GC12 and % GC3 in the up and downregulated gene sets. Pearson correlation coefficient was r = 0.810, <0.0001 and r = 0.681, p < 0.0001 for up- and downregulated genes respectively. Significant correlations between % GC3 and % GC12 indicated the presence of mutation force; 46 however, it was not dominant since the regression coefficient was 47.92 and 28.49 for up- and downregulated genes, respectively. It indicated that the mutational forces were 47.92% while selection forces were 52.08% for upregulated genes (Fig. 2A). It was 28.49% and 71.51% for selection and mutational forces for downregulated genes (Fig. 2B), respectively. In both cases, the selection force is dominant in shaping codon bias.
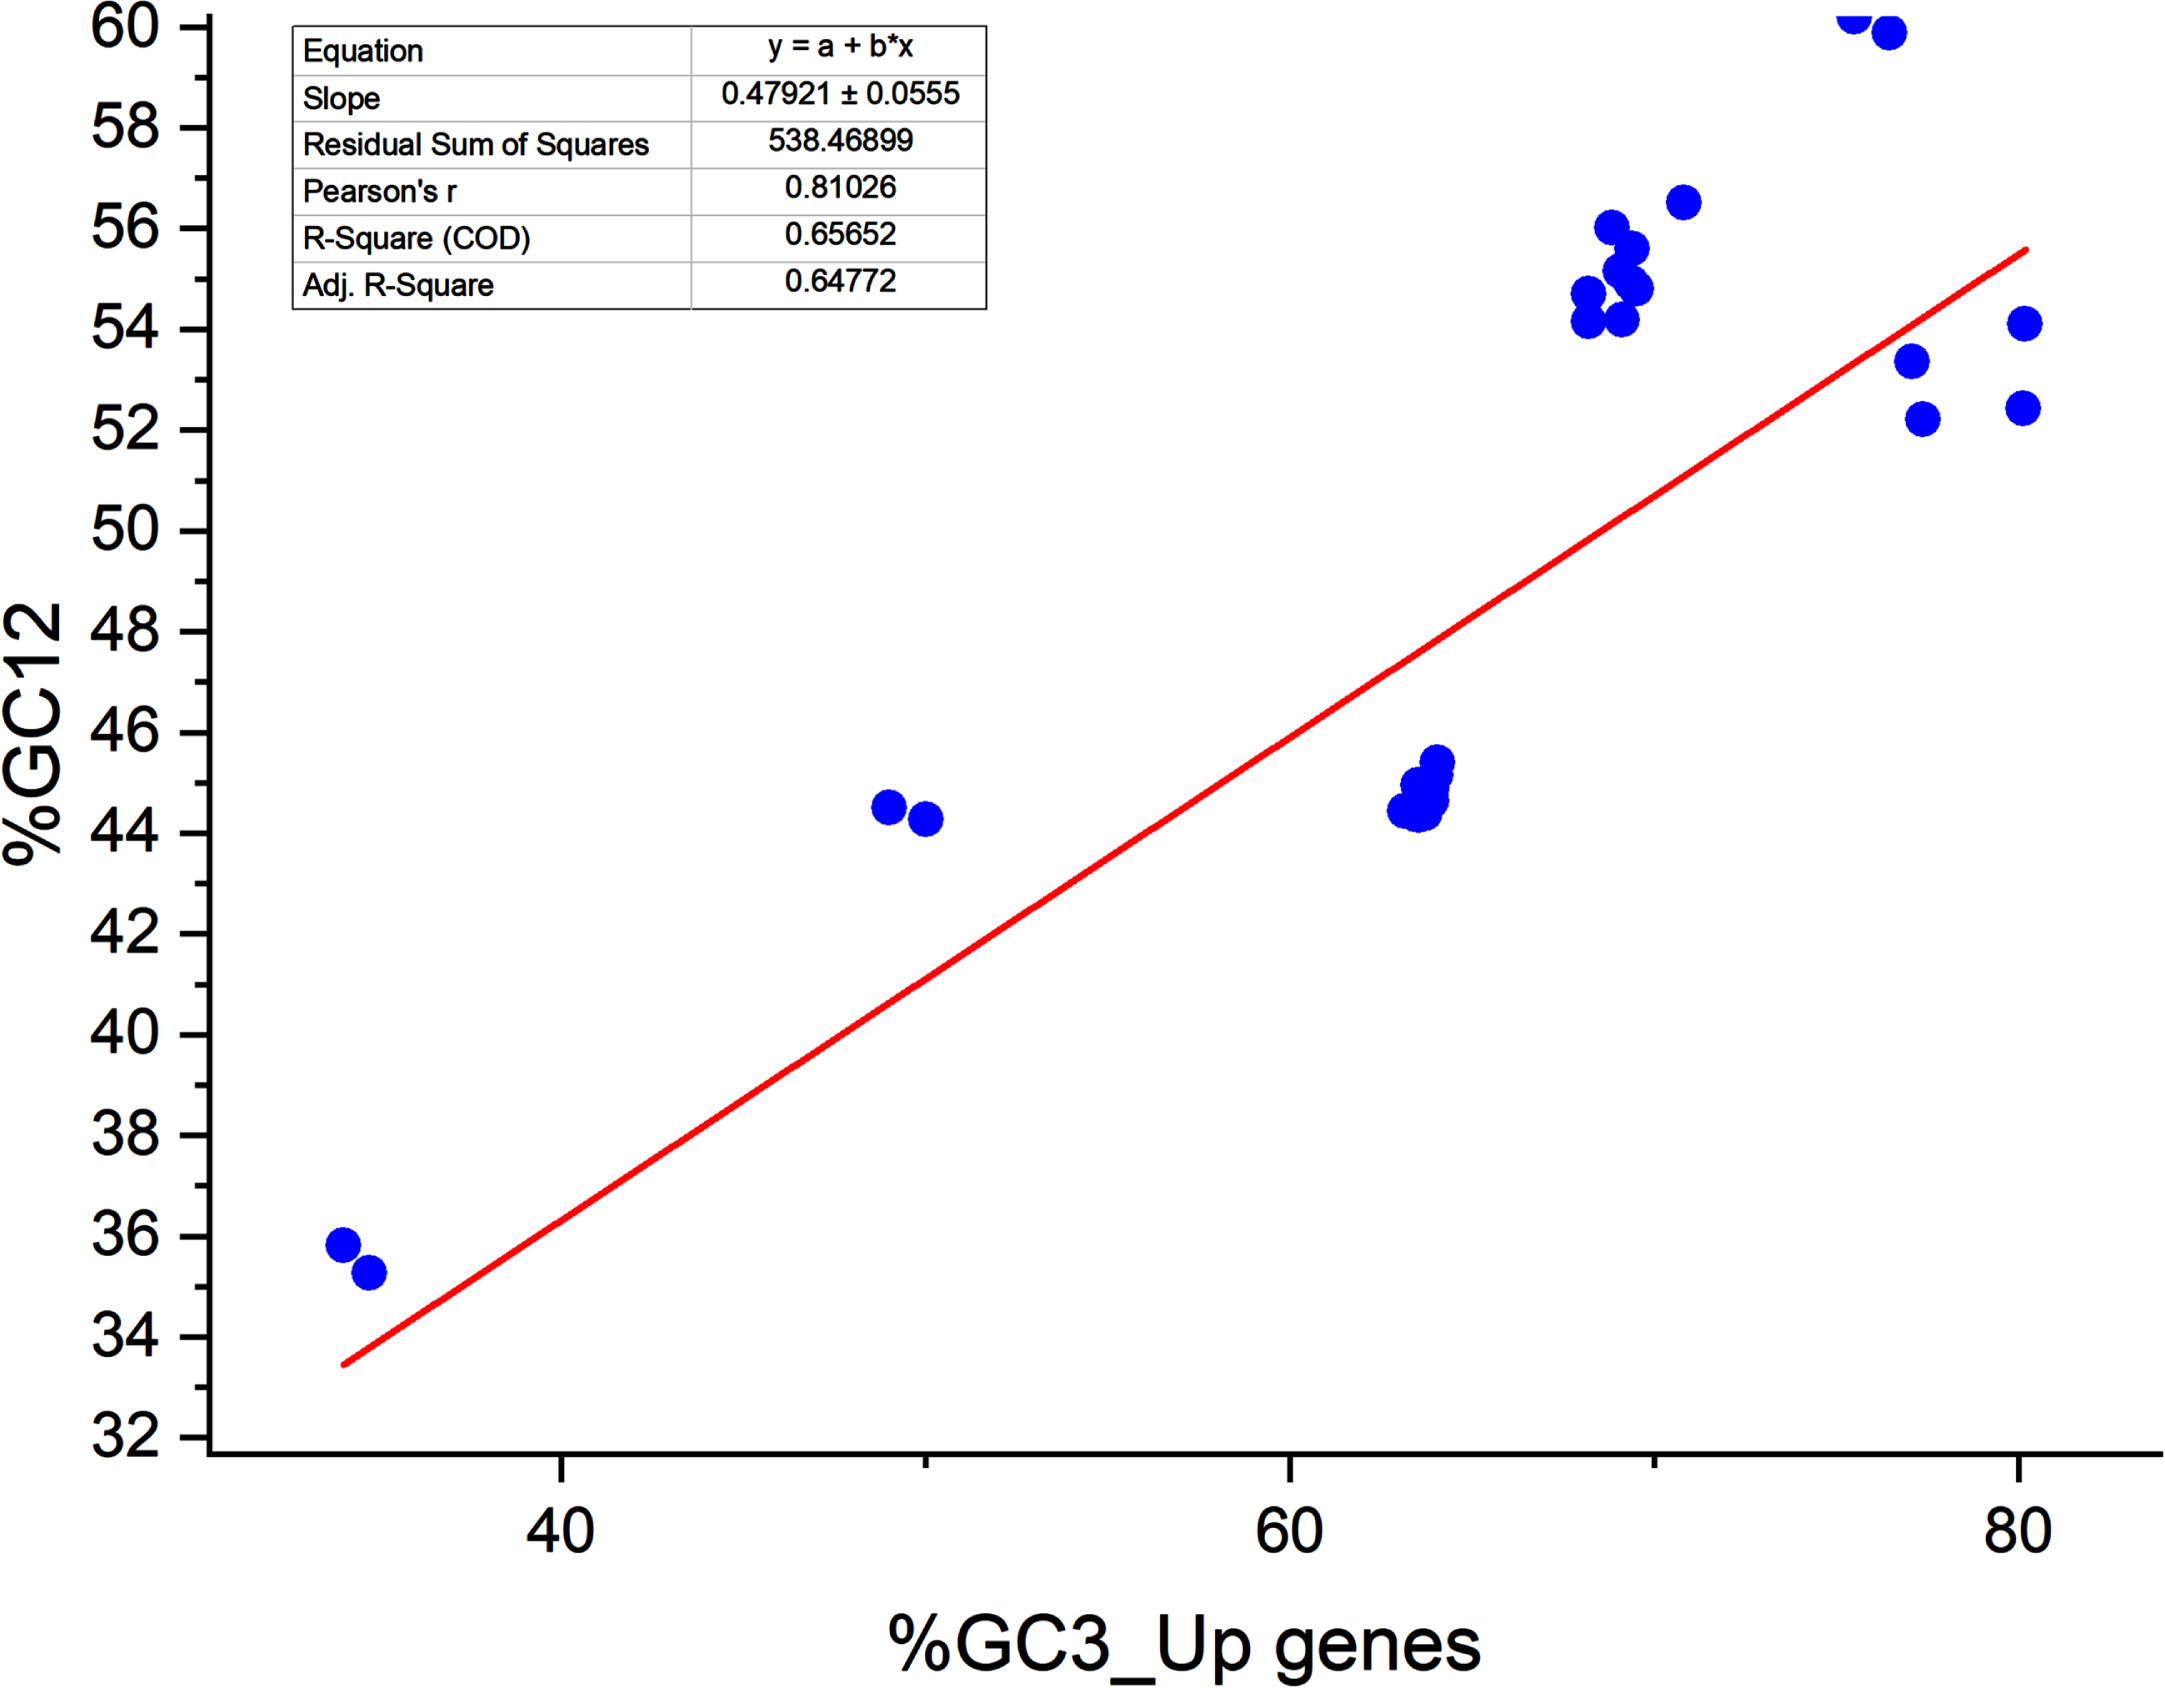
Neutrality plot analysis for upregulated genes (Neutrality analysis was done using PAST4 software. 47
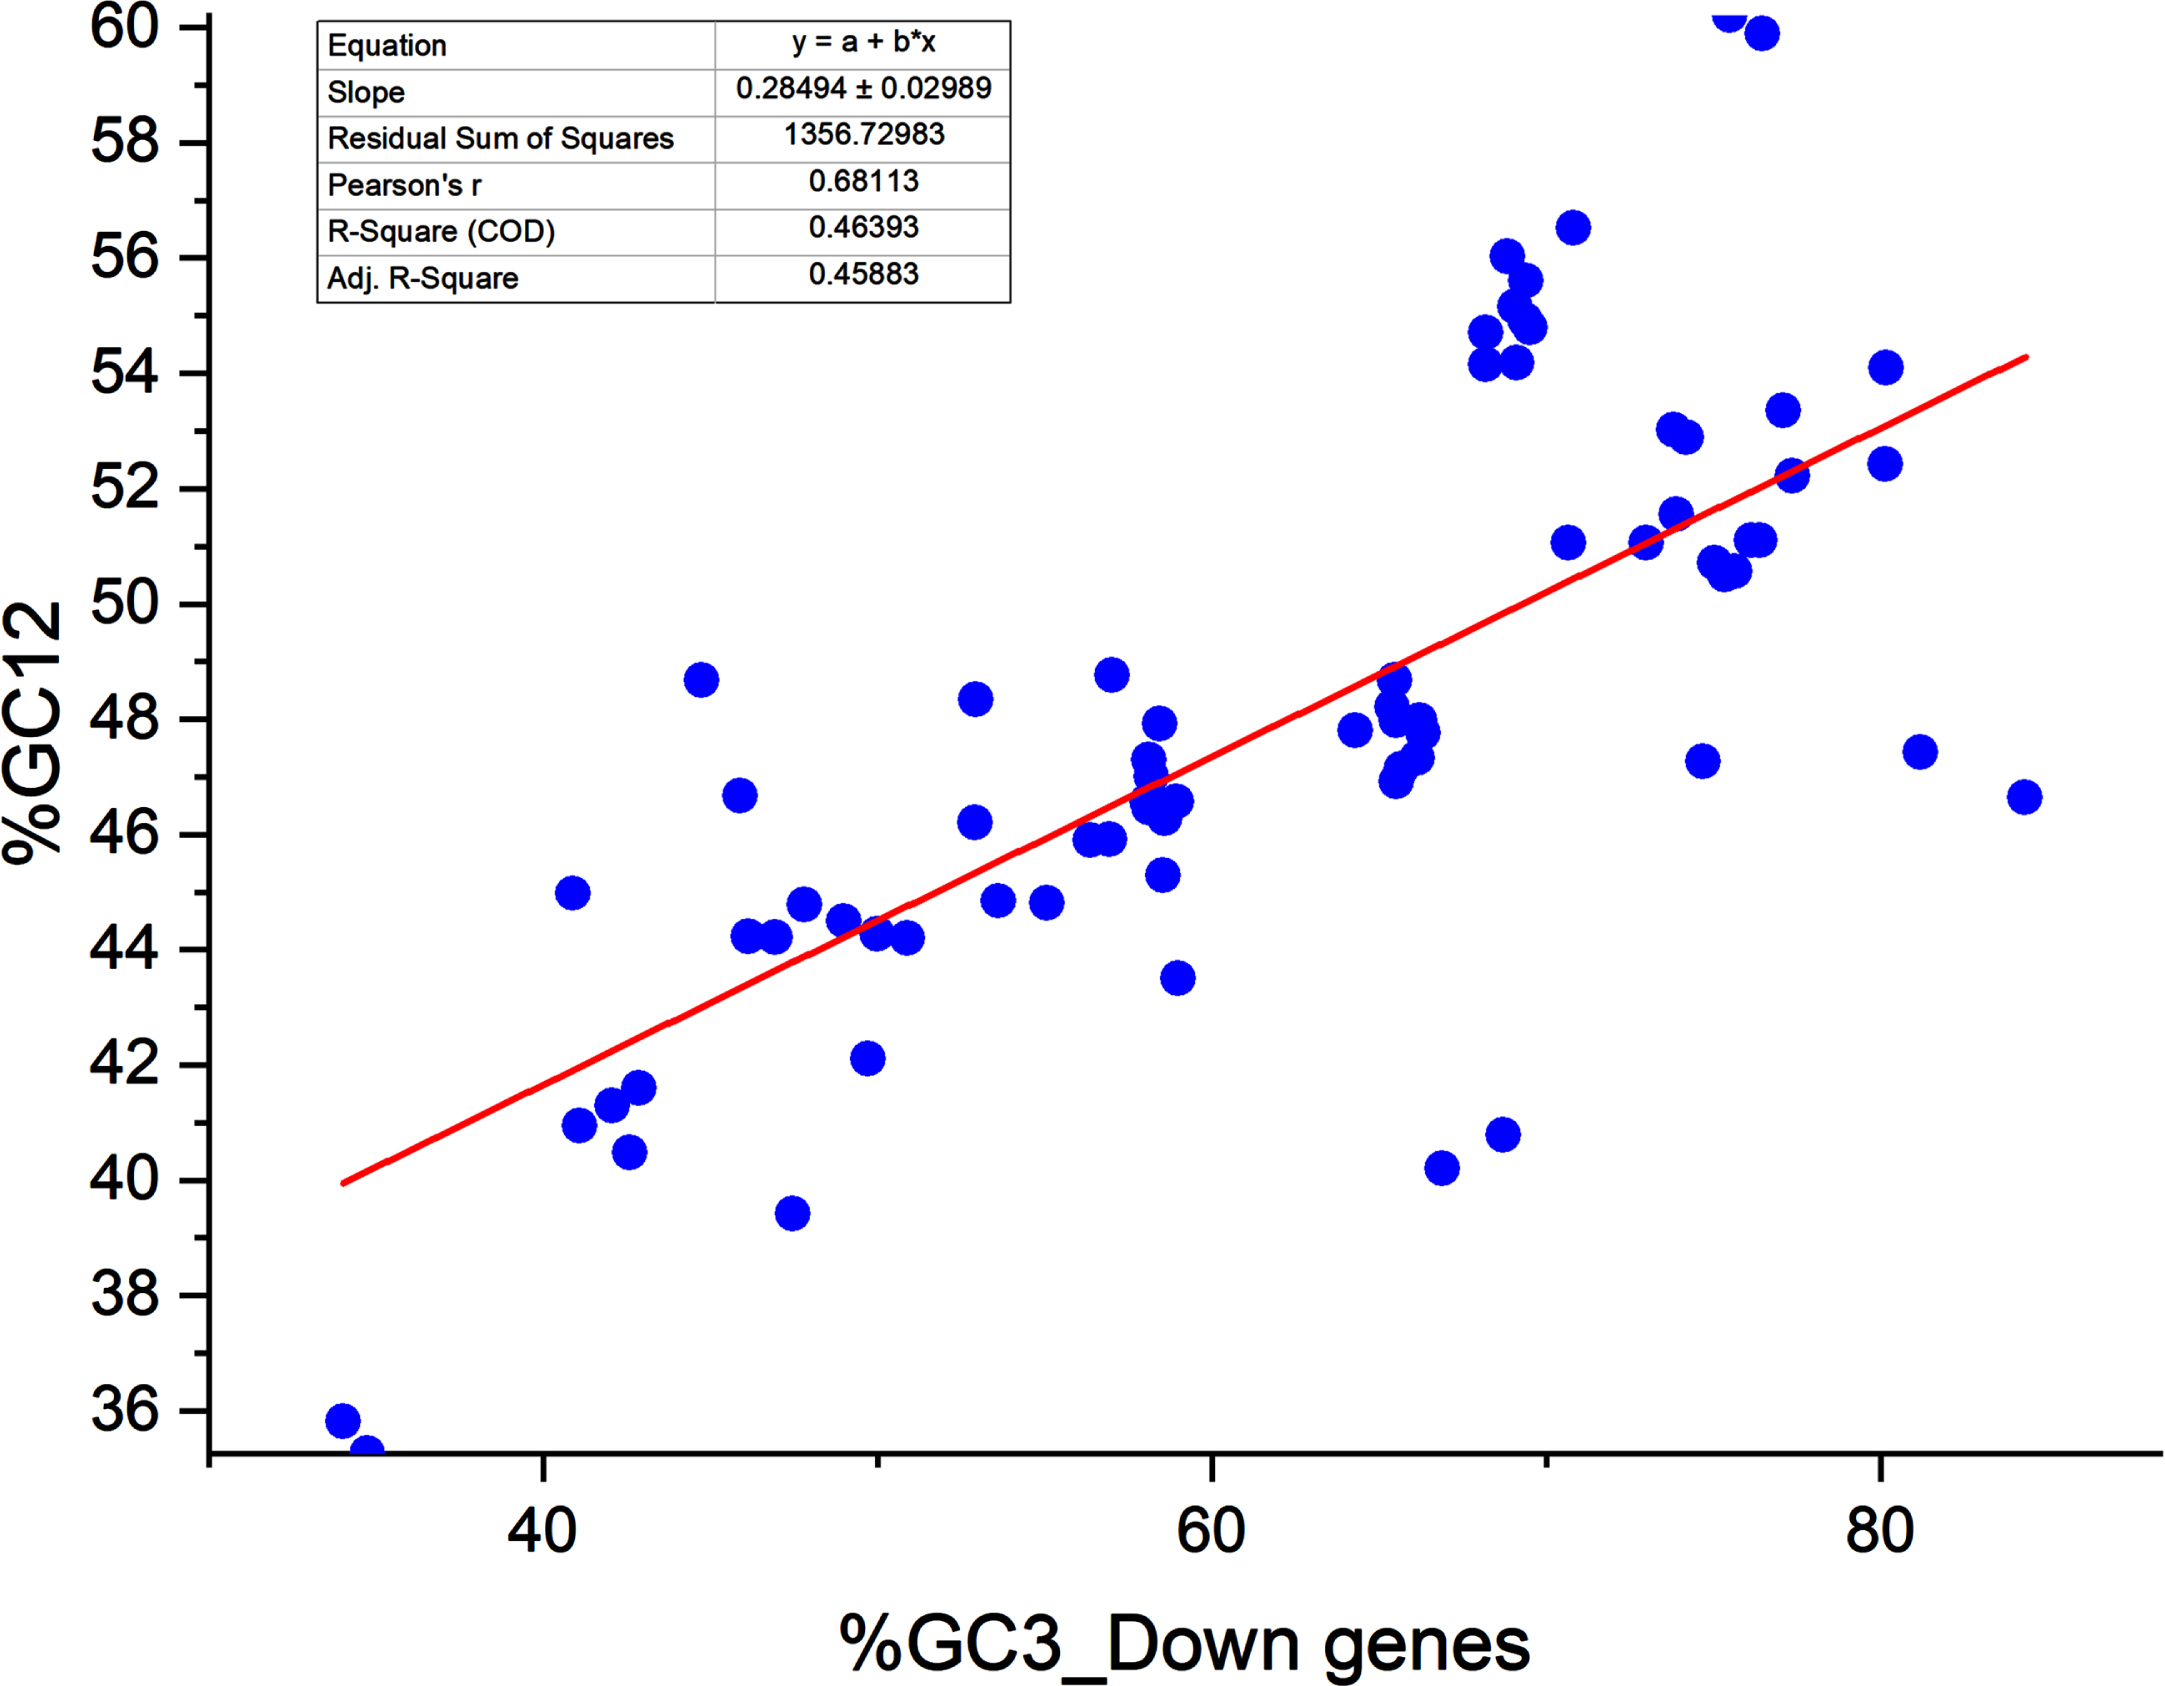
Neutrality plot analysis for downregulated genes.
Parity plot revealed preference of T (U) over A nucleotide at third codon position in both up and down gene transcripts
Parity plot analysis indicates the bias between A and T (U) and C and G at the third codon position. The average GC bias value was 0.528±0.03 and 0.477±0.04 for up- and downregulated genes, respectively. The averages AT (AU) bias values were 0.46±0.01 and 0.487±0.06 for up- and downregulated genes (Fig. 3). The results of GC bias suggested that for upregulated genes, G is preferred over C; contrarily, in downregulated genes, C is preferred over G at the third codon position. For the AT bias, T (U) is preferred over A at the third codon position in both the up- and downregulated genes.
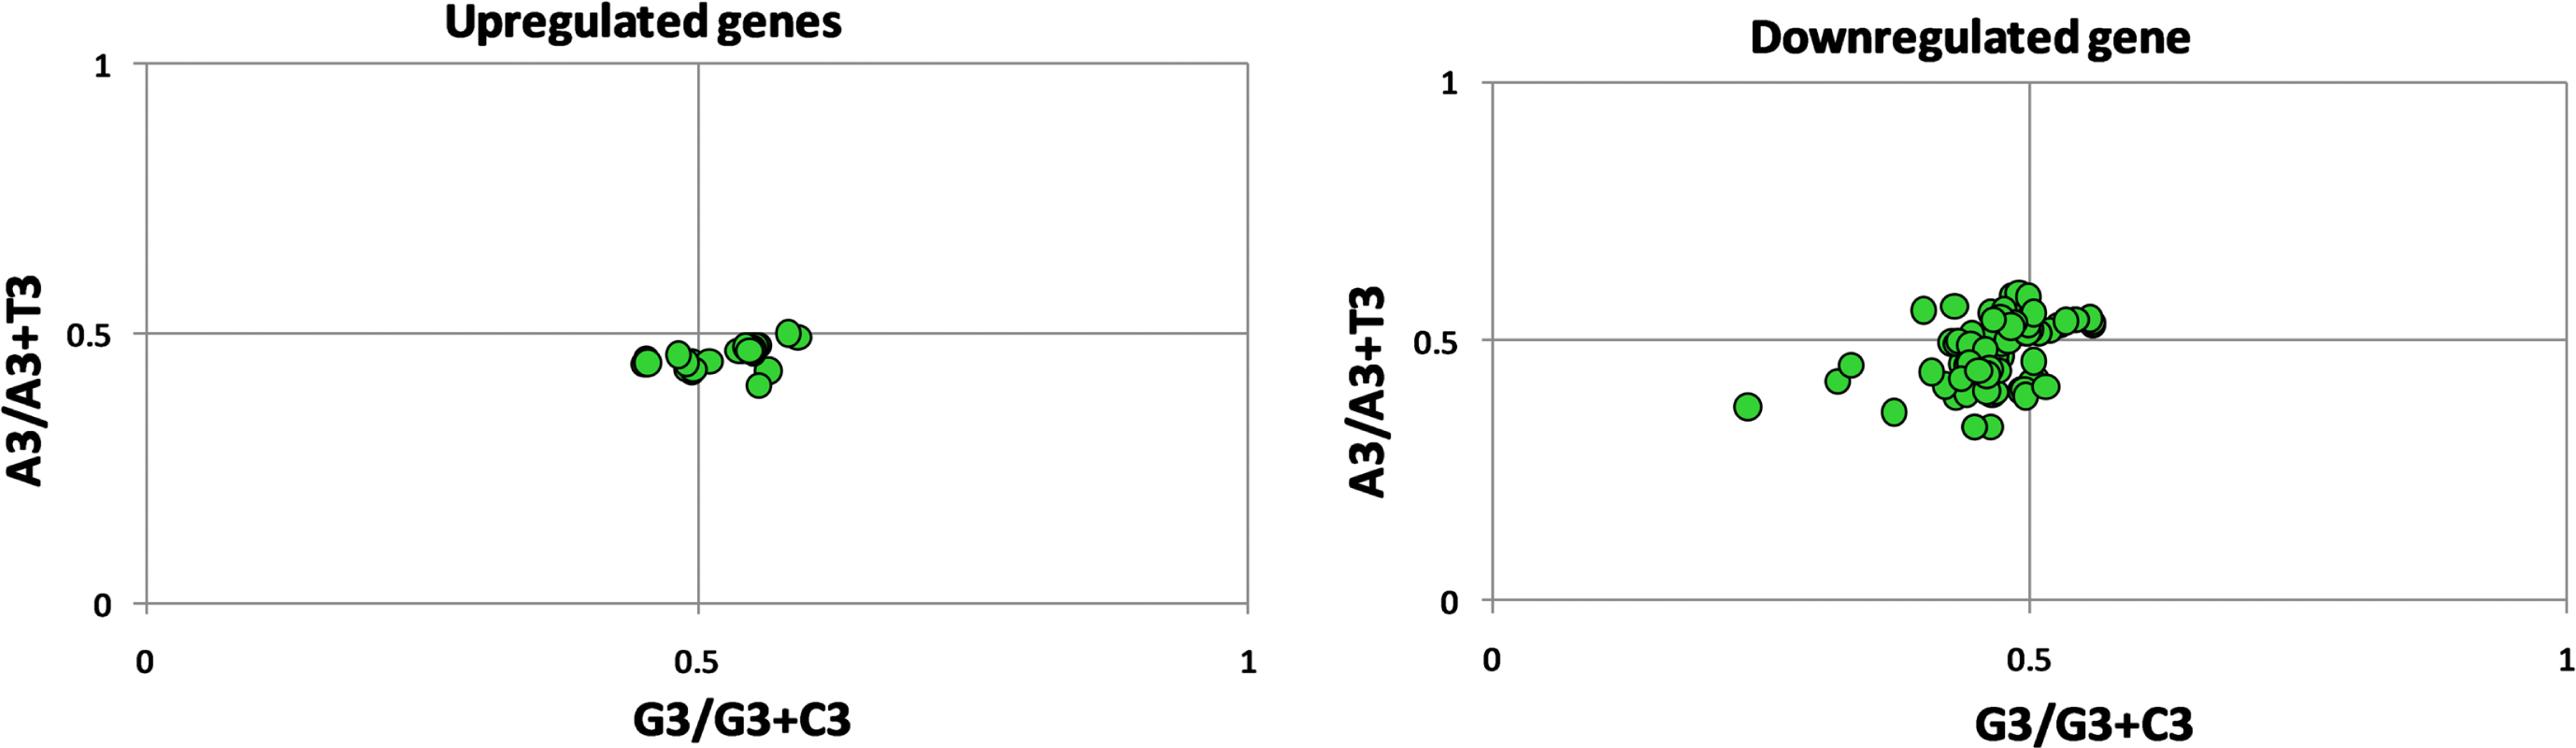
Parity plot analysis for up- and downregulated genes.
Rare codon analysis
Apart stops codons, codons CGU – Arg, AUA – Ile, UUA – Leu, UCG – Ser, GUA – Val, CGA – Arg in upregulated genes while CUA – Leu, UCG – Ser, and UUA – Leu in downregulated genes were present below the threshold value 5/1000, which was set as a default value, indicating that these codons were present less than 0.5% in the studied transcripts (Fig. 4).
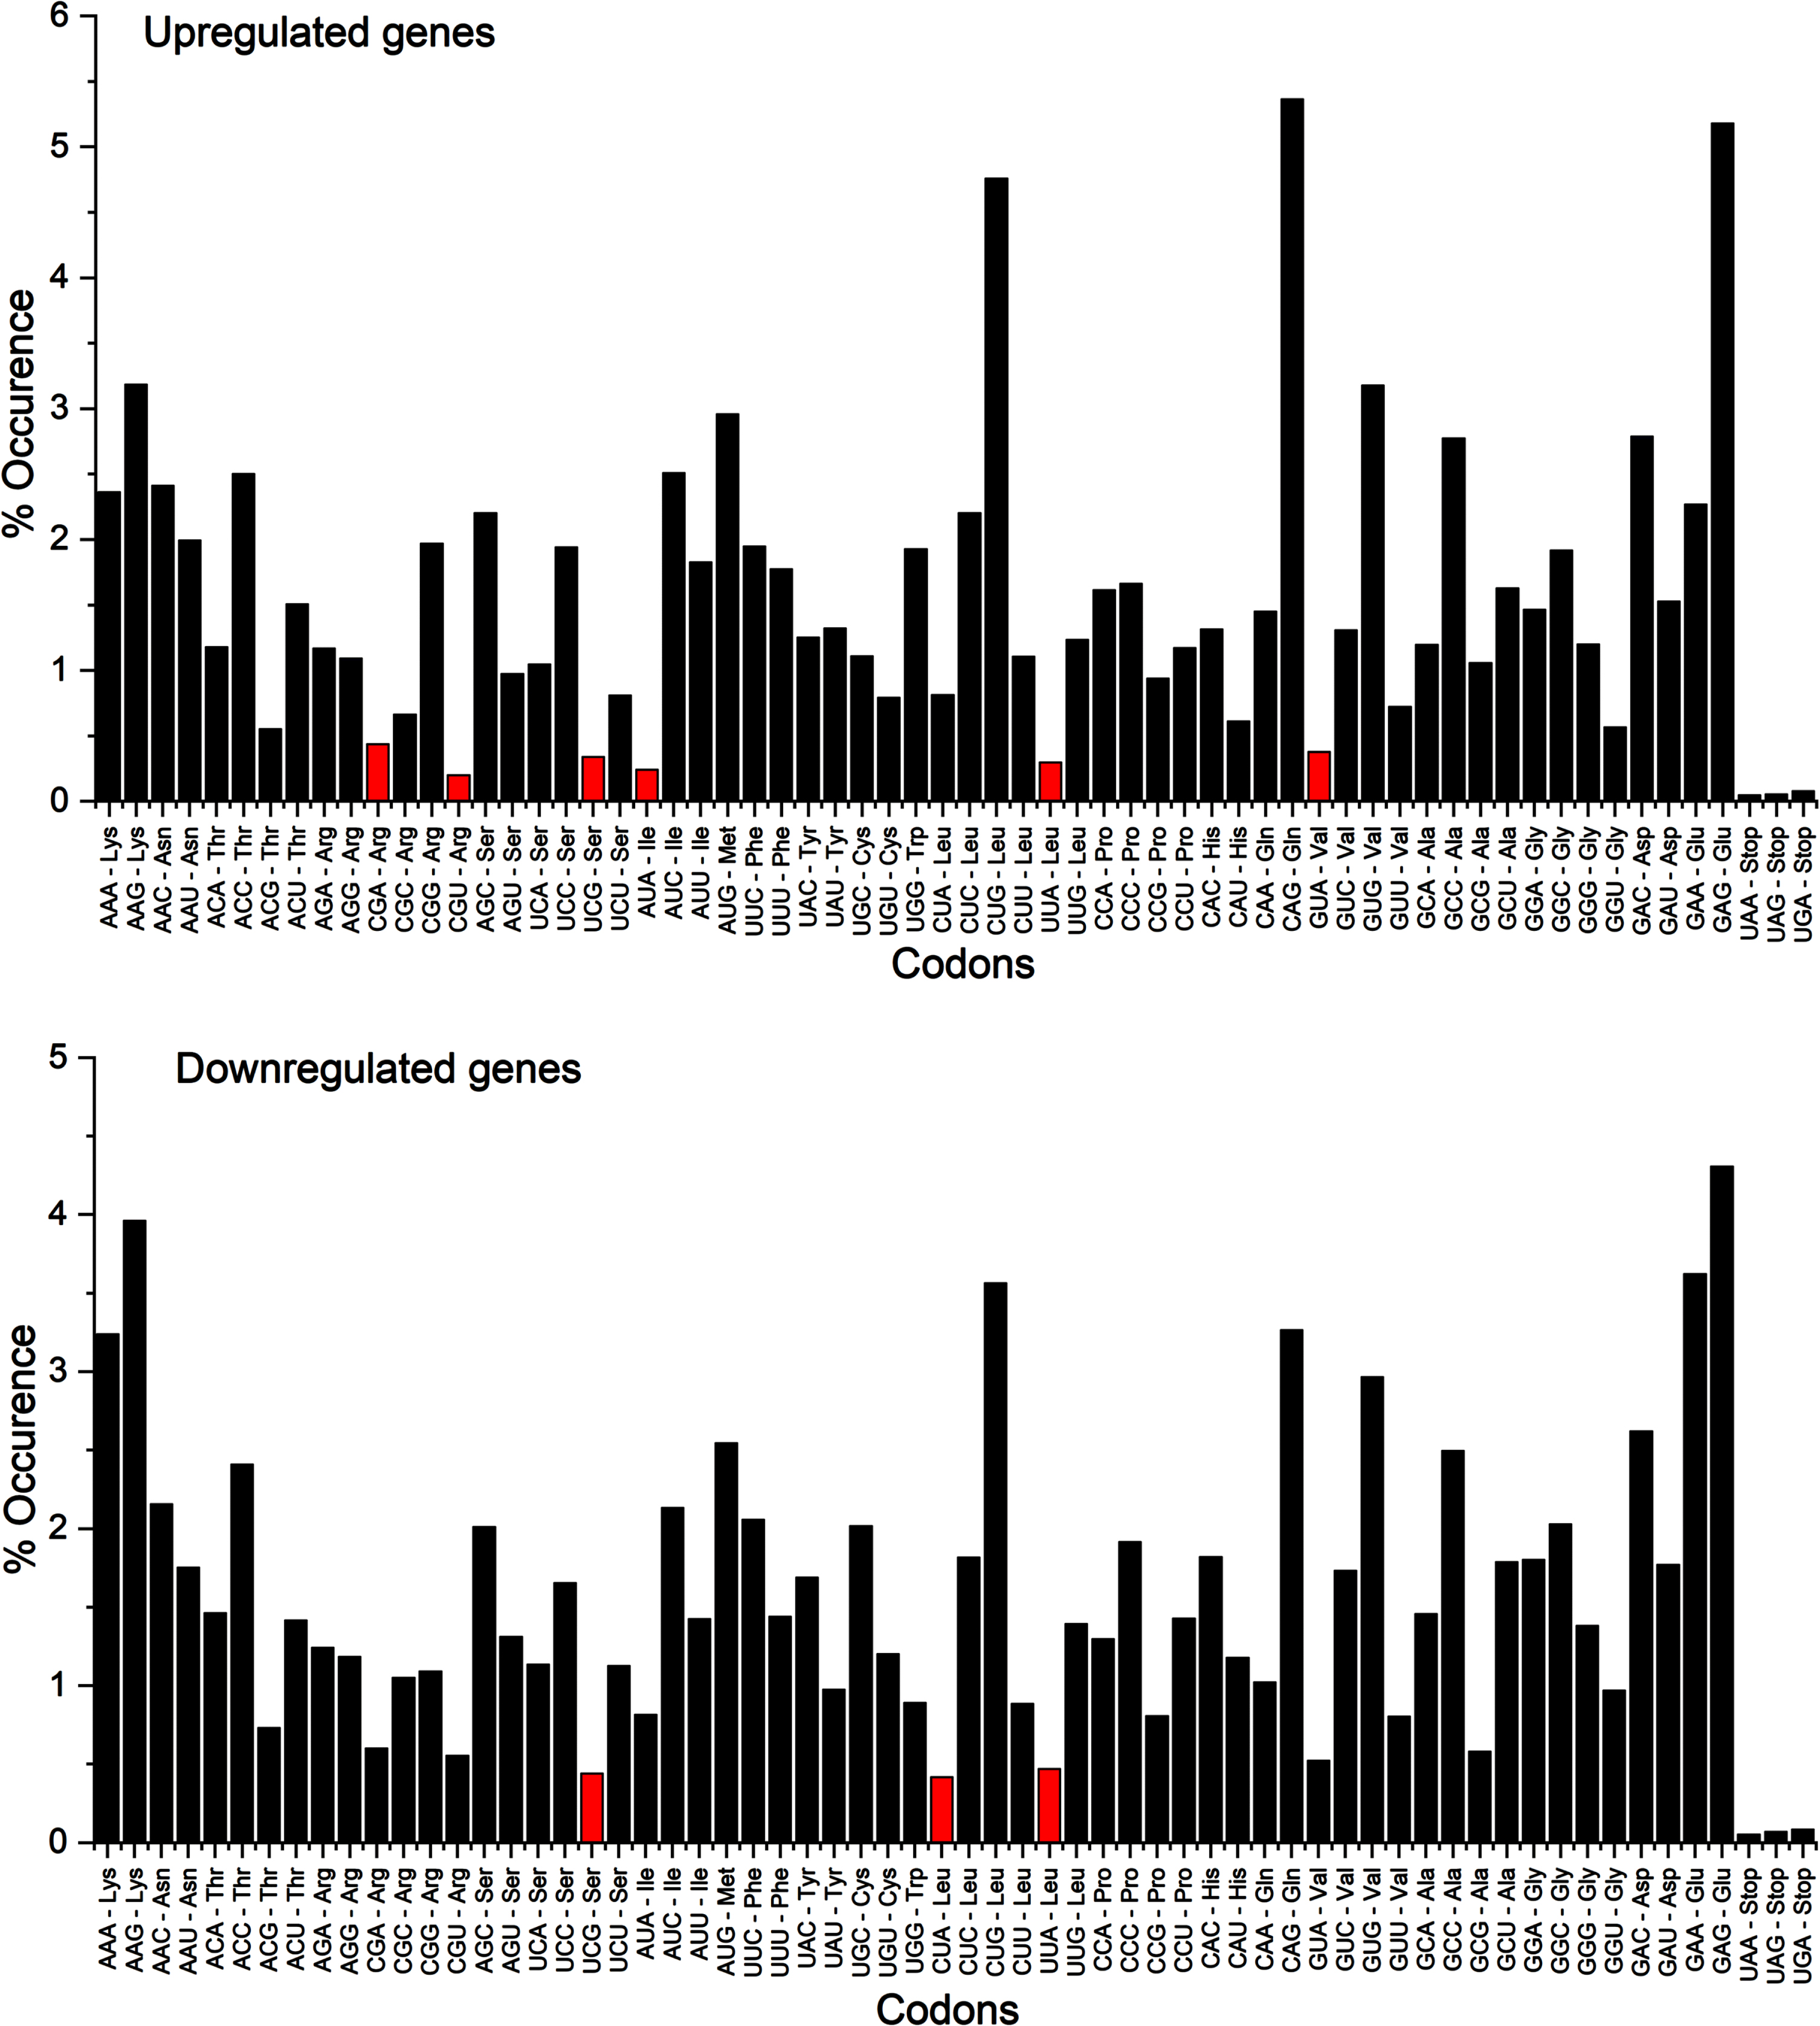
Rare codon analysis for up- and downregulated genes. Apart stop codons, six codons in up- and three codons in downregulated genes were present below the threshold value 5/1000.
Glutamine initiated codon pairs have high residual values in upregulated genes
To identify the strongest and weakest codon context bias in up- and downregulated genes, the highest and lowest residual values were obtained. In upregulated genes, a higher bias was present since it ranged between 426 and –844. Similarly in the downregulated genes it ranged between 246 to –508; however, the bias is lower than present in upregulated gene. Interestingly, in upregulated genes, five out of ten codon pairs were initiated with glutamine (Table 2). Codon contexts for up and downregulated genes have been depicted as Figs. 5 and 6, respectively.
Highest and lowest residual values
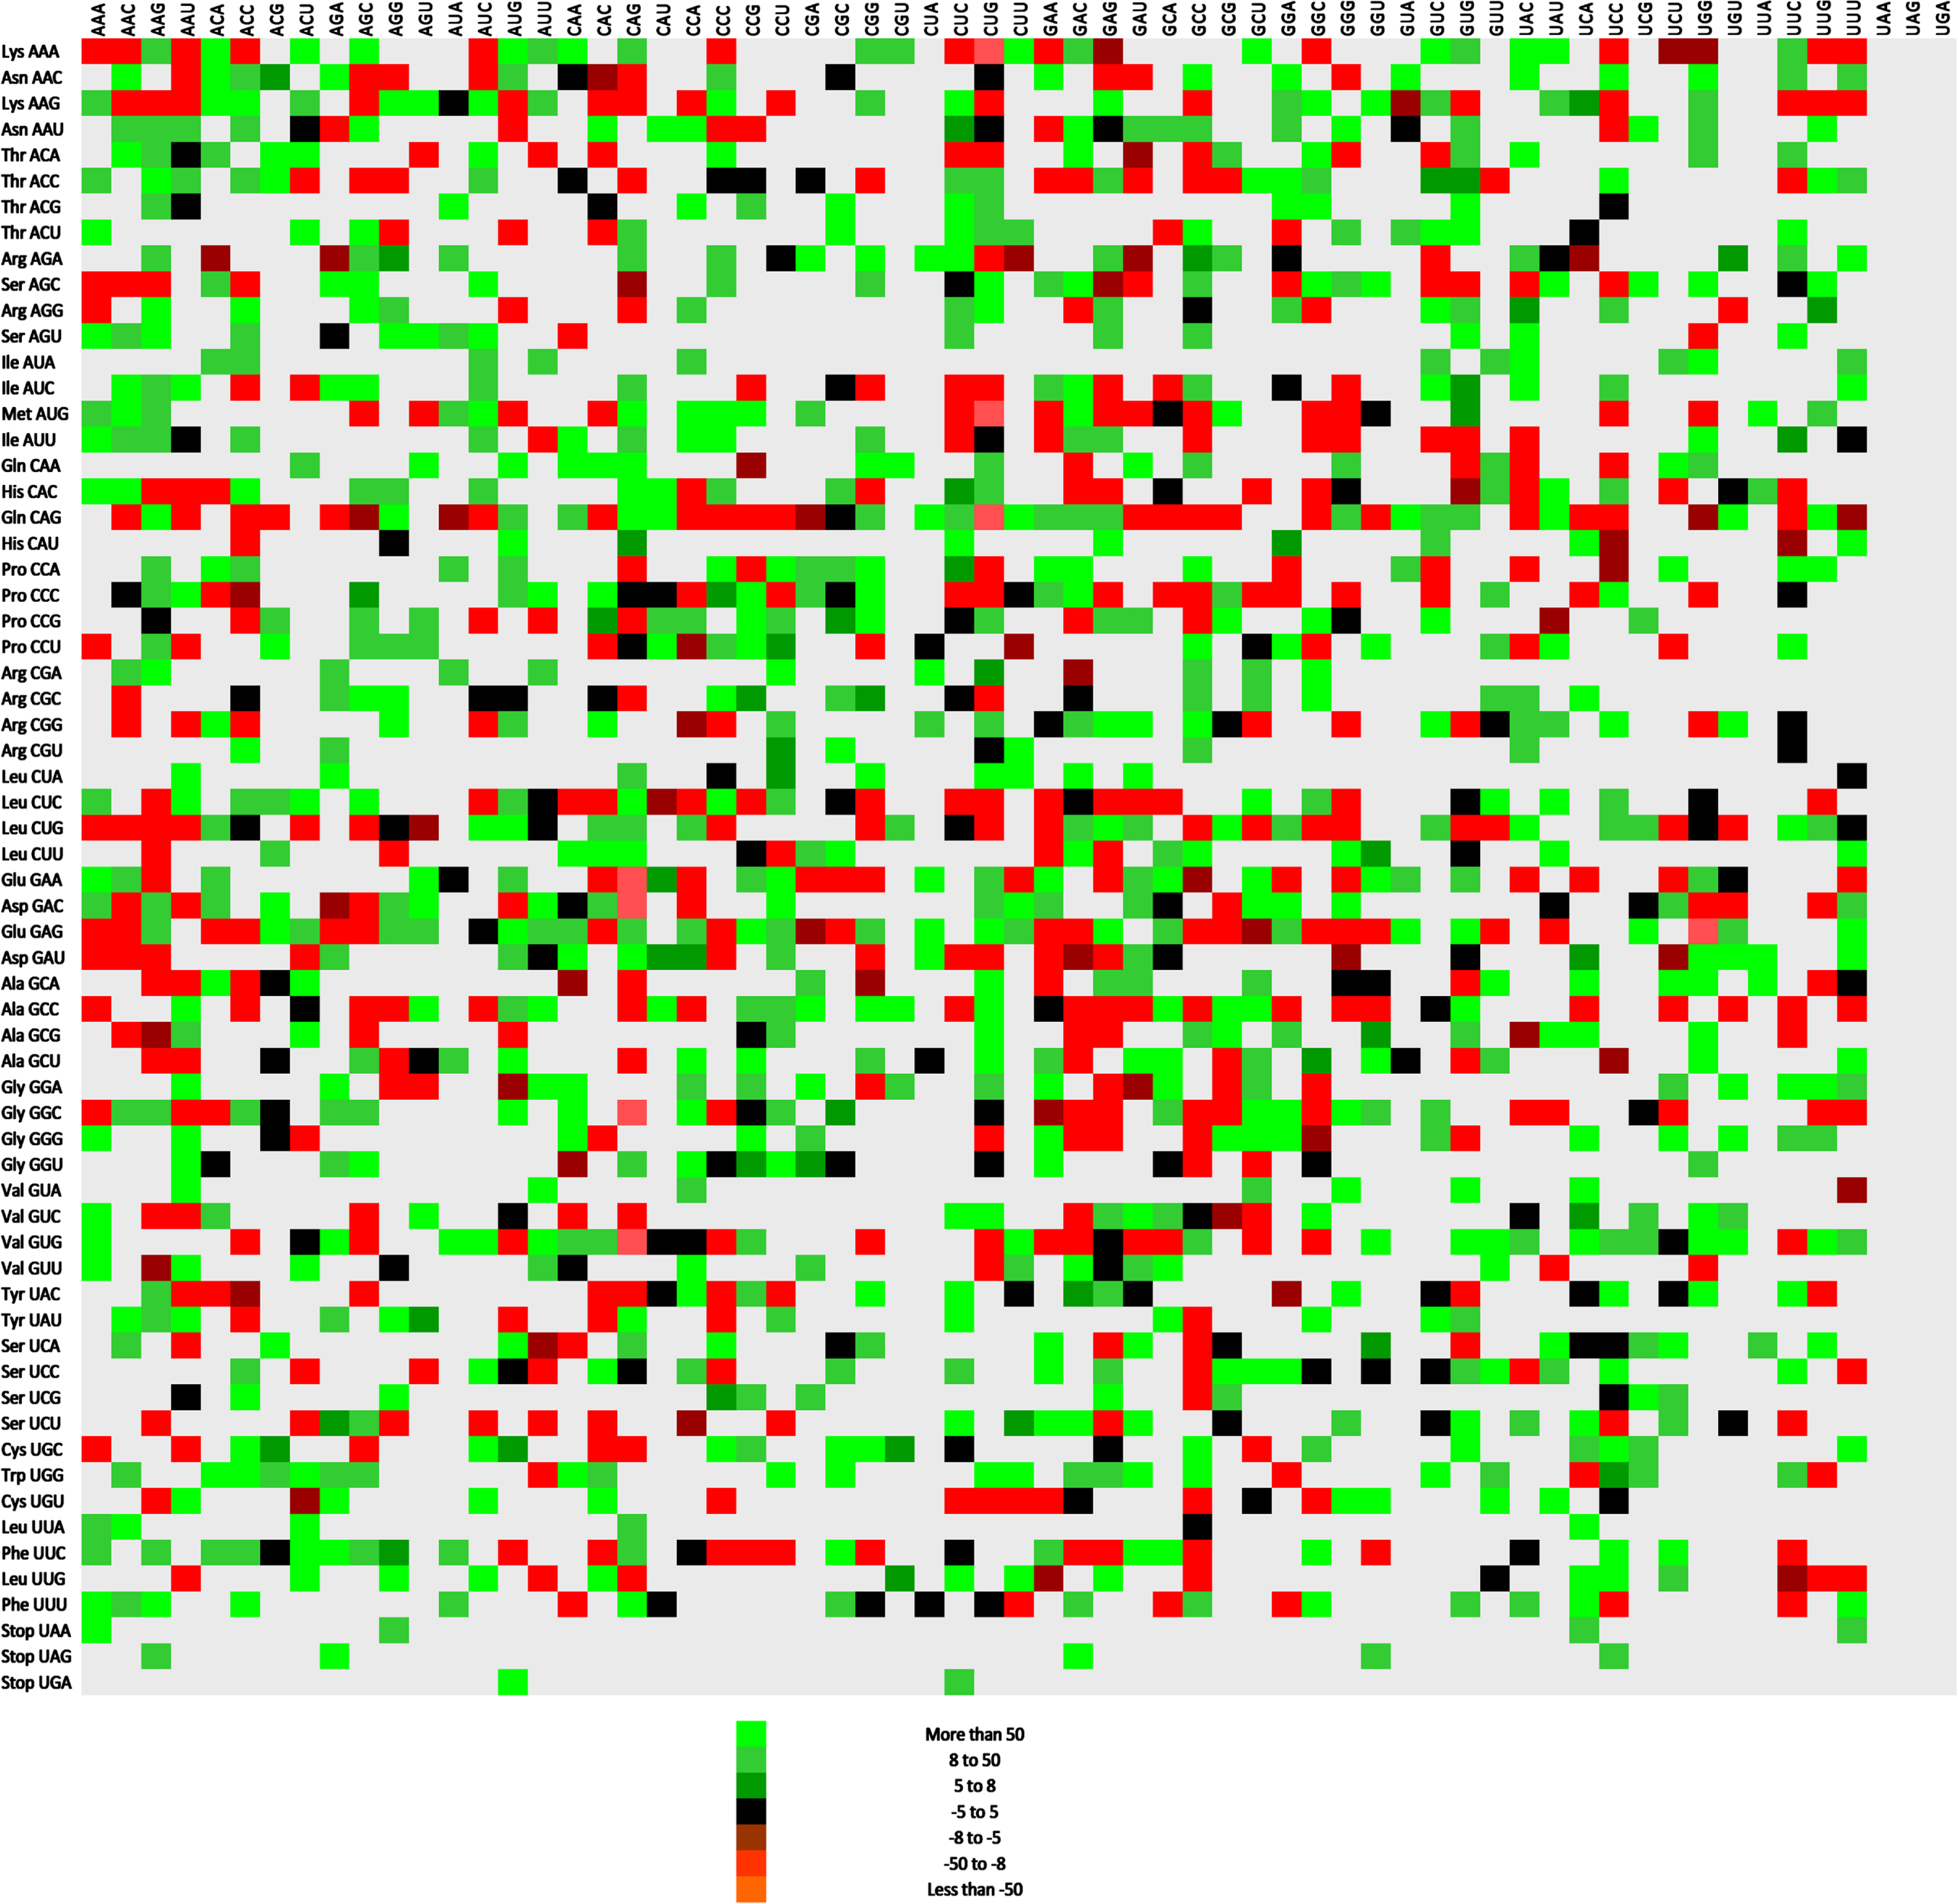
Codon context in upregulated genes during COVID-19 infection that contributes to Alzheimer’s disease. Green, red, and grey colors indicate high, low, and null occurrences of codon pairs appearing here.

Codon context in downregulated genes during COVID-19 infection that contributes to Alzheimer’s disease. Green, red, and grey colors indicate high, low, and null occurrences of codon pairs appearing here.
In another approach the codon context maps of the up- and downregulated genes were compared and called differential display maps. A color scale was formed. Common features have been displayed as black, while significant differences were indicated as blue. Very high codon context changes were displayed as pink. ACG-AUA, CAA-CGU, CCU-CAU, GAC-AUU, and GCA-UUA codon pairs exhibited the maximum difference in context (Fig. 7).
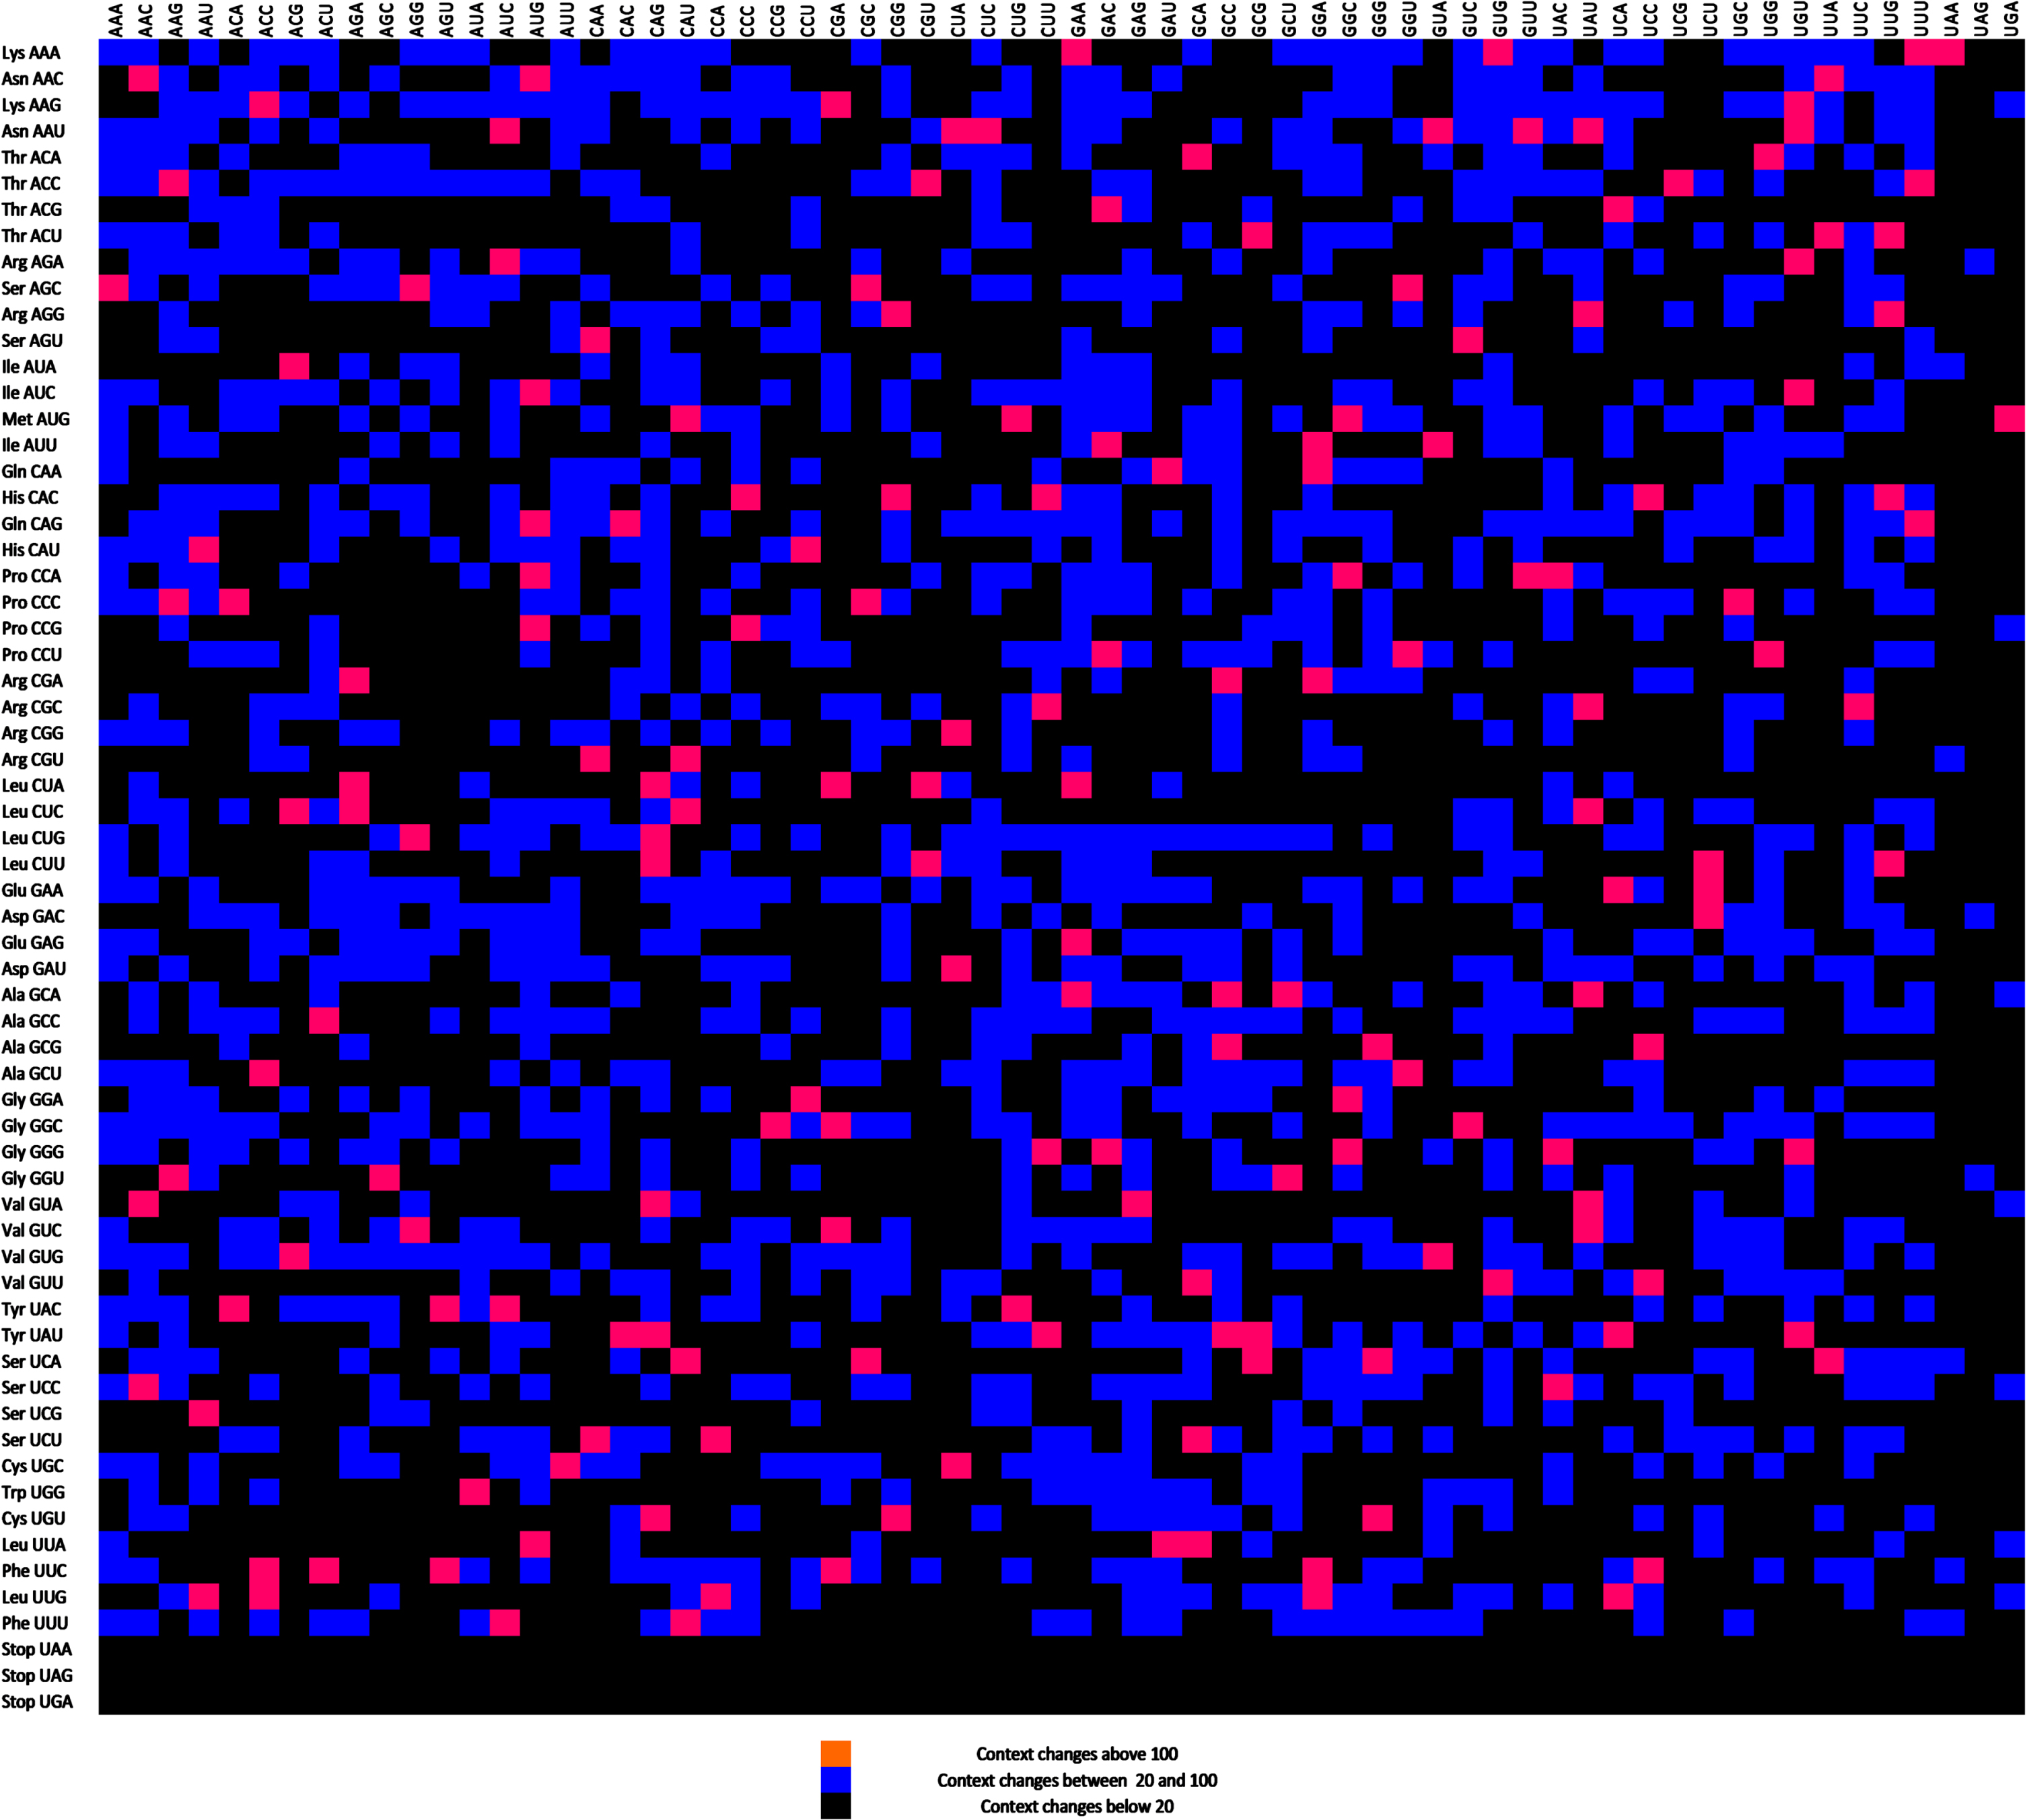
A differential display map for up- and downregulated genes. Black presents similar residual values, while blue represents a medium difference. Pink boxes represent the highest residual value differences.
Codon pair analysis revealed high occurrence of identical codon pair GAG-GAG and GUG-GUG in both up- and downregulated genes
In up genes, 1591 codon pairs existed, while down genes had 2048 codon pairs. In up genes, 455 possible codon pairs were absent, while in down genes, all kinds of possible codon pairs were present. In up genes, only codon pair CAG-UUU while in down genes, 06 codon pairs GAG-GAA = 161, AAG-GAA = 137, GAA-GAA = 127, GAG-AAA = 124, AAA-GAA = 106, and CAG-AAA = 92 ending with A/U were present among highly occurring top 20 codon pairs. Similar codon pairs GAG-GAG and GUG-GUG are abundant in up and downregulated gene sets (Table 3). Also codon pairs identical codon pair CAG-CAG (n = 77) was abundant in upregulated genes, while codon pair GAA-GAA (n = 127) was present in downregulated genes.
Top 20 highly Occurring Codon pairs in up and downregulated genes. Identical codon pairs have been depicted as underlined
3′xNN-Nxx Matrix represents that this position is influenced with purifying selection
In the upregulated gene set, at p2-3-p1 positions, TAA, GTA, TAC, GAC, TCG, GTT, and TAT trinucleotides were present in frequency below 2%. Surprisingly TGA, which forms a stop codon, was present in frequency above 10%, and TAG and TAA are 2% and 1.53%, respectively. In downregulated genes, only CGA and TAG had a frequency below 2%, and stop codons TGA, TAA, and TAG had a frequency of 9.35%, 2.28%, and 1.99%, respectively (Table 4).
3′ xNN-Nxx Matrix for up and downregulated gene transcripts (Percent occurrence)
Dinucleotide analysis at codon pair junction
Among 16 dinucleotides, CpG and TpA at p3-p1 are very low in frequency in up and downregulated genes. Apart from that, ApC dinucleotide at the p3-p1 junction is also low in frequency and present below 15%. ApA also present in low frequency in upregulated genes, but the same is not true for downregulated genes. Apart ApA dinucleotide, the trend of frequency of dinucleotide at p3-p1 junction is similar for both the up and downregulated genes (Fig. 8). The trend has been depicted through.

Dinucleotide frequency at p3-p1 junction of codons in up- and downregulated genes.
DISCUSSION
AD is a disease that is characterized by neuronal degeneration. 48 Viral etiology for AD is known, and several viruses have been reported to contribute to progression of AD, including Herpes Simplex type 1 and 2, Epstein–Barr virus, human cytomegalovirus, influenza virus, hepatitis C virus, and COVID-19. There have been reported many molecular changes in the COVID-19 brains that contribute to predisposition to AD. 49 In the present study, we envisaged investigation of codon usage pattern, various forces affecting the gene architecture like composition, mutation and selection forces, codon pair bias, differential display of codon pair bias in up and downregulated genes, rare codon analysis, and dinucleotide pattern analysis at codon junction.
In p2,3-p1 positions, the frequency of formation of stop codons below 2% is the result, which is obvious since the formation of the stop codons is avoided due to selective forces. 35 However, in upregulated genes, two out of three codons had a frequency above 2% (TAG and TGA). The same is visible in downregulated genes with two stop codons above 2% (TGA and TTA with a frequency above 9% and 2%, respectively). It indicates that the p2,3-p1 position has a mere role in purifying selection.
In the present study, based on the occurrence of several codon pair analyses, we found an abundance of identical codon pairs. For the subsequence of similar amino acids, codons that use similar tRNA and, thus, identical codons are used. Thus, the usage of identical codons appears to result from favor for the translation process. Presence of identical codons cause recharging of the tRNA to translate both codons before it diffuse. Co-tRNA and identical codon pairing conserve resources and increase translational efficacy by approximately 30%. 50 It also is established that translational dynamics significantly leaves a signature on the genome. 51 GTG-GTG and CTG-CTG codon pairs have been reported to be the most favored codon pairs in the depression-associated gene set. 52 In the proteome of E. coli MG1655, proline codon pairs exhibited regulatory role in translation. 53
The TGA codon has a higher occurrence frequency in both gene sets than TAA and TAG. TGA is a selective advantage over another stop codon since these three termination codons are not entirely synonymous, and their ability to act as termination codons varies. 54 TAA codon is most efficient in termination. In contrast, TGA is the least efficient, and significant readthrough has been observed. 55 A positive selection towards TGA has been observed since the readthrough process is a highly regulated mechanism to expand the proteome diversity so that additional C-terminally modified protein variants may be generated. 56
A negative selection for codons with TpA and CpG as integral parts is a common phenomenon. 57 Other than stop codon, the codons, which are rare (occurrence below 0.5%) in both up (codons CGU – Arg, AUA – Ile, UUA – Leu, UCG – Ser, GUA – Val, CGA – Arg) and downregulated genes (CUA – Leu, UCG – Ser, UUA – Leu), all contain TpA or CpG as integral part. 24 TpA being part of stop codon TAA and CpG being predisposed to mutations by deamination of 5-methylcytosine at CpG sites resulting in C to T changes.58,59, 58,59
CpG and TpA at p3-p1 are underrepresented in both up- and downregulated genes. However, TpA and CpG underrepresentation at the p3-1 junction suggests the role of other forces, like immune pressure, high mutability resulting in a transition from CpG to TpG, selection forces, the mRNA destabilizing effect of TpA, and higher susceptibility of TpA to cytoplasmic RNase. 60
Codon pairs influence the translation process. 61 In upregulated genes, five out of ten codon pairs were initiated with glutamine. In co morbidity case of cancer and neurodegeneration, in APP, CCND1, PTPA, and APP genes also exhibited abundance of Glutamine initiated codonpair. 62
In a study encompassing 14,026 human genes, it is revealed that the selection pressure is responsible for the heterogeneity of C content at the third codon position. 63 G/C ending codons usage increases with increasing GC bias and vice versa.64,65, 64,65 In the present study, in an upregulated gene, GC content at the third codon position was higher than average AT content, and thus, G/C ending codons were preferred and concord with the phenomenon mentioned above. Though in the downregulated gene set, GC content at the third codon position was also high, no clear trend of preference for G/C ending codons was observed. Thus, it can be inferred that other factors besides compositional forces can influence nucleotide bias at the third codon position. In parity plot analysis, it is evident that T is preferred over A in both gene sets. This result might be partially explained based on composition since in the up gene, the occurrence of % A is less than % T. However, the same is not true for the down genes, where % A and % T compositions are not much dissimilar.
Several forces shape the genome of any organism, including selection, mutation, and compositional forces. In the above paragraph, we saw the impact of composition on codon bias. We further investigated whether other forces, like selection forces, are operating. A regression analysis between % GC3 and % GC12 revealed 52.08% and 71.51% selection forces in up- and downregulated genes, respectively.
Gene length is associated with many factors like intron number and gene duplication. Longer genes are tissue-specific, like most extended transcripts, and tend to be expressed in the blood vessels, nerves, thyroid, cervix uteri, and the brain. 66 In the neurodegeneration-related genes, codon bias is significantly correlated with codon bias. 67 The codon adaptation index can be used to measure codon bias. It is also a surrogate for protein expression, and CAI can be correlated with gene expression. 68 Brown et al. (2021) have reported a correlation between gene expression and gene length, 69 and the same result has been obtained in our result also, where the correlation has been obtained in both the gene sets. The role of gene length in regulating gene expression has been reported. 69 Highly expressed genes are short;16,66, 16,66 however, in the present study, we found that longer genes have higher expressivity than smaller genes.
Conclusion and future perspectives
The viral cause of neurodegeneration is known, and COVID-19 is one among several viruses that predispose towards AD and related dementias. Transcriptome analysis of AD, control, and COVID-19 patients revealed modulation of several genes where few are upregulated while some are downregulated. The study of nucleotide composition revealed that despite being GC-rich transcripts, only in upregulated genes G/C ending codons were preferred, while in downregulated genes, no such pattern was present. However, up- and downregulated gene sets shared some common features, too. In both the gene sets with an increase in length, gene expression also increased, and selection force was the larger operative force in shaping the transcript architecture compared to mutation forces. All rare codons contained either CpG or TpA as an integral part of them, again suggestive of negative selection. The T nucleotide was preferred in both gene sets over the A nucleotide at the third codon position. An interesting observation was the presence of glutamine-initiated codon pairs in the top 10 high residual valued codon pairs. The present study helps understand the molecular patterns present in these genes, which might, in the future, help find therapeutics against AD in COVID-19 patients.
AUTHOR CONTRIBUTIONS
Yan Liu (Conceptualization; Data curation; Formal analysis; Methodology; Writing – review & editing); Weiyue Xu (Conceptualization; Data curation; Formal analysis; Validation; Writing – review & editing); Pan Yang (Conceptualization; Data curation; Formal analysis; Resources; Writing – original draft); Xingshun Liu (Conceptualization; Data curation; Formal analysis; Investigation; Methodology; Writing – review & editing).
Footnotes
ACKNOWLEDGMENTS
Authors acknowledge support from their respective universities.
FUNDING
The authors have no funding to report.
CONFLICT OF INTEREST
The authors have no conflict of interest to report.
DATA AVAILABILITY
The data supporting the findings of this study are available on request from the corresponding author. The data are not publicly available due to privacy or ethical restrictions.